HAL Id: hal-00784798
https://hal-mines-paristech.archives-ouvertes.fr/hal-00784798
Submitted on 4 Feb 2013
HAL is a multi-disciplinary open access
archive for the deposit and dissemination of
sci-entific research documents, whether they are
pub-lished or not. The documents may come from
teaching and research institutions in France or
abroad, or from public or private research centers.
L’archive ouverte pluridisciplinaire HAL, est
destinée au dépôt et à la diffusion de documents
scientifiques de niveau recherche, publiés ou non,
émanant des établissements d’enseignement et de
recherche français ou étrangers, des laboratoires
publics ou privés.
Simplified life cycle approach: GHG variability
assessment for onshore wind electricity based on
Monte-Carlo simulations
Pierryves Padey, Denis Le Boulch, Isabelle Blanc
To cite this version:
Pierryves Padey, Denis Le Boulch, Isabelle Blanc. Simplified life cycle approach: GHG variability
assessment for onshore wind electricity based on Monte-Carlo simulations. 6th SETAC World Congress
/ SETAC Europe 22nd Annual Meeting, May 2012, Berlin, Germany. 2 p. �hal-00784798�
Simplified life cycle approach: GHG variability assessment for
onshore wind electricity based on Monte-Carlo simulations
Pierryves Padey
1,2, Denis Le Boulch
2, Isabelle Blanc
11
MINES ParisTech, 1, rue Claude Daunesse, F-06904 Sophia Antipolis Cedex, France
2
EDF R&D, Les Renardières 77818 Moret sur Loing Cedex, France E-mail contact: pierryves.padey@edf.fr
1. Introduction
The environmental impacts of electricity production systems have been widely assessed over the past years with many published LCAs in the literature. In the special case of greenhouses gases (GHG) from wind power electricity, the LCA results variability observed is very high, for example ranging from 2 to 81 g CO2eq/kWh in a literature review performed by the IPCC [1]. Such result might lead policy makers to consider
LCA as an inconclusive method [2].
The main objective of this paper is to build a representative model of onshore wind turbines environmental performances with a simplified life cycle approach. Variability of GHG performances of onshore wind turbines, generated for a representative sample, is assessed through the running of Monte-Carlo simulations to identify the key parameters having the biggest influence on the results. Finally, this methodology will enable to define generic curves of onshore wind power electricity GHG as a simplified function of these key parameters.
2. Method
The methodology developed to establish a generic GHG performance curve is described according to the 6 steps below (more details on the methodology is to be found in [3]):
1. An extended literature survey on LCAs of onshore wind power electricity is performed to obtain a clear overview of the most representative assumptions taken in the literature and their related variability. 2. GHG impacts of onshore wind turbines (WT) are analysed by disaggrating the existing onshore wind
turbine inventory in ecoinvent v2.2 model [4].
3. These two steps enable to define a reference wind turbine model, representative of the current WT technologies.
4. This WT model is applied to build the sample inventories representative of the recent wind power market (the sample is made of 17 WTs).
5. By performing standard sensitivity analyses on LCAs results from this sample, the identification of two key parameters (the turbine life time and the wind speed) are identified. GHG performances generic curves are then elaborated on these two key parameters.
6. Finally a validation process is performed in order to assess the range of validity of the simplified model made out from these generic curves by comparing them with reference LCA studies.
Two limitations on this methodology are now discussed. These first results were based on a restricted wind turbine sample and local sensitivity analyses were not handling the variability issue in a comprehensive way
[5]. We therefore propose here an enhanced version of the initial methodology reported in [3] by applying a
Monte-Carlo simulation step to a more representative sample. With this step, the sample restriction as well as the limitation of the local sensitivity analysis approach will be overcome.
For the Monte-Carlo simulations, we used the following equation to calculate the GHG performances defined as the ratio between the environmental impacts of the onshore turbine over the electricity produced over its life time:
Each parameter and its related distribution need to be characterized for the Monte-Carlo simulations:
- P is the nominal WT power in kW and characterized as a discrete function of the installed WT statistics in France between 2003 and 2008, ranging from 800kW to 3500kW with a high probability for 2000 kW. - LT is the system lifetime. According to expert discussions and literature review, this parameter range from
10 to 30 years with a normal distribution centred on 20 years, with a standard deviation (SD) of 3 years. - A is the availability factor considering the real time when the WT is working compared to the theory. It
- The WT impacts have been modelled using empirical equations to size the wind turbine as a function of their nominal power. These equations have been defined with an extended literature survey of the different existing WT. To consider uncertainty of this approach, for each flow, an uncertainty of ±15% has been associated.
- L is the load factor parameter. It represents an equivalent annual percentage when the WT is producing at nominal power. It is the product between the WT power curves and the wind speed Weibull distribution (details in [3]).
3. Results
The Monte-Carlo simulations have been performed on 25 000 runs varying each input according to the defined distributions.
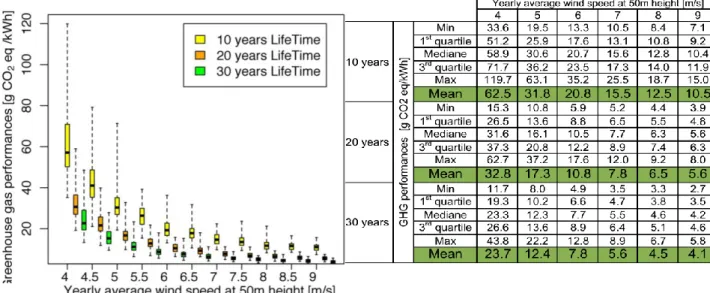
Figure 1 and Table 1: Wind power electricity GHG performances as a function of the main parameters (25’000 simulations) Based on these Monte-Carlo simulations, we plotted GHG performances distributions for two key identified parameters: the WT life time and annual wind speed. Results are ranging from 2.7 to 119.7g CO2eq/kWh, a
range which is comparable to the litterature review observed in [1].
4. Conclusions
The initial methodology to generate simplified models for WT environmental performances has been improved with a better identification of the variability assessment. A systematic representative sample has been defined on which Monte-Carlo simulations have been applied. Running Monte-Carlo simulations on a representative model of onshore wind turbines (mostly 2 MW WT) has confirmed that GHG performances variability is mainly explained by the WT lifetime and the wind speed. A set of generic GHG performances curves has been defined as a function of these key parameters. The obtained results range between 2.7 to 119.7 g CO2 eq/kWh and can be adjusted as a function of either one or both key parameters. This
methodology will be applied later for all types of electricity generation systems.
5. References
[1] IPCC: O. Edenhofer, R. Pichs-Madruga, Y. Sokona, K. Seyboth, P. Matschoss, S. Kadner, T. Zwickel, P. Eickemeier, G. Hansen,S. Schlömer, C. von Stechow. IPCC Special Report on Renewable Energy Sources and Climate Change Mitigation. Cambridge, United Kingdom and New York, NY, USA. 2011.
[2] Heath, G., Brandao,M. Meta-Analysis of Life Cycle Assessments. Journal of industrial Ecology – Call for paper - Special Issue. 2009.
[3] Padey, P., Blanc, I., Le Boulch, D., Zhao, X., A simplified life cycle approach for assessing GHG emissions of wind electricity. Journal of Industrial Ecology, accepted November 19th, 2011.
[4] Dones R., Bauer C., Bolliger R., Burger B., Faist Emmenegger M., Frischknecht R., Heck T., Jungbluth N., Röder A., Tuchschmid M., “Life Cycle Inventories of Energy Systems: Results for the Current Systems in Switzerland and other UCTE Countries”, Ecoinvent report No. 5, Paul Scherrer Institut Villigen, Swiss Center for Life Cycle Inventories, Dübendorf, CH, 2007
[5] Saltelli, A.,Ratto, M., Tarantola, S., Campolongo, F.,JRC. Sensitivity analysis practices: Strategies for model-based inference. Reliability Engineering and System Safety. 2006. pp. 1109–1125.