HAL Id: hal-02007131
https://hal.archives-ouvertes.fr/hal-02007131
Submitted on 24 Oct 2019
HAL is a multi-disciplinary open access
archive for the deposit and dissemination of
sci-entific research documents, whether they are
pub-lished or not. The documents may come from
teaching and research institutions in France or
abroad, or from public or private research centers.
L’archive ouverte pluridisciplinaire HAL, est
destinée au dépôt et à la diffusion de documents
scientifiques de niveau recherche, publiés ou non,
émanant des établissements d’enseignement et de
recherche français ou étrangers, des laboratoires
publics ou privés.
To cite this version:
Younes Salami, Christophe Dano, Pierre-Yves Hicher.
Infrared thermography of rock fracture.
Géotechnique Letters, ICE Publishing, 2017, 7 (1), pp.36-40. �10.1680/jgele.16.00131�. �hal-02007131�
Infrared thermography of rock fracture
Y. SALAMI*, C. DANO{ and P. Y. HICHER*
Grain crushing is in part responsible for soil plasticity and dissipates most of the input energy at high stresses. This energy dissipation, as well as the energy dissipated by friction, occurs through heat exchanges. Real-time observations of temperature fields on the surface of a breaking specimen are performed by the infrared thermography technique to determine the heat generated at the crack tip when a crack is propagating. This research was motivated by recent trends in soil mechanics where constitutive models have been developed based on thermodynamic potentials including energy dissipation. A high-speed infrared camera was used to monitor the cracking of multiple specimens of rock and mortar in a diametral compression configuration. In the case of rock specimens, cracking was accompanied by a sudden rise in temperature. No temperature changes were observed in the case of mortar specimens. The maximum temperature reached and the heat dissipation profile attained depend on the nature of the rock specimen.
KEYWORDS: particle crushing/crushability; rocks/rock mechanics; temperature effects
INTRODUCTION
The process of fracture in solids is always accompanied by energy losses that can dissipate through different forms. The elastic strain energy, initially stored in the solid, contributes to the three major mechanical losses that can occur during the fracture process: loss due to the breakage of atomic bonds at the tips of the moving crack, generally referred to as surface energy, since they result in an increase of the surface at the crack sides; loss due to the transformation of strain energy into kinetic energy needed to increase the opening of the fracture by moving the crack sides apart; and loss by plastic deformation in the vicinity of the crack tips, known as plastic energy. It was shown that the largest part of the plastic energy is dissipated as heat (Luong, 1990, 1993, 2007).
Plasticity cannot be regarded as the only source of heat production, since a lot of mechanisms can lead to the gen-eration of heat in the stressed material before fracture. The thermoelastic effect may be given as an example where the mechanical energy is reversibly converted to thermal energy: hence, under uniaxial loading, a slight decrease of the surface temperature in tension has been observed in metals, and in contrast, a slight increase is observed in com-pression (Bodelot et al., 2011). Friction between the newly created fragments can also lead to an increase in tempera-ture. However, the only mechanism of heat generation associ-ated with the fracture process is the dissipation of a fraction of the plastic work concentrated ahead of a moving crack.
Tracking the temperature field around a crack, and quan-tifying the heat generated during the cracking process could lead to a better understanding of the energy partitions of the process of cracking. However, the measurement of the tem-perature field generated by a moving crack poses two prob-lems: the temperatures are highly localised, and the changes occur very rapidly. The measurement device should then have a high spatial resolution and a short response time.
The first attempt to quantify experimentally the tem-perature fields around a crack can probably be credited to Döll (1973), who used thermocouples for temperature measurement. However, the thermocouples provide discrete temperature measurements in multiple points, and cannot be placed in the crack path. Kobayashi et al. (1982) suggested using cholesteric liquid crystal films to study the heat evol-ution during fracture, and since the colour-sensitive liquid crystal provides thermal boundary front plots, they were able to overcome the limitations of the thermocouples. This technique coupled with a wire scheme triggering a camera once the crack reaches a certain length may be one of the first attempts to exploit thermal imaging logic, even though Fuller et al. (1975) were the first to introduce thermography in the field of fracture mechanics and used high-speed cameras along with other techniques to measure the tem-perature changes caused by a crack in poly(methyl metha-crylate) known as acrylic glass. Since then, thermography remains a tool of choice in the field of fracture mechanics (Luong, 1990; Liu et al., 2006).
To model the temperature rise at the tip of a crack, Weichert & Schönert (1978) considered the crack tip to be a moving heat source of a certain form and dimension (circular or squared), and computed the evolution of the temperature fields around it. This solution is best suited to slow moving cracks. For fast moving cracks, Carslaw & Jaeger’s (1959) solution to the heat conduction equation for an instantaneous line source is generally considered.
The main goal of this paper is to explore the field of rock fracture through the process of energy dissipation caused by an inelastic behaviour. Infrared thermography was used to monitor diametric compression tests of cylindrical rock specimens. The dissipation of plastic energy at the tip of a crack through heat generation, a mechanism usually associ-ated with ductile fracture mechanics, was shown to be valid for the brittle fracture of rock materials.
THE EXPERIMENTAL SET-UP
A high-speed infrared camera was used to monitor the fracture of a rock disc in a diametral compression test. The camera is able to measure electromagnetic radiation *LUNAM University, Ecole Centrale de Nantes, Nantes, France.
52 mm and a width of 22 mm. The materials tested consist of limestone, shale, granite and a mortar manufactured according to the French standard NF EN 196-1 (Afnor, 2006) by mixing Hostun siliceous sand HN 0·6/1·6 with CEM1 52·5R cement and water (the water to cement ratio is 0·5). The mortar specimens are left in a humidity chamber (100% relative humidity and a temperature of 18°C) for 28 days. The rock specimens were extracted from much larger blocks using a coring tool and lubrication to aid drilling. This technique allows shaping the specimens into the desired cylindrical form. The specimen, initially at room temperature (20°C), was put inside a diametric compression device which was placed in a 50 kN loading frame. The force and displacements were monitored using a load cell and displacement transducers, with respective resolutions of 0·06 kN and 0·01 mm. The speed of loading was set to 0·5 mm/min for all the tests.
The high-speed infrared camera (Jade MWIR, Cedip Infrared Systems) has a pixel resolution of (320 × 256), and is able to shoot videos with up to 1250 fps (frames per second) for a temperature range of 5–60°C and a sensitivity of 0·1°C. The number of frames per seconds depends on the resolution chosen. A quarter resolution of (80 × 64) pixels is used for most tests, allowing the camera to shoot at a maximum frame rate of 500 fps. The camera is placed at exactly 1 m from the specimens, and the distance is programmed in the software to compute the temperatures from the
THE EXPERIMENTAL PROCESS
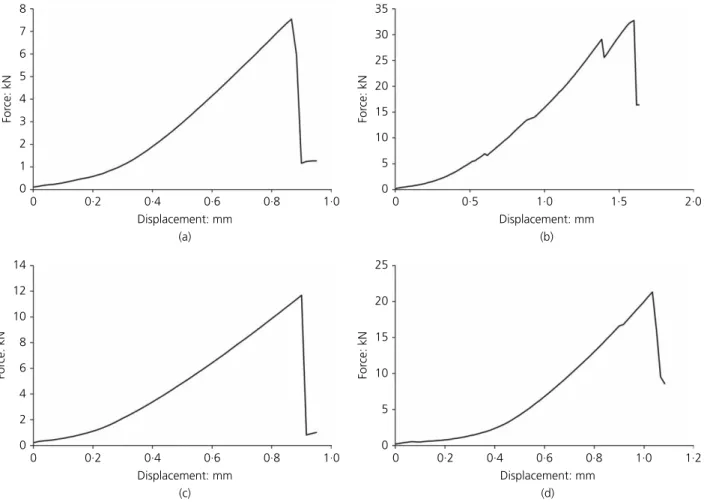
The extraction technique of the rock specimens resulted in the formation of a damage zone in the peripheral boundary of the cylindrical specimen, which may affect the initiation of the crack and its propagation. In addition, the rocks exhibit a natural variability, which is caused by heterogene-ities in the distribution of minerals and flaws within the material. Due to this effect and since the acquisition speed of the camera is not high enough to follow the propagation of the fracture, several test results were highly scattered, and could not be exploited. Out of all the diametral compression tests conducted, the authors were able to compile the results of five tests for each specimen that were comparable, and apt to best characterise the thermomechanical behaviour of the rock. Figure 1 represents the typical mechanical behaviour of a specimen for each tested material.
Before the initiation of fracture, the material underwent an elastic phase where thermomechanical heat exchanges occurred. The thermoelastic effect, which represents the coupling between elastic deformations and thermal energy in an adiabatic transformation, was clearly observed in the limestone, granite and shale specimens as the temperature decreased linearly with time (Fig. 2). This linear behaviour is governed by Kelvin’s equation, which requires knowledge of
8 7 6 5 4 3 2 1 0 Displacement: mm 0 0·2 0·4 0·6 0·8 1·0 Displacement: mm (a) (b) 0 0·5 1·0 1·5 2·0 Displacement: mm 0 0·2 0·4 0·6 0·8 1·0 0 0·2 0·4 0·6 0·8 1·0 1·2 Displacement: mm (c) (d) For ce: kN For ce: kN 35 30 25 20 15 10 5 0 For ce: kN 25 20 15 10 5 0 For ce: kN 0 2 4 6 8 10 12 14
the specific heat of the material at constant deformation, density and coefficient of thermal expansion.
Recent results by Salami et al. (2015) have shown that, in the case of a diametral compression with non-conforming contacts between the specimen and the frame, cracks develop near the two contacts and propagate towards the centre of the specimen. This crack development mechanism was only thought to be valid during dynamic loadings (Tsoungui et al., 1999). In the thermographic images in Fig. 3, the temperature is uniform near the centre of the specimen and unaffected by the thermoelastic effect, which only affects in the regions near the contacts, suggesting that the tensile stresses causing the initiation fracture are not concentrated near the centre, but rather near the contacts. This observation contradicts the widely accepted conception of the diametric loading of a cylindrical specimen, wherein the crack initiation occurs in the centre of the sample. However, it was confirmed experimentally by Stirling et al. (2013) and theoretically by Wang & Xing (1999) that the fracture starts near the contacts when the contacts are non-conforming. Experimental evidence using digital image correlation can be found in Salami et al. (2015).
The high-speed infrared camera was able to detect tem-perature rises at the initiation of the crack, and temtem-perature changes along the newly created surface, even though the temporal resolution of the camera is too small to follow crack propagation. It should be noted that the temperatures presented in this paper have been carefully extracted from surface distributions, by neglecting the temperature changes caused by friction of the two main fragments, and friction between the smaller, newly detached fragments. Indeed, it is
possible to distinguish between the two phenomena, because the heat generated by the dissipation of the plastic energy at the tip of the crack is highly localised, and occurs during fracture, before the failure of the specimen (the high acqui-sition rate of the camera allows us to make this distinction). This means that no significant displacement of the loading plate is observed. By contrast, the heat generated from friction is always accompanied by important movements of the fragments and the loading plate. It is also distributed along the fractured surface, and takes longer to dissipate.
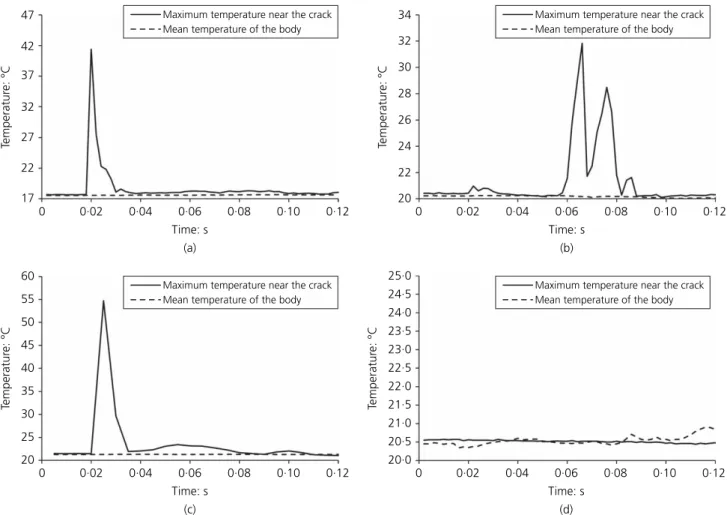
To extract the temperature changes caused by fracture, a thin zone around the cracking zone along the loading axis is first defined. The maximum temperature within this zone can then be calculated. The authors then isolated the frames where a rock chip with a significantly higher temperature was inside the defined zone, and corrected it. The mean temperature of the body was measured at a point far away from the crack.
The results are presented in Fig. 4, where a peak is observed whenever the fracture occurs. In the specimens where multiple cracks developed, a temperature rise corre-sponding to each fracture was recorded (Figs 2(b) and 4(b) corresponding to the granite). The temperature changes are in the order of 20°C in the case of limestone, 30°C in the case of shale and 10°C in the case of granite (gross value based on the five tests considered). No temperature change caused by fracture was observed in the mortar specimens.
It is interesting to note that the highest temperature change was observed in shale, the specimen with the lowest mechanical resistance. In contrast, granite, which is more resistant than the other rocks tested, produces the least heat. 21·2 21·0 20·8 20·6 20·4 20·2 20·0 19·8 Temperatur e: °C 21·0 20·9 20·8 20·7 20·6 20·5 20·4 20·3 20·2 20·1 21·1 Temperatur e: °C 0 20 40 60 Time: s (a) Force: kN (b) 80 100 120 0 5 10 15 Limestone Granite Shale Limestone Granite Shale
Fig. 2. Thermoelastic effect observed in the three rock specimens: the temperature is plotted as a function of the force in (a) and as a function of the duration of the loading (time) in (b)
23·58(°C) 22·44 21·29 20·15 19·00 23·58(°C) 22·44 21·29 20·15 19·00 (a) (b)
Fig. 3. A comparison between thermographic images at (a) the start of the test and (b) at the end of the test. The thermoelastic effect indicates a concentration of the tensile stresses near the contacts. Temperatures in °C
This could be explained by the differences between the specimens from a mineralogical point of view. The shale studied is micaceous shale composed of muscovite, biotite and quartz. The alternation of white (muscovite) and black (biotite) micaceous sheets gives the material an apparent schistosity, which renders it weak. However, the crack prop-agates within the muscovite, a relatively ductile material, which causes a considerable amount of heat to develop. As for the granite, which is a volcanic rock with an extremely high resistance, it is composed of feldspar minerals, biotite and quartz. During fracture, the authors observed that the
crack propagates inside the feldspar matrix, and does not break the stronger quartz and biotite crystals. Since the feldspar phase is very brittle, the heat generation is minimal. The metamorphic limestone (marble) is homogeneous, and mainly contains recrystallised calcite which has a moderate resistance.
The microstructure of the mortar and the way it affects the fracture behaviour could explain the lack of a temperature rise in Fig. 4(d). Mortar, like the rock specimens studied, is a brittle material. Most of the time, however, the term quasi-brittle is used instead of quasi-brittle, to explain the crack initiation
Maximum temperature near the crack Mean temperature of the body Maximum temperature near the crack
Mean temperature of the body
Time: s (a) 0 0·02 0·04 0·06 0·08 0·10 0·12 Time: s (b) 0 0·02 0·04 0·06 0·08 0·10 0·12 Time: s (c) 0 0·02 0·04 0·06 0·08 0·10 0·12 Time: s (d) 0 0·02 0·04 0·06 0·08 0·10 0·12 32 27 22 17 60 55 50 45 40 35 30 25 20 20·0 20·5 21·5 22·5 23·5 24·5 21·0 22·0 23·0 24·0 25·0 Temperatur Temperatur e: °C 26 24 22 20 Temperatur Temperatur e: °C
Fig. 4. Typical temperature evolution curves near the crack zone for (a) the limestone, (b) the granite, (c) the shale and (d) the mortar
Sand grain
Fracture
400 µm 200 µm 100 µm
(a) (b) (c)
Fig. 5. Microscopic images of (a) the fracture detaching a grain of sand from the cement paste, (b) an unbroken sand particle at the surface of the fracture, (c) a broken grain of sand at the surface of the fracture
and its mode of propagation. During the loading of a mortar, subcritical cracking precedes failure. This nucleation of microcracks is caused by a detachment process at the cement–sand boundary, and is referred to in the literature as microplasticity. For each microcrack, the plastic zone at the tip cannot fully develop. The energy concentrated in this zone is dissipated on reaching a sand particle, and the dis-location of the grain stops the microcrack. Grains that are effectively larger or weaker may break, allowing the crack to advance. At the macrocrack level, a damage zone develops ahead of the crack, which results in more microcracks that will eventually link up with each other and with the pre-existing microcracks, and allow the macrocrack extension.
Figure 5(a) shows microscopic observations of a stable fracture propagating through the cement paste and in the process of dislocating a grain of sand from the cement matrix. The surface of the fracture shows a higher number of unbroken grains (Fig. 5(b)) than the fractured ones (Fig. 5(c)).
Thermographic images of fracture in a limestone speci-men are shown in Fig. 6. The limestone specispeci-men was chosen as an example because the cracks occurred less abruptly, and the thermal image was not disturbed by fragments flying around. The propagation of the fracture is clearly visible in frame (a), where a small zone near the centre of the specimen is at a higher temperature. It should be specified that the fracture started near the contact before propagating to the centre of the specimen where the thermographic picture was taken. As the flanks of the crack move away, much higher temperatures developing in the top half of the crack surface can be noted.
CONCLUSIONS
The work presented in this paper concerns an experimental investigation of the process of heat generation that accom-panies fracture in rocks and rock-like materials. Except for the mortar specimen, a temperature rise was always observed in fractured rock specimens. These temperature rises varied from one specimen to another. It was shown that the micro-structure of the rock plays a determining role in the crack propagation process and in the ensuing temperature rise.
The next step in the authors’ research will be to manufac-ture a rock-like material, where the thermomechanical beha-viour can be controlled and predicted. High-performance cement paste shows promising results. The stresses at the tip of the crack could eventually be estimated and linked to heat dissipation. Moreover, the fracture process needs to be controlled by testing the specimens in a configuration that reduces the crack velocity in order to track the propagation of the crack. In the current diametric compression configur-ation, the authors cannot confirm that the maximum temperature recorded in the zone of fracture is indeed the
maximum temperature resulting from the crack tip energy dissipation. In a test that permits a stable cracking process, the results should be more reliable.
REFERENCES
Afnor (2006). NF EN 196-1: Méthodes d’essais des ciments – Partie 1: détermination des résistances mécaniques. Saint-Denis La Pleine, France: Afnor (in French).
Bodelot, L., Charkaluk, E., Sabatier, L. & Dufrénoy, P. (2011). Experimental study of heterogeneities in strain and temperature fields at the microstructural level of polycrystalline metals through fully-coupled full-field measurements by digital image correlation and infrared thermography. Mech. Mater. 43, No. 11, 654–670.
Carslaw, H. S. & Jaeger, J. C. (1959). Conduction of heat in solids, 2nd edn. Oxford, UK: Oxford University Press.
Döll, W. (1973). An experimental study of the heat generated in the plastic region of a running crack in different polymeric materials.
Engng Fract. Mech. 5, No. 2, 259–268.
Fuller, K. N. G., Fox, P. G. & Field, J. E. (1975). The temperature rise at the tip of fast-moving cracks in glassy polymers.
Proc. R. Soc. A, Math. Phys. Engng Sci. 341, No. 1627, 537–557.
Kobayashi, A., Munemura, M., Ohtani, N. & Suemasu, H. (1982). Estimation of heat evolution during viscoelastic crack propa-gation by liquid crystal film technique. J. Appl. Polym. Sci. 27, No. 10, 3763–3768.
Liu, S., Wu, L. & Wu, Y. (2006). Infrared radiation of rock at failure.
Int. J. Rock Mech. Min. Sci. 43, No. 6, 972–979.
Luong, M. P. (1990). Infrared thermovision of damage processes in concrete and rock. Engng Fract. Mech. 35, No. 1–3, 291–301. Luong, M. P. (1993). Infrared thermographic observations of rock
failure. In Comprehensive rock engineering principles (ed. J. A. Hudson), vol. 4, pp. 715–730. Oxford, UK: Pergamon Press. Luong, M. P. (2007). Introducing infrared thermography in soil
dynamics. Infrared Phys. Technol. 49, No. 3, 306–311. Salami, Y., Dano, C., Hicher, P.-Y., Colombo, G. & Denain, P.
(2015). The effects of the coordination on the fragmentation of a single grain. IOP conference series: earth and environmental
science, vol. 26, pp. 12–15. Bristol, UK: IOP Publishing.
Stirling, R. A., Simpson, D. J. & Davie, C. T. (2013). The application of digital image correlation to Brazilian testing of sandstone. Int. J. Rock Mech. Min. Sci. 60, 1–11.
Tsoungui, O., Vallet, D., Charmet, J.-C. & Roux, S. (1999). Size effects in single grain fragmentation. Granular Matter 2, 19–27. Wang, Q. Z. & Xing, L. (1999). Determination of fracture toughness KIC by using the flattened Brazilian disk specimen for rocks. Engng Fract. Mech. 64, No. 2, 193–201.
Weichert, R. & Schönert, K. (1978). Heat generation at the tip of a moving crack. J. Mech. Phys. Solids 26, No. 3, 151–161. 33·47(°C) 29·85 26·23 22·62 19·00 33·47(°C) 29·85 26·23 22·62 19·00 33·47(°C) 29·85 26·23 22·62 19·00 (a) (b) (c) The initiation of fracture
Fig. 6. Thermographic images of the fracture process in a limestone specimen at (a) t = 0·025 s, (b) t = 0·030 s and (c) t = 0·035 s Infrared thermography of rock fracture