HAL Id: hal-00674953
https://hal-mines-paristech.archives-ouvertes.fr/hal-00674953
Submitted on 23 Aug 2012
HAL is a multi-disciplinary open access
archive for the deposit and dissemination of sci-entific research documents, whether they are pub-lished or not. The documents may come from teaching and research institutions in France or abroad, or from public or private research centers.
L’archive ouverte pluridisciplinaire HAL, est destinée au dépôt et à la diffusion de documents scientifiques de niveau recherche, publiés ou non, émanant des établissements d’enseignement et de recherche français ou étrangers, des laboratoires publics ou privés.
Latent and Manifested flatness predictions in thin strip
cold rolling using a general rolling FEM model
Sami Abdelkhalek, Hamid Zahrouni, Pierre Montmitonnet, Nicolas Legrand,
Michel Potier-Ferry
To cite this version:
Sami Abdelkhalek, Hamid Zahrouni, Pierre Montmitonnet, Nicolas Legrand, Michel Potier-Ferry. Latent and Manifested flatness predictions in thin strip cold rolling using a general rolling FEM model. 10th International Conference on Technology of Plasticity, ICTP 2011, Sep 2011, Aachen, Germany. p. 111-116. �hal-00674953�
Latent and Manifested Flatness Predictions in Thin Strip Cold Rolling: Comparison of
Coupled and non-Coupled FEM Approaches
S. Abdelkhalek1,2,3), H. Zahrouni1), P. Montmitonnet2)*, N. Legrand3), M. Potier-Ferry1)
1) Laboratoire d’Etude des Microstructures et de Mécanique des Matériaux (LEM3, UMR CNRS 7239), Université Paul Verlaine, Metz /
France; 2) Centre for Materials Forming (CEMEF, UMR CNRS 7635), MINES-ParisTech, Sophia-Antipolis / France; 3) ArcelorMittal Re-search Maizières, R&D Industrial Operations, Maizières-les-Metz / France
* Corresponding author: E-mail address: [email protected] ; Tel.: +33 4 93 95 74 14
Abstract
Flatness defects in thin strip cold rolling are a consequence of roll thermo-elastic deformation and the resulting heterogeneous strip plastic deformation. But in the case of on-line, manifested flatness defects, buckling reorganizes the stress field in the pre- and post-bite areas, which might impact strain and stress fields in the bite or at its ends. Such effects have always been neglected in the past. The purpose of the present paper is to present two coupled approaches to examine to what extent such potential in-bite / out-of-bite feedback determines the in-bite fields and the flatness of the strip. Using both methods and comparing with the standard case where buckling is not accounted for, it has been shown that (i) taking buckling into account results in completely different stress fields and fits correctly the measured on-line residual stresses under tension (“stress-meter rolls”); (ii) coupling buckling in the post-bite area and the rolling model, whatever the tech-nique, changes little the in-bite fields; differences, if any, concentrate in the immediate vicinity of the bite exit; (iii) but in the case where manifested flatness defects occur, these tiny interactions (namely, through the exit velocity transverse profile) are essential for the precise description of the residual stresses and for accurate flatness prediction.
Keywords: Cold strip rolling, Buckling, Flatness defects, 3D FEM, Shell FEM, Asymptotic Numerical Method
Introduction
Due to rolls deforming elastically, the roll gap is not uni-form in the width direction. As a result, strip reduction slightly depends on the width coordinate y. This induces residual stresses which, for thin strips, may be compres-sive locally in spite of the strip tension applied. In such cases, on-line manifested flatness defects may occur (Fig.
1). These are non developable, out-of-plane displacements
due to elastic or plastic buckling, mostly in the form of periodic waves (centre waves, edge waves…).
Figure 1. Flatness defects.
Even in the case where the strip tension is high enough to maintain the strip flat (i.e. avoid buckling), residual stresses are present. The profile xx(y) can be measured
using stress-meter rolls located beyond the stand. When the strip tension is relaxed, they may induce buckling and flatness defects. This is the reason why such stress profiles are called “latent flatness defects”.
Flatness defects are a major problem encountered on hot strip mills, and still worse on cold mills – the thinner the strip, the easier buckling is. It is essential to model their
occurrence and severity, and investigate their correction using flatness actuators such as roll bending.
If defects are only latent, the stress field computed be-yond the bite by e.g. a 3D FEM model should be correct. In such a case, buckling upon unloading the strip tension is generally dealt with using uncoupled approaches: the stress pattern computed by the strip rolling model are transferred into a buckling (shell) model, which tells if the critical conditions for buckling are met, and computes post-buckling data (wavelength, amplitude of defects).
However, if defects are manifested on-line, the stress field is completely transformed; as will be shown, the solution coming out of the 3D FEM is completely irrele-vant beyond the bite – i.e. where buckling occurs. Fur-thermore, the question arises of the impact of this stress reorganization on the strains and stresses within the bite. The purpose of the present paper is therefore to describe and apply two coupled rolling / buckling models, to ad-dress the abovementioned issue.
Literature survey
A number of uncoupled techniques have been presented in the literature. The standard solution of Timoshenko and Woinovsky-Krieger (1940) solves the von Karman equa-tion for a rectangular plate, assuming sinusoidal waves in both x and y directions, and clamping boundary condi-tions. The critical load depends on the width-to-length ratio, the wavelength is of the order of the width.
This model is built for plate buckling under homogene-ous stress boundary conditions, and is not adapted to the complex fields of strip rolling. Several authors have ex-tended it to loadings consisting in a stress profile along the width. Bush et al. (2001) assume sinusoidal waves in the length (rolling) direction, and a stripwise-defined bound-Roll stack Roll bite Central, Longitudinal, fixed folds Edge waves Rolled strip Rolling Direction x y z Roll stack Roll bite Central, Longitudinal, fixed folds Edge waves Rolled strip Rolling Direction Roll stack Roll bite Central, Longitudinal, fixed folds Edge waves Rolled strip Rolling Direction x y z
ary stress profile across the width. The assumed out-of-plane displacement field is introduced into von Karman’s equation; the critical load parameter and the transverse shape are computed by solving a boundary value problem, and the wavelength is the one giving the lowest critical load.
Only right/left symmetric waves are addressed, whereas real waves are often anti-symmetric. This has been recog-nized by Fischer et al. (2003), who allowed the transverse shape to be either an odd or an even polynomial in y, while remaining sinusoidal in the rolling direction. They determined the strip shape by minimizing the elastic en-ergy of the deformation path from flat to wavy shape.
The latter two are useful, semi-analytical models for edge waves or centre waves only, since only the longitudi-nal stress component is used. Moreover, the type of defect (centre or edge wave) is determined a priori from the shape of the stress profile, and ad hoc boundary conditions are applied to get it in the end.
Yukawa et al. (1986) were among the first to address more complete configurations using numerical (shell FEM) modelling. This was also a non-coupled approach, involving a buckling and a post-buckling analysis. Import-ing the stress field from rollImport-ing, the bifurcation point is detected as the load parameter which leads to a non-definite positive second variation of the total elastic strain energy (or stiffness matrix), the strip being assumed flat (out-of-plane displacement w = 0). This is an eigenvalue problem, the principal vector of which gives the buckling mode. Then a small defect corresponding to this mode is added to the strip geometry; the calculation is restarted with free w(x,y) to give the post-buckled shape and stress, the load step being controlled by a modified Riks method. Abdelkhalek et al. (2009) have described a similar non coupled approach using shell FEM, but where the loading steps are managed by the Asymptotic Numerical Method (Zahrouni et al., 1999, Boutyour et al., 2004). The latter consists in developing the solution (displacement and load parameter) in a power series with respect to a step length parameter, up to a truncation order p. Inserting this series in the non linear equations of the problem and identifying the different orders, results in a succession of p linear systems with the same tangent stiffness matrix, and right-hand side vectors computed from the solutions at lower orders. This allows maximizing the load step and decreas-ing the computational burden. They modelled both the on-line shape (under strip tension) and the relaxed shape, once strip tensions are relieved, whereas the previous papers dealt only with the latter.
Counhaye (2000) was the first to question the decoup-ling of the roldecoup-ling and the buckdecoup-ling model. Using an ap-proach similar to Roddeman et al. (1987a, 1987b), he considered buckling as one more component, present only in the out-of-bite areas, to be added to the elastic and the plastic strain rate decomposition. An equivalent strain rate was therefore added, which represents the local shortening of a segment due to buckling. Namely, the waviness re-duces the distance L~ between the ends of the segment, whereas the material, non-straight length remains L (to a small elastic strain). This can be seen as a decrease of the elastic stiffness, applied wherever the stress is more
nega-tive than a critical bucking stress, moreover taken very small (the approach is therefore valid for thin strips).
This approach is quite simple to implement, being a modification of the constitutive models, where negative stresses are eliminated by computing the = Ln(L~/L) strain which cancels them. On the other hand, this way of doing deals with buckling on a material point basis, whereas it is in fact possible only on a certain area, of the order of the wavelength of the eigen-displacement.
Two coupled rolling / buckling models
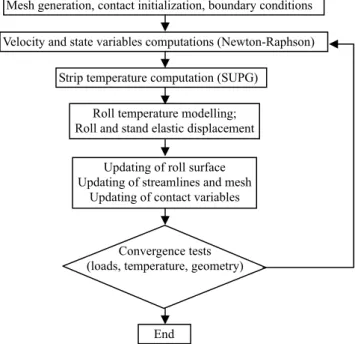
Based on ideas presented above, the present paper intro-duces two algorithms coupling buckling and rolling mod-els, which will be compared in the next sections. The roll-ing model is Lam3/Tec3, a strip / roll stack deformation model described in Hacquin et al. (1995, 1998); its general flow chart is given in Fig. 2. This implicit software uses a
steady state formulation based on streamline integration.
The roll stack deformation model is based on advanced beam theory, Boussinesq solution of a half-space under general loading, and Hertz contact mechanics.
The first buckling model is inspired from Counhaye (2000), and has been implemented in Lam3/Tec3, forming a strongly coupled model of rolling with buckling, called later L3T3-C.
The second one is the Asymptotic Numerical Method (ANM) described above in the non-coupled context; here, it is coupled in a staggered scheme with Lam3/Tec3, giv-ing L3T3-ANM.
Figure 2. General algorithm of Lam3/Tec3 FEM strip
rolling model.
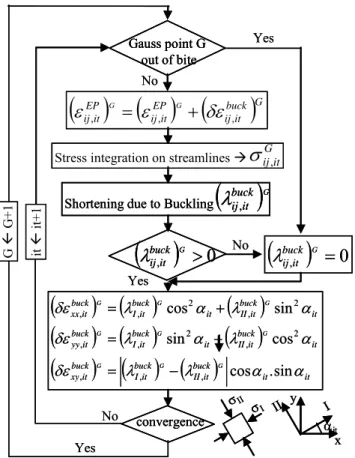
Integrating buckling at the material behaviour level.
This coupling has been detailed in Abdelkhalek et al. (2010a). Here, only the flowchart is recalled, Fig. 3. Stresses are tested everywhere outside the bite. If a com-pressive in-plane stress is found on an element (averaged over the thickness), the eigen-directions of stress are
de-Mesh generation, contact initialization, boundary conditions Velocity and state variables computations (Newton-Raphson)
Strip temperature computation (SUPG) Roll temperature modelling; Roll and stand elastic displacement
Updating of roll surface Updating of streamlines and mesh
Updating of contact variables
Convergence tests (loads, temperature, geometry)
termined, the computation of the’s is activated, the (elas-tic) strain increment is corrected from the “buckling short-ening”, and sent back to the next Newton-Raphson itera-tion for the stress increment determinaitera-tion. This analysis gives both the local shortening due to buckling, indicating wave formation, and the eigen-directions, giving the orien-tation of the waves (centre or edge waves, longitudinal waves or “towel effect”, see Fig. 1, or even transverse waves (herringbone, quarterbuckles…). Nothing is found on wavelength or amplitude; simply, the amount of short-ening tells about the severity of the defect, qualitatively.
Figure 3. Flow-chart of the constitutive model solution
in the coupled rolling / buckling model Lam3/Tec3-Counhaye or L3T3-C.
Coupling 3D FEM and Asymptotic Numerical Method shell FEM. Here, the principle is very different.
A full Lam3/Tec3 simulation is run, until all iteration loops come to a converged solution. Then, the post-bite stress field is interpolated on the shell element mesh of the ANM buckling model. Note that:
The whole stress field (xx, yy, xy) may be transferred;
furthermore, it may be transferred starting at the very edge of the bite, whereas all previous models used only the stabilized stress field, hundreds of mm after bite exit. It is quite important to involve this very complex bite vicinity area, where very strong stress gradients exist, the impact of which has to be tested.
As very large gradients are present on the edge of the strip, a very precise interpolation scheme has to be used. Here, a Moving Least Squares method has been devel-oped, with optimization of the shell mesh density and of
the extension of the weight functions associated with shell Gauss points (Abdelkhalek, 2010b).
After this transfer step, a buckling and post-buckling analysis is performed by the ANM; this in particular changes the stress state in the post-bite part of the system, including the exit line of the bite (which is the upstream edge of the shell mesh). This is considered as a novel boundary condition on the 3D FEM computation of strip and roll deformation. Its mesh is truncated at bite exit, and the abovementioned modified stresses are applied. Lam3/Tec3 is run again in this new configuration, giving a slightly modified strip and roll deformation and stress pattern. Before going back to shell buckling, a new stress field must be computed for the post-bite area: this is done using another Lam3/Tec3 simulation, on a complete mesh this time, but using only the last deformed roll stack. This puts an end to the corresponding iteration of the staggered scheme, and the whole procedure is repeated until conver-gence. In fact, coupling happens to be weak, convergence is always reached at the third global iteration at most.
This is a somewhat complex scheme, introducing possi-ble information loss during transfers. The advantage is that the buckling model is highly powerful and reliable.
Results
The two schemes will now be compared on a typical rolling pass on thin steel strip, described in Table 1, a case with large roll deformation (especially roll flattening). A 6200-node hexahedral mesh has been used after optimiza-tion; it is strongly refined at bite inlet and exit, and also near the edge where the element width is 1 mm.
Table 1. Characteristics of strip rolling pass investigated.
Strip width 855 mm
Entry strip thickness (strip crown) 0,355 mm (4.81 %)
Exit thickness 0,252 mm
Rolling speed 22 m/s
Front / back tension 100 MPa / 170 MPa Type of mill diameters WR / BUR Length WR/BUR 4-high 555mm / 1300mm 1400mm / 1295mm Work Roll / Back-Up Roll crown 0.0322 % / No crown Counterbending force / position 4.8 MN / y = 1010 mm Screwdown force application y = 1075 mm
Friction law : Coulomb 0, 03n
Strip material behaviour: Young’s modulus, Poisson’s cœfficient, Strain hardening (MPa)
E = 210 GPa,: = 0,3
175 )) 9 . 8 exp( . 45 . 0 1 ( . 4 . 175 5 . 470 0 First, a short analysis is given of the results of the com-putation without buckling. Fig. 4 shows the longitudinal stress field xx(x,y) up to ≈50 mm from the edge; in the
rolling direction, the displayed area extends 40 mm be-fore and after the bite. The latter is marked by a very com-pressive stress; the minimum – 1300 MPa is found 5 mm from the edge. This profile is characteristic of the edge-drop defect, i.e. the transition between the deformed and non-deformed zones of the roll.
convergence Gauss point G out of bite
buck
G it ij EP it ij EP it ij G G , , ,
Stress integration on streamlines
ij ,Git Shortening due to Buckling
buckij ,it G
,
0
G buck it ij
,
0
G buck it ij
No Yes
it it buck it II buck it I buck it xy it buck it II it buck it I buck it yy it buck it II it buck it I buck it xx G G G G G G G G G sin . cos cos sin sin cos , , , 2 , 2 , , 2 , 2 , , No it it+ 1 Yes x y I II it I II G G+ 1 No Yes convergence convergence Gauss point G out of bite Gauss point G out of bite
buck
G it ij EP it ij EP it ij G G , , ,
Stress integration on streamlines
ij ,Git Stress integration on streamlines
ij ,Git Shortening due to Buckling
buckij ,it G Shortening due to Buckling
buckij ,it G
,
0
G buck it ij
,
0
G buck it ij
,
0
G buck it ij
No Yes
it it buck it II buck it I buck it xy it buck it II it buck it I buck it yy it buck it II it buck it I buck it xx G G G G G G G G G sin . cos cos sin sin cos , , , 2 , 2 , , 2 , 2 , , No it it+ 1 Yes x y I II it x y I II it I II I II G G+ 1 No YesFigure 4. xx(x,y) stress field resulting from Lam3/Tec3-
standard (without buckling model).
Figure 5. Stress map with buckling modelled by L3/T3-C.
The local reduction results from the incoming strip crown and the deformed roll profile. It is maximal on the
edge, which is therefore the most elongated area in the bite. The stress near the edge (4-5 mm in the y-direction) is mostly compressive in the bite; it briefly turns tensile by the end of the contact, then becomes strongly compressive and falls down to -770 MPa, maintained all down the line after the bite, as shown by Fig. 6 below, case “Lam3/Tec3 standard”. Fig. 6 pictures stress profiles xx(y) nearly 1m
after the bite, where a stress-meter roll is located. The average of this stress distribution is 100 MPa, the strip tension stress. The distribution is obviously in complete disagreement with the experimental profile.
Impact of buckling on post-bite stress map xx(x,y).
Now, the buckling models are introduced for comparison. Fig. 5 shows a stress map equivalent to Fig. 4, but with L3T3-C; the areas displayed and the colour scale are almost the same. The stress xx
shows a large difference only in the out-of-bite areas. Except in a 20 mm long x 5 mm wide zone just after bite exit, the compres-sive stress on the edge has disappeared. It has been relaxed by local buckling, to be displayed in a later section.
Impact of buckling on remote stress profile xx(y). The remote xx profiles are completely transformed (Fig.
6), homogenized in a rather similar way by both coupled
models. Small differences appear however:
- Near the edge, L3T3-ANM gives a slightly tensile stress, where L3T3-C gives -50 MPa on a very narrow, 3 mm width. As the measurement does not extend to this area, there is no definitive argument in favour of one model or the other.
- In the centre, L3T3-C gives a slightly better agreement with experiments. This may look anecdotic, but the buckling mode of such thin strips proves to be very sen-sitive to this ≈10 MPa difference. Here, the strong cou-pling of L3T3-C may be the reason for its better agree-ment.
It is interesting to compare these profiles with a non-coupled chaining of Lam3/Tec3 with the ANM method (transfer of Lam3/Tec3 stress map to the ANM shell model and buckling + post-buckling computation, without feed-back to the rolling model). The relaxed profile is quite different, and farther from the experiment. Therefore, even if the buckling-induced relaxation does not change the in-bite fields, the absence of coupling results in inexact stress profiles – and potentially wrong buckling mode.
Impact of buckling on velocity field. Fig. 7 plots the
vx(y) velocity profile on the exit line (which is in fact curved due to roll deformation). It shows that due to the larger reduction near the edge, the exit material velocity is slightly larger (1%) near the edge. Farther away from the bite, a rigid-body movement has to be retrieved. This velocity profile evolution, with the edge being slowed down while the centre is accelerated, is another visualiza-tion of the compression of the edges which leads to buck-ling.
The application of the buckling algorithms, strongly coupled or staggered, tends to flatten this profile except in the extreme vicinity (1 mm) of the edge. This is what :
Stress xx(x,y) (MPa)
x y edge edge Ca. 50 mm C a . 80 mm
Bite
:Stress xx(x,y) (MPa)
x y edge edge Ca. 50 mm C a . 80 mm
Bite
Stress xx(x,y) (MPa)
x y edg e Ca. 50 mm Ca. 80 m m Bi te
Stress xx(x,y) (MPa)
x y edg e Ca. 50 mm Ca. 80 m m Bi te
makes the simple chaining of rolling and buckling models different from coupled approaches.
Figure 6. Remote stress profiles at the position of the
stress-meter roll, comparing experiments with Lam3/Tec3 standard (without buckling model), L3T3-C and L3/T3-ANM, and the non coupled Lam3/Tec3 + ANM chaining. An important result is that these changes in both the stress pattern after the bite and the velocity profile on the exit line have no significant influence on the strain and stress pattern inside the bite, and as a consequence, on the roll deformation. This conclusion is not absolutely gen-eral: for a small deformation pass, some impact on in-bite stress and velocity has been detected, after the neutral point; however, until now, the impact on roll deformation has been found insignificant in all cases (Abdelkhalek, 2010b).
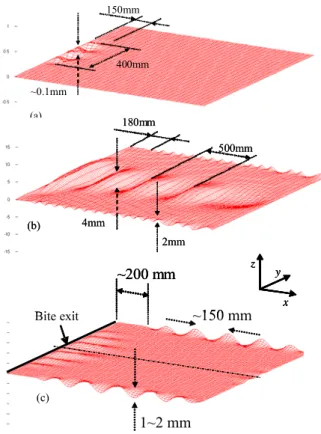
On-line and tension-relaxed shape defects. There
re-mains to examine the flatness defects predictions. Fig. 8 gives the predictions of L3T3-ANM. Under tension, only longitudinal (steady state) waves are present near the cen-treline. They are not flatness defects, but a “towel effect”, not entrained with the strip. The edges are “clean”.
On the contrary, defects appear when strip tension is cancelled, both a centre wave (wavelength 500 mm,
am-plitude 4 mm) and a wavy edge (wavelength 150 mm, amplitude 2 mm). Interestingly, the centre wave appears almost immediately after bite exit, whereas the edge wave starts only 180 mm after bite exit. This question of the onset of the defects is not essential in practice, but quite important for future validation of the models.
Figure 7. Vx velocity component just at the exit of the
bite, and at the position of the stress-meter roll. Compari-son of Lam3/Tec3 (without buckling model), L3/T3-C and L3/T3-ANM.
In Fig. 8c, the non-coupled, chained rolling + buckling model has been used for comparison. It shows the same edge wave; however, the centre wave does not appear.
Figure 8. Strip shape computed by L3/T3-ANM.
Com-putation has been done on half the width and symmetrized for better visualization. (a) On-line (under strip tension); (b) relaxed. (c) Non-coupled computation, tension relaxed.
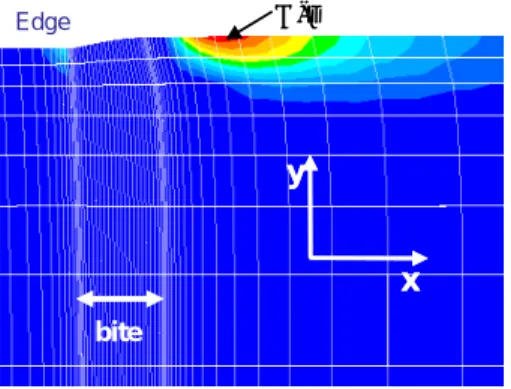
L3T3-C (Fig. 9) can predict shape defects only under tension. Here, a wavy edge is predicted (non-zero I).
Some longitudinal waves at bite exit (“towel effect”) are detected also by the non-zero II (not shown here), but
these are not flatness defects properly speaking.
150mm ~0.1mm 400mm (a) 150mm ~0.1mm 400mm (a) 2mm 4mm 180mm 500mm (b) 2mm 4mm 180mm 500mm (b) 2mm 4mm 180mm 500mm (b) -400 -200 0 200 400 -800 -600 -400 -200 0 200 xx (M P a ) y (mm) Mesures expérimentales Lam3/Tec3 Standard Lam3/Tec3-Counhaye Experiments L3T3-standard L3T3-C -400 -200 0 200 400 -800 -600 -400 -200 0 200 xx (M P a ) y (mm) Mesures expérimentales Lam3/Tec3 Standard Lam3/Tec3-Counhaye -400 -200 0 200 400 -800 -600 -400 -200 0 200 xx (M P a ) y (mm) Mesures expérimentales Lam3/Tec3 Standard Lam3/Tec3-Counhaye Experiments L3T3-standard L3T3-C -400 -200 0 200 400 -800 -600 -400 -200 0 200 Mesures expérimentales Lam3/Tec3 standard Lam3/Tec3-MAN : couplé y (mm)
xx (M P a ) Experiments L3T3-standard L3T3-ANM coupled -400 -200 0 200 400 -800 -600 -400 -200 0 200 Mesures expérimentales Lam3/Tec3 standard Lam3/Tec3-MAN : couplé y (mm)
xx (M P a ) -400 -200 0 200 400 -800 -600 -400 -200 0 200 Mesures expérimentales Lam3/Tec3 standard Lam3/Tec3-MAN : couplé y (mm)
xx (M P a ) Experiments L3T3-standard L3T3-ANM coupled -400 -200 0 200 400 -800 -600 -400 -200 0 200 Mesures expérimentales Lam3/Tec3 Standard Lam3/Tec3-MAN : découplé y (mm) xx (M P a ) Experiments L3T3-standard L3T3-ANM uncoupled -400 -200 0 200 400 -800 -600 -400 -200 0 200 Mesures expérimentales Lam3/Tec3 Standard Lam3/Tec3-MAN : découplé y (mm) xx (M P a ) Experiments L3T3-standard L3T3-ANM uncoupled x y z 1~2 mm ~150 mm ~200 mm Bite exit (c) x y z 1~2 mm ~150 mm ~200 mm Bite exit x y z x y z 1~2 mm ~150 mm ~200 mm Bite exit (c) 21500 21550 21600 21650 21700 21750 21800 21850 21900 0 50 100 150 200 250 300 350 400 450 y (mm) V x ( mm/s ) L3T3 - bite exit L3T3 - interstand L3T3-C - bite exit L3T3-C - interstand L3T3-ANM - bite exit L3-T3-ANM - interstandFigure 9. Strip shape computation in L3/T3-C, I = shortening
along x; maximum (red) is 1.5 10-3, minimum (deep blue) is 0.
Only the vicinity of the edge is shown. White lines are the mesh; the bite, marked by a refined meshing, is 9 mm long.
Discussion
Some differences arise between the two coupled models. Un-fortunately, only a very qualitative observation on the mill is available from Counhaye (2000), from which this rolling pass has been taken. He states that short-wavelength, small-width waves were present (under tension). This tends to support the fully coupled model against the staggered one, although more powerful in terms of buckling modelling. Also, it can be seen in
Fig. 6 that subtracting the strip tension stress (100 MPa) leaves
the L3T3-C profile positive in the centre, whereas the profile by L3T3-ANM goes negative. This explains the occurrence of the centre wave, not mentioned from observation on the mill. Small as this difference may seem, it is probably significant for practical results. As for the chained model, its convex stress profile in Fig.
6 leads to a positive stress in the centre after tension cancelling,
hence the absence of centre wave.
Conclusion
The comparison of the two coupled models (and a non-coupled version Lam3/Tec3 ANM as well) shows that a strong coupling of the two models is necessary. In some cases (very low reduction), some changes in the in-bite fields has been found, without impact however on the roll deformation. But the exit velocity field is always subtly modified; this is suggested to be a major driving force for the stress changes in the immediate post-bite zone, and to influence in all cases the strip buckling mode.
Different limitations should be overcome in the future: - Strong coupling is necessary, as well as a good buckling
and post-buckling description. A better solution would be e.g. to couple Lam3/Tec3 and the ANM model by a powerful hybridization method such as Arlequin (Ben Dhia and Rateau, 2005).
- Some very short and narrow waves may be buckling in the plastic state, which suggests to use an ANM version adapted to the non-linear constitutive model.
Finally, for a complete assessment of the models pre-sented here and the present conclusions, it would be nec-essary to compare not only stress profiles (far from the bite), but also wave shapes (in particular just at bite exit, where they form). The present authors and colleagues are presently doing such an experimental effort.
Acknowledgement
The authors are indebted to ArcelorMittal for financial support of this work and permission to publish it.
References
Abdelkhalek, S., Zahrouni, H., Potier-Ferry, M., Montmi-tonnet, P., Legrand, N., Buessler, P., 2009. Modélisa-tion numérique du flambage des plaques minces et ap-plication au laminage. In: Proc. (CD-ROM) CFM 2009, August 24-28, Marseille, France, 6 p. (in French).
Abdelkhalek, S., Montmitonnet, P., Potier-Ferry, M., Za-hrouni, H., Legrand, N., Buessler, P., 2010a. Strip flat-ness modelling including buckling phenomena during thin strip cold rolling. Ironm. Steelm. 37, p. 290-297. Abdelkhalek, S., 2010b. Un exemple de flambage sous
contraintes internes : étude des défauts de planéité en laminage à froid des tôles minces, Ph.D. dissertation, Ecole des Mines de Paris (in French).
Ben Dhia, H., Rateau, G., 2005. The Arlequin method as a flexible engineering design tool. Int. J. Num. Meth. Engg 62 (11), p. 1442-1462.
Boutyour, E.H., Zahrouni, H., Potier-Ferry, M., Boudi, M. 2004. Bifurcation points and bifurcated branches by an Asymptotic Numerical Method and Padé approxi-mants. Int. J. Num. Meth. Engg, 60, p. 1987-2012. Bush, A., Nicholls, R., Tunstall, J., 2001. Stress levels for
elastic buckling of rolled strip and plate, Ironm. Steel-m. 28, p. 481-484.
Counhaye, C., 2000. Modélisation et contrôle industriel de la géométrie des aciers laminés à froid, PhD Dissertation, University of Liège (in French).
Fisher, F.D., Rammerstorfer, F.G., Friedl, N., 2003. Re-sidual stress-induced centre wave buckling of rolled strip metal. ASME J. Appl. Mech. 70, p. 84-90.
Hacquin, A., Montmitonnet, P., Guillerault, J.-P., 1995. Coupling of roll and strip deformation in 3D simula-tion of hot rolling. In: Proc. NUMIFORM 95, June 18-21, Ithaca, NY, USA, p. 921-927.
Hacquin, A., Montmitonnet, P., Guillerault, J.-P., 1998. A 3D semi-analytical model of rolling stand deformation with finite element validation. Eur. J. Mech. - A : So-lids 17 (1), p. 79-106.
Roddeman, D.G., Drukker, J., Oomens, C.W.J., Janssen, J.D., 1987a,b. The Wrinkling of Thin Membranes, Part I- Theory. ASME J. Appl. Mech. 54, p. 884-887. Part II- Numerical Analysis. ASME J. Appl. Mech. 54, p. 888-892.
Timoshenko, S., Woinovsky-Krieger, S., 1940. Theory of plates and shells, McGraw-Hill Book Co., New York. Yukawa, N., Ishikawa, T., Tozawa, Y., 1986. Numerical
analysis of the shape of rolled strip. In: Proc. NUMI-FORM Conference, August 25-29, Gothenburg, Swe-den, p. 249-254.
Zahrouni, H., Cochelin, B., Potier-Ferry, M., 1999. Com-puting finite rotations of shells by an Asymptotic-Numerical Method, Comp. Meth. Appl. Mech. Engg 175 (1-2), p. 71-85. x y bite Edge Max x y x y bite Edge Max