Université de Sherbrooke
DÉTECTION, QUANTIFICATION ET IDENTIFICATION DU
CAMPYLOBACTER DANS L'EAU ENVIRONNEMENTALE DE L'ESTRIE
par
KAREN ST-PIERRE
Département de microbiologie et infectiologie
Mémoire présenté à la Faculté de médecine et des sciences de la santé en vue de l'obtention du grade de
maître ès sciences (M.Sc.) en microbiologie
20 Mars 2009
Évaluateurs :
Sophie Michaud, département de microbiologie et infectiologie Eric Frost, département de microbiologie et infectiologie Louis-Charles Portier, département de microbiologie et infectiologie Carole Beaulieu, département de biologie, Université de Sherbrooke
l+I
NOTICE:
Library and Archives Canada
Published Heritage Branch
395 Wellington Street Ottawa ON K1A ON4 Canada
The author has granted a
non-exclusive license allowing Library and Archives Canada to reproduce, publish, archive, preserve, conserve, communicate to the public by
telecommunication or on the Internet, loan, distribute and sell theses worldwide, for commercial or non-commercial purposes, in microform, paper, electronic and/or any other formats.
The author retains copyright ownership and moral rights in this thesis. Neither the thesis nor substantial extracts from it may be printed or otherwise reproduced without the author's permission.
ln compliance with the Canadian Privacy Act some supporting forms may have been removed from this thesis.
While these forms may be included in the document page count, their removal does net represent any loss of content from the thesis.
.
....
Canada
Bibliothèque et Archives Canada Direction du Patrimoine de l'édition 395, rue Wellington Ottawa ON K1A ON4 CanadaAVIS:
Your file Votre référence ISBN: 978-0-494-53428-1 Our file Notre référence ISBN: 978-0-494-53428-1
L'auteur a accordé une licence non exclusive permettant à la Bibliothèque et Archives Canada de reproduire, publier, archiver, sauvegarder, conserver, transmettre au public par télécommunication ou par l'Internet, prêter, distribuer et vendre des thèses partout dans le monde, à des fins commerciales ou autres, sur support microforme, papier, électronique et/ou autres formats.
L'auteur conserve la propriété du droit d'auteur et des droits moraux qui protège cette thèse. Ni la thèse ni des extraits substantiels de celle-ci ne doivent être imprimés ou autrement
reproduits sans son autorisation.
Conformément à la loi canadienne sur la protection de la vie privée, quelques
formulaires secondaires ont été enlevés de cette thèse.
Bien que ces formulaires aient inclus dans la pagination, il n'y aura aucun contenu manquant.
« Fais de ta vie un rêve et d'un rêve, une réalité »
Antoine de Saint-Exupéry
«L'expérience est le nom que l'on donne à la somme de nos erreurs»
Antoine de Saint-Exupéry
«La plus grande gloire n'est pas de ne jamais tomber, mais de se relever à chaque chute»
Confucius
À mes parents, pour leurs encouragements et leur dévouement. À Alexandre, pour son amour et son inspiration.
LISTE DES ILLUSTRATIONS Liste des tableaux
Liste des figures
LISTE DES SIGLES, ABRÉVIATIONS ET SYMBOLES RÉSUMÉ
INTRODUCTION Le Campylobacter
La campylobactériose humaine Les facteurs de risques
L'eau comme facteur de risque Les outils de prévention utilisés Le projet
CHAPITRE 1
Avant-propos de l'article Résumé de l'article
« Thermotolerant coliforms are not a good surrogate for Campylobacter in environmental water »
« Abstract »
«
Introduction»
« Materials and methods »
«
Results»
VI VI VIII XII XIV 17 17 18 20 20 21 23 26 26 27 29 30 31 3340
IV« Discussion
»
« Acknowledgments »
«
References»
CHAPITRE2
Approche moléculaire pour l'identification de 5 espèces de Campylobacter par PCR hippurate, PCR 16S et
PCR-57 62 63 71 RFLP 71 Introduction 71 Matériels et méthodes 81 Résultats 90 Discussion et conclusion 104 Perspectives 111 CHAPITRE 3 113
Développement d'une PCR en temps réel semi-quantitative pour Campylobacter jejuni, Campylobacter coli et Campylobacter lari dans l'eau
Introduction Matériels et méthodes Résultats Discussion et conclusion Perspectives CONCLUSION REMERCIEMENTS RÉFÉRENCES 113 113 125 139 153 161 164 168 171 V
Liste des tableaux
Table 1 : Comparison of culture and 16S rDNA PCR for detecting Campylobacter spp. in 2000-ml, 500-ml and 10-ml water samples.
Table 2 : Observed frequency of combinations of positive water subsamples among the 2481 water samples tested for Campylobacter spp. and the mean and 95% confidence limits of MPN/L calculated using the 1 x 2000 ml, 1 x 500 ml and 3 x 10 ml volumes.
Table 3 : Seasonal variation in presence and most probable number (MPN) of Campylobacter spp. at all sampling sites.
Tableau 4 : Caractéristiques phénotypiques générales et quelques divergences phénotypiques possibles pour l'identification à l'espèce des 5 principales espèces de Campylobacter d'intérêt médical et ce, avec l'utilisation des 6 tests biochimiques de routine.
42
44
48
73
Tableau 5: Identification à l'espèce des 5 souches de Campylobacter en fonction des tests biochimiques, de la PCR hippurate, de la PCR 16S et de la PCR-RFLP.
Tableau 6: Détails de l'identification à l'espèce des 1157 isolats et 5 souches de Campylobacter analysés seulement en fonction des 14 profils de digestion obtenus par PCR-RFLP.
Tableau 7: Évaluation de la différence du logarithme10 du nombre de cellules moyen de C. jejuni obtenu après 10, 15 ou 20 h d'enrichissement dans le bouillon Preston, selon que l 'inoculum initial théorique soit de 100 bactéries ou de 1000 bactéries et ce, pour chaque condition de stress testée.
Tableau 8 : Temps de génération issus de la courbe de croissance de cellules de l'isolat de C. jejuni ayant préalablement subis différents stress.
Tableau 9: Spécificité et reproductibilité de la RT-PCR obtenues après 3 essais.
Tableau 10 : Comparaison de la quantification du Campylobacter obtenue par la méthode MPN, la qRT-PCR et l'extraction d'ADN directe sur membrane filtrante.
95 101 143 144 146 151 VIT
Figure 1 : Geographic locations of the 32 sampling sites among the 7 counties of the Eastern Townships, Québec, Canada.
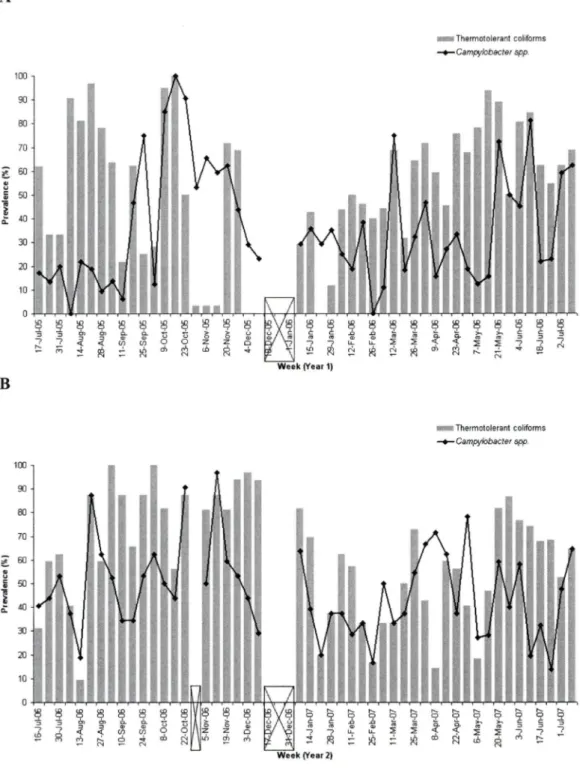
Figure 2 : Prevalence of Campylobacter spp. and thermotolerant coliforms per week, for the first year of the study (July 17, 2005 to July 09, 2006) and for the second year (July 16, 2006 to July 08, 2007).
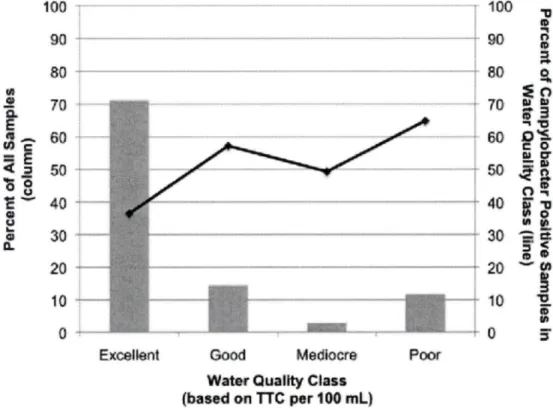
Figure 3 : Percent of total samples in each water quality class (as defined by thermotolerant coliform (TTC) count level) and percent of samples in each water quality class positive for Campylobacter spp.
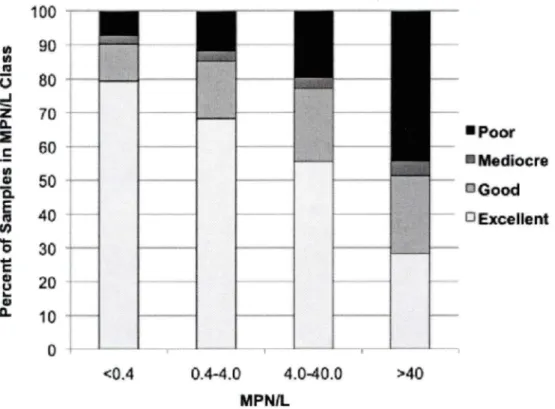
Figure 4 : Proportion of samples in each thermotolerant coliform count level according to the Campylobacter spp. count category.
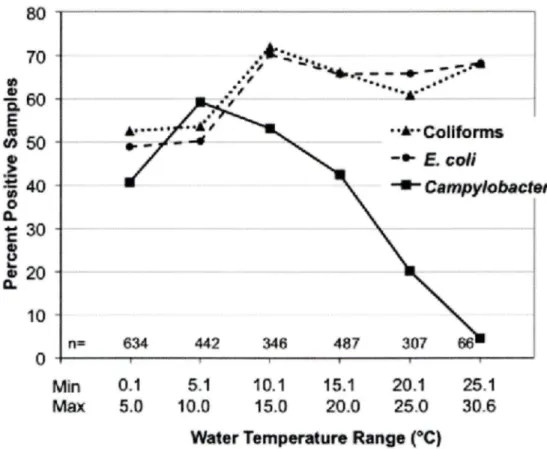
Figure 5 : Distribution of positive site samples for Campylobacter spp., thermotolerant coliforms (TTC) and E.
coli at various levels of water temperature.
34 46 50 52 54 VIII
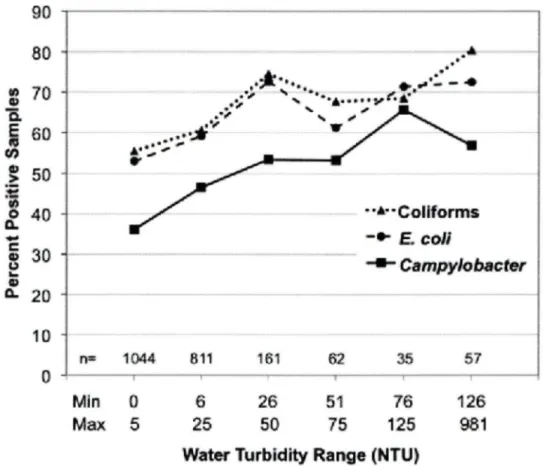
Figure 6: Distribution of positive site samples for Campylobacter spp., thermotolerant coliforms (TTC) and E. coli at various levels of water turbidity.
Figure 7: Deux tests biochimiques de routine dont l'interprétation subjective, faite par une personne non-initiée ou peu attentive, peut fausser l'identification à l'espèce du Campylobacter.
Figure 8 : Visualisation des 14 profils de digestion de la PCR-RFLP sur gel d'agarose à 3%.
Figure 9 : Association des isolats de Campylobacter donnant un résultat positif à la PCR hippurate avec un profil de digestion par PCR-RFLP.
Figure 10: Association des isolats de Campylobacter donnant un résultat négatif à la PCR hippurate avec un profil de digestion par PCR-RFLP.
Figure 11 : Algorithme décisionnel proposé pour
l'identification à l'espèce des isolats de Campylobacter en fonction de l'approche moléculaire (PCR hippurate, PCR 16S et PCR-RFLP). 56 77
92
97 99 105 IXconvertir un Ct en nombre de copies d'un fragment d' ADN cible.
Figure 13: Répartition d'une série de 12 tubes coniques selon les différentes conditions de stress initiales crées en variant la température et la durée d'incubation dans les 6 bouteilles d'eau et ce, avant d'ensemencer les bouillons d'enrichissement avec 100 ou 1000 bactéries provenant de ces bouteilles.
Figure 14 : Emplacement des amorces OTI 559 et 18-1 décrites par PERELLE et al., 2004 par rapport aux nouvelles amorces 16SCampF et 16SCampR construites pour la qRT-PCR précédée d'un enrichissement sur le gène de la sous-unité ribosomale 16S de C.jejuni, C. coli et C. lari.
Figure 15: Schéma d'analyses des dilutions d'un site de prélèvement d'eau environnementale pour la quantification par qRT-PCR précédée d'un enrichissement et par la méthode MPN.
Figure 16: Courbes de croissance moyennes d'un C. jejuni enrichies pendant 50 h. 118 127 132 137 141 X
Figure 17 : Courbe standard externe, créée à l'aide de la souche C. jejuni ATCC 33560, pour la quantification par
qRT-PCR précédée d'un enrichissement. 148
x g : Force en g
a : Niveau de signification alpha
P : Proportion des échantillons qui donnent un résultat aussi défavorable à l'hypothèse nulle.
p : Rho de Spearman
ADN : Acide désoxyribonucléique ADN db : ADN double brin
AFLP :
«
Amplified fragment length polymorphism »ARNr 16S: Acide ribonucléique de la sous-unité ribosomale 16S ATCC :
«
American type culture collection »BSA : « Bovine serum albumin » CFU : « Colony forming unit »
CLSI : « Clinical and laboratory standards institute »
Ct : Cycle seuil dans la réaction de PCR en temps réel DAPI : 4',6' di-amidino-2-phényl indole
dNTP: Combinaison des quatre désoxyribonucléotides (dATP, dTTP, dGTP, dCTP) FISH : « Fluorescence in situ hybridization »
FRET : « Fluorescence resonance energy transfer » GIS : « Geographic information system »
GITC: Guanidine isothiocyanate IDso :
«
Median infectious dose »LSPQ : Laboratoire de santé publique du Québec MLST : « Multilocus sequence typing »
MPN : « Most probable number »
MRC : Municipalité régionale de compté
MUG : « Nutrient agar » supplémentée avec du 4 méthylumbelliféryl-glucuronide NASC : « Nalidixic acid-susceptible campylobacters
»
NCBI : «National center for biotechnology information
»
NTU : « Nephelometric turbidity unit
»
ONPG : Ortho-nitro-phényl-galactopyranoside pb : Paire de bases
PCR : « Polymerase chain reaction »
PCR 16S : PCR basée sur la détection du gène de la sous-unité ribosomale 16S PCR 23S: PCR basée sur la détection du gène de la sous-unité ribosomale 23S PCR hippurate : PCR basée sur la détection du gène hipO
PCR-RFLP : PCR combinée à un RFLP PFGE : « Pulsed-field gel electrophoresis »
qRT-PCR : « Semi-quantitative real-time polymerase chain reaction
»
rDNA : « recombinant deoxyribonucleic acid
»
RFLP : « Restriction fragment length polymorphism » rpm : « Revolutions per minute »
RT-PCR: « Real-time polymerase chain reaction »
TSA : « Tryptone Soy agar
»
supplémentée avec 5% de sang de mouton TTC : « Thermotolerant coliforms »U : Unité enzymatique
Université de Sherbrooke
DÉTECTION, QUANTIFICATION ET IDENTIFICATION DU CAMPYLOBACTER DANS L'EAU ENVIRONNEMENTALE DE L'ESTRIE
par KAREN ST-PIERRE
Département de microbiologie et infectiologie
Mémoire présenté à la Faculté de médecine et des sciences de la santé en vue de l'obtention du grade de
maître ès sciences (M.Sc.) en microbiologie 20 Mars 2009
Évaluateurs : Sophie Michaud, département de microbiologie et infectiologie ; Eric Frost, département de microbiologie et infectiologie ; Louis-Charles Fortier, département de microbiologie et infectiologie ; Carole Beaulieu, département de
biologie, Université de Sherbrooke
Le Campylobacter est le plus important agent d'entérites bactériennes dans les pays industrialisés et en voie de développement. Des études récentes suggèrent que l'eau non-traitée est une source sous-estimée d'infections sporadiques chez l'humain. Dans le cadre du volet environnemental du projet CampyloGIS, mon projet principal consistait en l'étude de la prévalence et de la quantité du Campylobacter retrouvé dans les eaux environnementales de !'Estrie. Trente-deux sites d'échantillonnage d'eau ont été sélectionnés dans les 7 MRC de ! 'Estrie pour être échantillonnés
hebdomadairement du 17 juillet 2005 au 08 juillet 2007. Globalement, 1071/2481 (43%), 1481/2471 (60%) et 1463/2471 (59%) échantillons d'eau étaient respectivement positifs pour Campylobacter spp., les coliformes thermotolérants et E. coli. Il y avait une faible corrélation entre la prévalence hebdomadaire du Campylobacter spp. et des coliformes thermotolérants (rho de Spearman = 0,27 ; P = 0,008) et entre la quantité de ces deux microorganismes (tau-b de Kendall = 0,233 ; P < 0,0001). Également, plus de 150 échantillons d'eau de puits privés situés en Estrie ont été gracieusement analysés au cours de ce projet. Cinq échantillons d'eau de puits de surface sur 53 étaient positifs pour C. jejuni et seulement deux d'entre eux étaient aussi positifs pour les coliformes thermotolérants. Ces résultats suggèrent que les indicateurs de pollution fécale, comme les coliformes thermotolérants, ne sont pas suffisants pour correctement évaluer la présence et/ou la quantité du Campylobacter dans l'eau environnementale.
Mon deuxième projet consistait en le développement d'une approche moléculaire d'identification à l'espèce de C.jejuni, C. coli, C. lari, C. upsaliensis et C. fetus basée sur la PCR hippurate, la PCR 16S et la PCR-RFLP. Présentement,
l'approche moléculaire permettrait d'éviter la mauvaise identification de 526/1950 isolats (27%) préalablement mal identifiés par les tests biochimiques seuls. Jusqu'à présent, l'approche moléculaire ne permettrait toutefois pas d'identifier correctement à l'espèce 35/1950 isolats (1,8%) de Campylobacter. Cette approche moléculaire a permis de confirmer la nécessité d'utiliser plus d'une technique afin de s'assurer de l'identification à l'espèce adéquate du Campylobacter.
Campylobacter détecté dans les eaux environnementales de !'Estrie, ont porté à se questionner sur ! 'utilité de développer une méthode efficace de détection et de quantification du Campylobacter dans l'eau. De cette réflexion et des difficultés d'exécution qu'entraîne l'utilisation de la méthode MPN comme outil quantitatif, est né mon troisième projet, soit un protocole de RT-PCR semi-quantitative précédée d'un enrichissement pour la quantification de C. jejuni, C. coli et C. lari dans l'eau. Ce projet a permis de constater qu'un enrichissement de 16 h permettait d'augmenter, par un facteur relativement constant, le nombre de C. jejuni contenu dans un échantillon d'eau naturellement contaminé et ce, peut importe la condition cellulaire initiale occasionnée par un séjour dans l'eau. De plus, les résultats obtenus via le protocole de RT-PCR semi-quantitative sont comparables à la quantification obtenue via la méthode MPN (rho de Spearman
=
0,84 ; P < 0,001 ), ce qui permet de croire que ce protocole simple pourrait éventuellement être un choix envisageable pour la détection et la quantification du Campylobacter dans l'eau.Mots clés
INTRODUCTION
Le Campylobacter
Le Campylobacter est une bactérie incurvée en forme de virgule ou de « S », non sporulante, de 0,2 à 0,8 µm de diamètre sur 0,5 à 5,0 µm de longueur, qui est «Gram négative »et qui est mobile grâce à un ou deux flagelle(s) polaire(s) nu(s). Les bactéries du genre Campylobacter sont également dites, fastidieuses, car la presque totalité des 18 espèces répertoriées ont un système respiratoire micro-aérophile, c'est-à-dire qu'elles ont la capacité de croître et de se multiplier seulement à une pression réduite en dioxygène (02), soit généralement entre 3 et 15% d'02. Aussi, le genre Campylobacter nécessite généralement une température optimale de croissance qui se situe soit à 37°C ou à 42°C, tout dépendamment si l'espèce est thermophile ou non, est incapable de métaboliser les sucres (ni par oxydation, ni par fermentation), la gélatine et l'urée et est positive au test d'oxydase (NACHAMKIN et BLASER, 2000) (MACFADDIN, 2000) (GARRITY et al., 2005). Le genre Campylobacter a été proposé pour la première fois en 1963 par Sebald et Véron pour désigner une bactérie préalablement connue sous le nom de Vibrio fetus (NACHAMKIN et BLASER, 2000) (GARRITY et al., 2005). Récemment, une 19e espèce de Campylobacter, Campylobacter canadensis, a été découverte dans la flore fécale de grues blanches d'Amérique (Grus americana) maintenues en captivité au zoo de Calgary au Canada (INGLIS et al., 2007).
Le Campylobacter est le plus important agent d'entérites (diarrhées) bactériennes dans les pays industrialisés et en voie de développement, étant la cause d'environ 5 à 14% de toutes les entérites dans le monde (entérites virales et bactériennes confondues) (EYLES et al., 2003) (WORLD HEALTH ORGANIZATION, 2008). Au Canada et au Québec, l'envergure connue de cette infection est telle qu'en 2004, elle était reconnue comme la 4e maladie à déclaration obligatoire en importance (AGENCE DE SANTÉ PUBLIQUE DU CANADA, 2008). En 1998, il a été estimé que le coût annuel engendré par les cas confirmés d'infection à Campylobacter au Canada se chiffrait entre 200 millions et 1,2 milliards de dollars (CONSEIL NATIONAL DE RECHERCHE CANADA, 2008).
Les symptômes d'une infection à Campylobacter apparaissent en général de 2 à 3 jours après la contamination, mais ! 'incubation peut aller de 1 à 7 jours. La campylobactériose humaine est principalement caractérisée par des diarrhées, éventuellement sanglantes dans plusieurs cas, des crampes abdominales, de la fièvre, une perte d'appétit, des nausées et plus rarement des vomissements. Les symptômes peuvent perdurer pendant un minimum de 2 à 5 jours avant, de façon générale, de se résorber par eux-mêmes. Des complications post-infectieuses au Campylobacter ont déjà été observées comme l'arthrite réactive, l'urticaire et l'érythème noueux. La plus importante complication post-infectieuse au Campylobacter connue est le syndrome de Guillain-Barré, qui est une neuropathie auto-immune inflammatoire du système nerveux périphérique. Ce syndrome, qui survient dans 1 cas d'infection par le Campylobacter jejuni sur 1000, entraîne une paralysie ascendante qui peut, dans
certain cas, demeurer permanente. (KOENRAAD et al., 1997) (MOORE et al., 2005) (GALANIS, 2007) (HUMPHREY et al., 2007)
Malgré l'importance de la campylobactériose humaine au niveau de la santé publique, la pathogénèse de la maladie est encore méconnue. En effet, l'identification des facteurs impliqués dans l'invasion et la thermotolérance, le rôle de l'inflammation et de gènes spécifiques dans la virulence, ainsi que la production de toxines par C. jejuni sont des exemples de mécanismes pathogéniques qui restent encore à être
éclaircis et ce, autant pour C. jejuni que pour les autres espèces de Campylobacter. Cependant, quelques importants facteurs de virulence ont déjà été identifiés chez C. jejuni, comme le flagelle, qui est un élément capital permettant des événements
crutiaux pour l'infection chez l'humain comme la chimiotaxie, la mobilité, l'adhésion et l'invasion des cellules épithéliales intestinales (V AN VLIET et KETLEY, 2001) (POLY et GUERRY, 2008). D'autres adhésines, comme les protéines PEBl et CadF, joueraient également un rôle dans l'adhésion et l'invasion de C. jejuni (KONKEL et
al., 1997) (PEI et al., 1998). Aussi, malgré le fait que quelques groupes de recherche ont rapporté la présence d'autres toxines, seul le gène cdt codant pour la toxine de dilatation cytolytique a été isolé chez C. jejuni. Des mécanismes de glycolysation et de résistance aux stress (superoxyde dismutase, catalase et alkyle hydroperoxide réductase) ont également été identifiés chez C. jejuni. Un concensus affirme que pour amélirorer les connaissances sur la pathogénèse du Campylobacter, il faudra, entre autres, un modèle animal fiable et reproductible capable de développer des symptômes analogues à ceux rencontrés chez des patients atteints de la campylobactérisoe humaine (V AN VLIET et KETLEY, 2001) (BOLLA et GARNOTEL, 2008) (POLY et GUERRY, 2008).
Au Canada, entre autres, la majorité des cas humains de campylobactériose est sporadique et de source imprécise (THOMAS et al., 2006). De plus, dans les régions tempérées, la majorité des infections à Campylobacter est principalement répertoriée au cours des mois d'été (ALTEKRUSE et al., 1999) (THOMAS et al., 1999) (NYLEN et al., 2002) (MICHAUD et al., 2004) (HUMPHREY et al., 2007) et les groupes d'âges les plus à risque sont les enfants de moins de 5 ans et les jeunes adultes (MICHAUD et al., 2004) (AGENCE DE SANTÉ PUBLIQUE DU CANADA, 2008) (WORLD HEALTH ORGANIZATION, 2008). La notion générale, dans la littérature, soutient que c'est la consommation et/ou la manipulation inadéquate de poulet cru ou insuffisamment cuit qui est la principale source d'infection sporadique de l'humain par le Campylobacter (KOENRAAD et al., 1997) (MOORE et al., 2005) et 80 à 90% des infections sont dues à C. jejuni, principale espèce de Campylobacter retrouvée chez la volaille (NACHAMKIN et BLASER, 2000) (STEINHAUSEROVA et al., 2001) (MURRAY et al., 2003). Il existe toutefois d'autres sources importantes de contamination, notamment via le contact avec des animaux domestiques (chatons et chiots plus particulièrement) ou de ferme, la consommation de lait cru et/ou de produits à base de lait cru et la consommation d'eau non traitée ou incorrectement traitée (KOENRAAD et al., 1997).
L'eau comme facteur de risque
L'importance réelle de l'eau comme source de cas sporadiques de campylobactériose chez l'humain est de plus en plus considérée, mais est encore méconnue. Cependant, l'importance de l'eau comme source épidémique de
campylobactérioses humaines est bien documentée. Un exemple canadien pour illustrer ce lien est l'épidémie survenue dans la ville de Walkerton, Ontario en 2000 (CLARK et al., 2003). C'est plus de 2300 personnes qui ont été majoritairement infectées par le Campylobacter, mais également par Escherichia coli 0157 :H7, à cause d'un puits principal d'approvisionnement en eau potable de la ville qui avait été mal inspecté et qui avait été contaminé par des fèces de bovins lessivées par une pluie abondante. Également, une étude rétrospective a révélé que 16% (241150) des épidémies en lien avec l'eau de consommation répertoriées entre 1974 et 2001 au Canada avaient impliqué le Campylobacter (SCHUSTER et al., 2005). De ces faits, il est important de savoir que la consommation d'eau contenant même une faible quantité de Campylobacter peut être un facteur de risque pour la santé humaine (TEUNIS et al., 2005). En fait, des études réalisées sur des volontaires ont démontré que le Campylobacter affichait une courbe dose-réponse classique de forme sigmoïde avec une faible dose infectieuse entre 500 et 800 bactéries pour avoir 50% de chances (ID50) de contracter l'infection (BLACK et al., 1988) (BLACK et al., 1992) (ROBINSON, 1981). Aussi, la probabilité de contracter la campylobactériose humaine après l'ingestion d'une seule et unique bactérie est estimée à environ 1 chance sur 150 (ROSE et GERBA, 1991).
Les outils de prévention utilisés
Aucun protocole de détection et de quantification du Campylobacter dans l'eau n'a été standardisé et n'est donc utilisé pour vérifier la qualité de l'eau de consommation et de l'eau à des fins récréatives. En fait, les laboratoires accrédités d'analyses d'eau se basent principalement sur la présence ou non des coliformes thermotolérants (coliformes fécaux), notamment Escherichia coli, pour suspecter ou
coliformes thermotolérants comme organismes indicateurs, réside dans le fait qu'ils font partie intégrante de la microflore intestinale normale de plusieurs animaux à sang chaud, que leur survie dans l'environnement est généralement équivalente à celle d'autres bactéries pathogènes pour l'humain et que leur densité est généralement proportionnelle au degré de pollution produite par les matières fécales (CENTRE D'EXPERTISE EN ANALYSE ENVIRONNEMENTALE DU QUÉBEC, 2005) (GROUPE SCIENTIFIQUE SUR L'EAU, 2003). La validité de cette méthode d'évaluation du degré de pollution fécale, utilisée depuis plus d'une centaine d'années, est cependant remise en question. En fait, des études, effectuées dans plusieurs pays, n'ont pas démontré d'association entre la présence du Campylobacter et la présence des coliformes thermotolérants dans l'eau (CARTER et al., 1987) (ROLLER, 1988) (KOENRAAD et al., 1997) (SA VILL et al., 2001 ). De plus, la menace du Campylobacter dans l'eau est bien réelle (JONES, 2001) (CLARK et al. 2003) (HORMAN et al. 2004) (SCHUSTER et al., 2005) (ABULEREESH et al., 2006) (TILL et al., 2008). En fait, le Campylobacter fait partie intégrante de la microflore naturelle du tractus gastro-intestinal de plusieurs mammifères et oiseaux autant domestiques (ex. : chats, chiens, hamsters syriens, etc.), d'élevage (ex. : bovins, ovins, porcins, caprins, etc.), que sauvages (goélands, canards, rongeurs, pigeons, etc.) (NACHAMKIN et al., 1992) (NACHAMKIN et BLASER, 2000). Cette grande présence du Campylobacter au sein de cette multitude d'espèces animales permet ainsi de faciliter la dissémination de la bactérie un peu partout dans l'environnement, notamment dans l'eau, via les fèces de ces animaux. Par conséquent, il apparaît nécessaire de réévaluer les critères et protocoles pour la surveillance de la qualité de l'eau de consommation et de l'eau à des fins récréatives.
Le projet
De tous ces faits et connaissances, et entre autres des travaux de MICHAUD et al., 2004, est né le projet CampyloGIS. Ce projet a pour but d'identifier les principaux mécanismes et sources de transmission du Campylobacter entre les animaux, l'environnement, les aliments et l'humain en Estrie, afin de mieux comprendre le risque infectieux et de proposer l'implantation de mesures efficaces de prévention et de contrôle. Pour ce faire, le projet vise à utiliser une approche de typage moléculaire par « Multilocus sequence typing » (MLST) et un système d'information géographique (GIS). Le GIS rassemblerait des données environnementales et sanitaires pour évaluer le risque de contamination de ! 'humain par le Campylobacter selon la qualité de l'eau et ! 'utilisation des sols, par exemple. Le MLST, quant à lui, est la méthode de référence pour l'analyse des populations génétiques du Campylobacter (MAIDEN et al., 1998) et cette méthode est la seule qui a permis de relier certains clones de Campylobacter à des niches écologiques spécifiques (DINGLE et al., 2001a) (DINGLE et al., 2001b) (DINGLE et al., 2001c). Le MLST permettrait donc de valider les liens épidémiologiques identifiés par le GIS, afin d'identifier de nouvelles relations causales entre une source potentielle de Campylobacter et un cas humain, par exemple. Ainsi, avec ces outils, il sera entre autres possible de vérifier certaines hypothèses comme, par exemple, si les sources de contamination de ! 'humain par le Campylobacter en milieu urbain diffèrent de celles en milieu semi-rural ou rural et si, en milieu semi-rural ou rural, l'eau de surface serait en majeure partie contaminée par des fèces de ruminants. Le projet CampyloGIS s'est déroulé entièrement dans la région de ! 'Estrie qui comprend 7 municipalités régionales de compté (MRC) (Asbestos, Coaticook, Granit, Haut St-François, Memphrémagog,
totale de !'Estrie utilisait, comme source d'eau de consommation, de l'eau de surface, notamment de l'eau provenant de rivières ou de lacs (DÉVELOPPEMENT DURABLE, ENVIRONNEMENT ET PARCS QUÉBEC, 2008).
Dans le cadre du volet « environnement » du projet CampyloGIS, mon rôle, en tant qu'étudiante à la maîtrise, a été de déterminer, dans un premier temps, qu'elles étaient la prévalence et la quantité hebdomadaire du Campylobacter dans les rivières et les ruisseaux de ! 'Estrie durant la période du 17 juillet 2005 au 08 juillet 2007 (104 semaines). Avec ces données, je devais déterminer si la prévalence et la quantité du Campylobacter dans les eaux environnementales de ! 'Estrie variaient dans le temps (années, saisons, semaines, etc.) et selon certaines variables physico-chimiques (température et turbidité) et s'il existait une association entre la présence et/ou la quantité du Campylobacter et la présence et/ou la quantité des coliformes thermotolérants et d'E. coli. Cette partie de mon travail, qui correspond à environ 60% de ma maîtrise, est présentée sous forme d'article scientifique ayant comme titre: « Thermotolerant coliforms are not a good surrogate for Campylobacter in environmental water ». Dans un deuxième temps, je devais développer une approche moléculaire d'identification pour 5 espèces de Campylobacter (C. jejuni, C. coli, C. lari, C. upsaliensis et C. fetus), afin de pouvoir, entre autres, valider l'identification à l'espèce des isolats de Campylobacter récoltés lors de l'étude de prévalence et de quantification du Campylobacter dans les eaux environnementales de l 'Estrie. Cette deuxième partie de mon travail, qui correspond à environ 25% de ma maîtrise, est présentée à la suite de mon article scientifique sous le titre : Approche moléculaire pour ! 'identification de 5 espèces de Campylobacter par PCR hippurate, PCR 16S et
PCR-RFLP. Finalement, le troisième et dernier objectif de ma maîtrise consistait en le développement d'une réaction de polymérase en chaîne (PCR) semi-quantitative en temps réel pour 3 espèces thermophiles de Campylobacter ( C. jejuni, C. coli et C. lari) qui ont notamment été observées dans l'eau. Cette partie de mon travail visait le développement d'une méthode de détection et de quantification du Campylobacter dans l'eau plus simple et plus rapide que la méthode du «Most probable number » (MPN) utilisée dans l'étude de prévalence et de quantification du Campylobacter dans les eaux environnementales de l 'Estrie et qui pourrait plus aisément être standardisée. Cette dernière partie de mon travail, qui correspond à environ 15% de maîtrise, est présentée sous le titre : Développement d'une PCR en temps réel semi-quantitative pour Campylobacter jejuni, Campylobacter coli et Campylobacter lari dans l'eau.
AVANT-PROPOS DE L'ARTICLE
« Thermotolerant coliforms are not a good surrogate for Campylobacter in environmental water»
Auteurs
Karen St-Pierre, Simon Lévesque, Eric Frost, Nathalie Carrier, Robert D. Arbeit et Sophie Michaud.
État de l'article à ce jour
Soumis pour publication à la revue « Applied and Environmental Microbiology »le 26 Février 2009.
Le formulaire «Autorisation d'intégration d'un article écrit en collaboration à un mémoire ou une thèse » a été signé par chaque co-auteure ou co-auteur conformément à la «Directive relative au dépôt des essais, des mémoires et des thèses» de l'Université de Sherbrooke.
RÉSUMÉ DE L'ARTICLE
Cette étude avait pour but de déterminer l'importance de faire la détection et la quantification du Campylobacter dans l'eau environnementale à des fins préventives. La prévalence et la quantité du Campylobacter, des coliformes thermotolérants et du E. coli ont été déterminées via l'analyse de 2481 échantillons d'eau environnementale pour le Campylobacter et de 2471 échantillons d'eau environnementale pour les deux autres microorganismes. Les échantillons d'eau ont été prélevés hebdomadairement, du 17 juillet 2005 au 08 juillet 2007, dans 13 rivières et 12 ruisseaux tous situés en Estrie, Québec, Canada. Globalement, 1071/2481 (43%), 1481/2471 (60%) et 1463/2471 (59%) échantillons d'eau étaient respectivement positifs pour le Campylobacter, les coliformes thermotolérants et E. coli. Une faible corrélation entre la distribution hebdomadaire du Campylobacter et des coliformes thermotolérants (Rho de Spearman = 0,27; P = 0,008) et entre la quantité de ces deux microorganismes (Tau-b de Kendall= 0,233 ; P < 0,0001) a été observée. Aussi, plus de 150 échantillons d'eau de puits privés (artésien et de surface) situés en Estrie ont été gracieusement analysés au cours de ce projet. Cinq (10%) échantillons d'eau de puits de surface sur 53 étaient positifs pour C. jejuni et seulement deux d'entre eux étaient aussi positifs pour les coliformes thermotolérants. Ces résultats suggèrent que les indicateurs de pollution fécale, comme les coliformes thermotolérants, ne sont pas suffisant pour correctement évaluer la présence et/ou la quantité du Campylobacter dans l'eau environnementale. L'investigation du rôle de l'eau environnementale
techniques de surveillance plus spécifiques.
Contribution de l'étudiante
J'ai contribué activement et pleinement à l'élaboration et à l'obtention de tous les résultats décrits dans l'article. J'ai également écrit entièrement la première ébauche du manuscrit.
THERMOTOLERANT COLIFORMS ARE NOT A GOOD SURROGATE FOR CAMPYLOBACTER IN ENVIRONMENTAL WATER
Karen St-Pierre1, Simon Lévesque1, Eric Frost1, Nathalie Carrier2 Robert D. Arbeit3, Sophie Michaud 1•
1. Department of Microbiology and lnfectious Diseases, Faculté de Médecine de l'Université de Sherbrooke, Québec, Canada.
2. Centre de Recherche Clinique Étienne Le-Bel du Centre Hospitalier Universitaire de Sherbrooke, Sherbrooke, Québec, Canada.
3. Infectious Diseases Section, Tufts University School of Medicine, Boston, MA, USA.
Corresponding author
Sophie Michaud, M.D., M.P.H., C.S.P.Q., F.R.C.P.C. Department ofMicrobiology and lnfectious Diseases Faculté de Médecine de l'Université de Sherbrooke 3001, 12e avenue Nord
Sherbrooke, Québec JIH 5N4
Phone: (819) 564-5321, Fax: (819) 564-5392 E-mail: [email protected]
The Canadian Institutes of Health Research (CIHR), the Natural Sciences and Engineering Research Council of Canada (NSERC) and the Centre de Recherche Clinique Étienne Le-Bel.
Running head
Campylobacter in environmental water.
Keywords
Campylobacter, thermotolerant coliforms, Escherichia coli, environmental water, detection, quantification, MPN.
Word count (text) 4,829 words.
Abstract
This study aimed to assess the importance of quantitatively detecting Campylobacter in environmental surface water. The prevalence and the quantity of Campylobacter, thermotolerant coliforms and E. coli were determined in 2,4 71 samples collected weekly, over a two-year period, from 13 rivers and 12 streams in the Eastern Townships, Québec, Canada. Overall, 1,071 (43%), 1,481 (60%) and 1,463 (59%) samples were positive for Campylobacter spp., thermotolerant coliforms, and E.
coli respectively. There were weak correlations between the weekly distributions of Campylobacter spp. and thermotolerant coliforms (Spearman's rho coefficient= 0.27; P = 0.008), and between the quantitative levels of the two classes of organisms
(Kendall tau-b correlation coefficient= 0.233; P < 0.0001). A convenience sample of well water in the Eastern Townships was also tested. Five (10%) of 53 samples from private surface wells were positive for C. jejuni, of which only two were positive for thermotolerant coliforms. These findings suggest that microbial monitoring of raw water by using only fecal indicator organisms is not sufficient for assessing the occurrence or the Ioad of thermophilic Campylobacter. Insights into the role of environmental water as a source for sporadic Campylobacter infection will require genus-specific monitoring techniques.
Word count 195 words.
Introduction
Campylobacter jejuni is the Ieading reported cause of bacterial gastroenteritis in developed countries (2). In 2002 in Canada, it was the leading notifiable enteric food- and waterborne disease, with 11,543 reported cases (http://dsol-smed.phac-aspc.gc.ca). In Quebec province alone, nearly 3,000 cases of diarrheal illness are attributed annually to Campylobacter enteritis, more than the combined total caused by Salmonella and Shigella species, E. coli 0157:H7 and Yersinia enterocolitica (15). THOMAS et al., 2006 recently concluded that even these numbers appear to represent a substantial underestimate of the public health burden of this enteric pathogen and that for every case of Campylobacter infection reported in Canada each year, there are an additional 23 to 49 cases (50).
milk, untreated surface water, and poultry have all been well-documented as sources of Campylobacter outbreaks (1, 8, 25, 26, 35, 39, 41, 44, 46, 52). Nevertheless, most clinical cases appear as isolated, sporadic infections for which the source is rarely identified ( 6). Identifying the sources and routes of transmission of campylobacteriosis is essential for developing effective, targeted preventive measures.
There is ample opportunity for Campylobacter to contaminate environmental water, including streams, rivers, and lakes. The genus colonizes a wide variety of hosts, from domestic animais to wild birds, and thus an extensive burden of organisms is excreted via animal fecal material (2, 8). Other potential sources include discharge from wastewater treatment plants.
Testing for indicator organisms (typically thermotolerant coliforms or E. coli) has generally been considered to reflect adequately the presence of enteric pathogens; consequently, Campylobacters have not been explicitly monitored in water. However, several recent reports suggest a poor correlation between the levels of Campylobacter and marker organisms in water supplies (23). The overall objective of the CampyloGIS project is to identify the main sources of Campylobacter infections and the mechanisms of transmission between animais, the environment, food and humans. We present here the first component of the project, focusing on the relationship between the presence and the quantity of Campylobacter spp. compared with that of thermotolerant coliforms and E. coli in environmental and well waters.
Materials and methods
Environmental water sampling sites and sampling. The Eastern Townships comprise 88 municipalities, with an area totaling 10,187 km2 and a population of about 300,000 inhabitants. About half of the population lives in Sherbrooke, a small metropolitan area, with the remaining municipalities being either rural or semi-rural. Thirty-two sampling sites located on 13 rivers and 12 streams were selected among the 7 counties of the Eastern Townships (Figure 1), and sampled weekly from July 17, 2005 to July 08, 2007, except during holidays and during winter if sites were frozen.
The sampling sites were selected to include the most important rivers and streams representing various contamination sources and catchment areas in the Eastern Townships. Primary selection was made on a macro level by using map reconnaissance and on a micro level by evaluating the accessibility of the sites, and their proximity with cattle farms or gathering points for wild birds and animais. Exact sampling points were recorded by using a global positioning system satellite device (Garmin).
For each sampling site, - 3,000 ml of water were collected weekly from the nearshore areas or from a bridge passing over the site, using a horizontal alpha water sampler (Geneq) at a depth about 15 to 30 cm below the surface. The sample was divided into one 2,000-ml and two 500-ml sterile Nalgene bottles, transported on ice to the laboratory, held at 4°C and tested within 24 h.
Eastern Townships, Québec, Canada.
Physicochemical analyses. The temperature (0C) and the turbidity (NTU) were assessed with a portable multiparametric probe U-10 device (Horiba) while sampling at the sampling site.
Thermotolerant coliforms and E. coti analyses. For each sampling site, 100 ml of water were filtered using a sterile 0.45 µm membrane. The membrane was transferred onto a m-Fc agar plate (BD Diagnostics) and incubated at 44.5°C for 24 h. Tuen, colonies of each color were enumerated - blue colonies being counted as thermotolerant coliforms - , and one colony of each color on m-FC agar was subcultured on MacConkey agar (Oxoid) and incubated aerobically at 37°C for 24 h. Each lactose-positive isolate was plated on Tryptone Soy agar supplemented with 5% defibrinated sheep blood (TSA) (Oxoid) and incubated aerobically at 37°C for 24 h. Isolates giving positive results for catalase, indole spot, MUG and ONPG hydrolysis tests and a negative result for the oxydase test, were counted as presumptive E. coli
(13).
Analyses of Campylobacter spp. For each sampling site, 5 volumes of water (1 x 2,000 ml, 1 x 500 ml and 3 x 10 ml) were analysed and quantified using the Most Probable Number (MPN) method (10, 21, 40). The 1x2,000 ml and 1 x 500 ml water volumes were filtered through a sterile 0.45 µm membrane (Millipore Corporation) (CORRY et al., 1995). If needed, turbid samples were initially filtered with a sterile 1.5 µm membrane (VWR International) and this membrane was incubated with the corresponding 0.45 µm membrane fil ter in 25 ml of Preston broth (Oxoid). The 3 x 10 ml water volumes were incubated without filtration in 15 ml on Preston broth l.5X. Ali broths were incubated at 3 7°C for 3 h, and then at 42°C for an additional 45 h in a
(Oxoid) and incubated at 42°C for 48 h under microaerobic conditions. In parallel, 1 ml of suspension was transferred to a 1.5 ml microcentrifuge tube and used to detect the presence of thermophilic Campylobacters by PCR (see DNA extraction). After 48 h, Karmali plates were examined and suspect colonies (round light grey colonies with/without spreading) were subcultured on TSA and incubated at 42°C for 24 h in a microaerobic atmosphere (29).
Presumptive Campylobacter spp. colonies were confirmed microscopically and each plate was given a positive or negative score. Due to the intense workload associated with testing 5 volumes of water for each site, only one presumptive Campylobacter spp. isolate per site was identified to the species-level by routine phenotypic methods (oxydase, catalase, indoxyl acetate, sodium hippurate hydrolysis in test tube, and susceptibility to nalidixic acid and cephalotin) (33) and by the molecular approaches described below. Bacterial isolates were stored at -80°C for further analyses. If the isolate was confirmed as Campylobacter spp., it was assumed that the other presumptive Campylobacter spp. isolates originating from the same site sample were also Campylobacter spp. If not, the site sample was excluded from the study because it was impossible to formally prove that the sample contained Campylobacter spp.
Control strains. Campylobacter jejuni ATCC 33560, Campylobacter coli ATCC 49941, Escherichia coli ATCC 25922, Klebsiella pneumoniae ATCC 13883 and Pseudomonas aeruginosa ATCC 9027 were used as control strains.
DNA extraction. Crude DNA was extracted by adding 25 µl ofNaOH 0.5 N to the pellet of a 1-ml suspension of Preston broth centrifuged at 13,000 rpm (~ 15,860 x
g) for 10 min, or one single colony of a presumptive Campylobacter spp. isolate. After 5 minutes at room temperature, 25 µl of Tris lM pH 8.0 and 450 µl (for extracts from a single colony) or 100 µl (for extracts from the pellet of enrichment broth) of sterile distilled water were added. DNA extracts were stored at -20°C. DNA was also extracted with the DNeasy Blood & Tissue kit (Qiagen) from isolates giving negative results with hipO gene PCR (see below), to make sure that these negative results were not due to an extraction problem.
16S rDNA PCR. DNA extracts of the Preston broth suspensions and of presumptive Campylobacter spp. isolates were tested for the presence of C. jejuni, C. coli or C. lari using the primers and PCR conditions described by LUBECK et al., 2003 (30), except that 1 µl (100 copies) of a 420 bp positive internal control (made in an analogous fashion to that described by FROST et al., 1995 (19)) was added to each PCR reaction mix (29).
Identification of C. jejuni using hipO gene PCR. DNA extracts of all presumptive Campylobacter spp. isolates were tested for the presence of the hipO gene using the primers and PCR conditions described by SLATER et OWEN, 1997 (43). Isolates in which the hippuricase gene could be detected by polymerase chain reaction were identified as C. jejuni.
Weil water sampling. During the study, we offered to test without charge the surface and/or groundwater well water of patients having been diagnosed with a
farms participating in another component of the CampyloGIS project) and of citizens presenting to Laboratoires d'analyses S. M. inc. Wells had to be located in the Eastern Townships and could be sampled only once during the study. One 2,000-ml sterile Nalgene bottle containing 20 ml of 1 % sterile sodium thiosulphate (Sigma-Aldrich) to neutralize chlorine was aseptically filled with well water, transported on ice to the laboratory, held at 4°C and tested within 24 h. The 2,000-ml sample was used for Campylobacter spp. and thermotolerant coliforms detection using the methods previously described. The MPN Campylobacter spp. quantification method was not applied to well samples, but thermotolerant coliforms were enumerated.
Statistica/ analyses. Most Probable Numbers (MPN) of organisms based on the culture results were generously calculated by Juan M. Gonzalez (21 ). Prevalence rates of Campylobacter spp, thermotolerant coliforms and E. coli were calculated for each microbe analyzed, and the annual mean of the weekly rates compared by year using the Chi-square two-tailed test. A Phi correlation coefficient with a two-tailed P value was calculated for cross-correlations between the presence of Campylobacter spp. and the presence of thermotolerant coliforms or E. coli (27). Since the same 32 sampling sites were tested each week and that the final number of samples per sampling site was variable, compliance with the independence assumption was uncertain. Therefore, a Phi correlation coefficient was calculated for each of the 32 sampling sites and an average of these 32 values was calculated to obtain a mean global Phi coefficient value.
The Chi square two-tailed test was used to compare the distributions of Campylobacter and of thermotolerant coliforms per season for each year. The Kendall tau-c statistic was used to examine the relationship between the presence of Campylobacter and the categorical levels of thermotolerant coliforms as defined by the Ministère du Développement durable, de !'Environnement et des Parcs du Québec (http://www.mddep.gouv.qc.ca/eau/recreative/qualite.htm). Their criteria for the microbiological evaluation of thermotolerant coliforms in recreational waters specify four levels of water quality- excellent, good, mediocre and poor - corresponding to 0-20, 21-100, 101-200 and > 200 CFU/100 ml; bathing and other direct contacts are forbidden with poor quality water. The Kendall tau-b statistic was used to examine the relationship between the levels of thermotolerant coliforms and those of Campylobacter, categorized as< 0.4, 0.4-4.0, 4.0-40.0 and> 40.0 MPN/L.
Arithmetic means and standard deviations were calculated for water temperature and turbidity. In addition, the Chi-square two-tailed test was used to assess relationship between the proportion of positive samples for Campylobacter spp., thermotolerant coliforms and E. coli with water temperature (in intervals of 5°C) and with turbidity (in intervals of 25 NTU). The sensitivity and specificity of the 16S PCR were calculated globally, as well as for the three volumes (2,000 ml, 500 ml and 10 ml) of water taken separately, using the culture results for Campylobacter spp. as reference; all Campylobacter spp. isolates were included in these analyses, even if isolates could not be identified to the species level using the methods described above. The culture and 16S PCR results were also compared using the kappa statistic and McNemar' s test. Data were analyzed with Statistix for Windows version 7 .1
Corporation), using a significance level of 5%.
Results
Environmental water analyses. From July 17, 2005 to July 08, 2007, 2,488 site samples were tested for Campylobacter spp., thermotolerant coliforms and E. coli. The total number of water samples tested per site varied from 62 to 93 (median = 78) as some sites (especially the smaller streams) were frozen more often than others. No sampling was done during 7 weeks (December 18, 2005 to January 08, 2006, October 29, 2006 to November 04, 2006 and December 17, 2006 to January 07, 2007), due to Christmas holidays and a scientific meeting. Seven site samples were excluded from the Campylobacter spp. analyses, either because it was not possible to formally prove that the samples contained Campylobacter spp., or due to technical errors. Ten additional site samples could not be analyzed for thermotolerant coliforms and E. coli due to technical errors. Therefore, 2,481 site samples were used for the analyses specifically related to Campylobacter spp., and 2,4 71 site samples were included in the analyses comparing Campylobacter spp. to thermotolerant coliforms and E. coli.
Overall, 1,071 (43%), 1,481 (60%) and 1,463 (59%) samples were found to be positive for Campylobacter spp., thermotolerant coliforms, and E. coli respectively. The presence of E. coli and thermotolerant coliforms were highly correlated with an agreement rate of 89.9% and a Phi coefficient of0.79 (P < 0.0001). Only 106 (4.7%) of the 2,471 samples were negative for thermotolerant coliforms but positive for E. coli; consequently, the comparative analyses emphasize the associations for Campylobacter and thermotolerant coliforms.
1
Among the Campylobacter spp.-positive samples, 874 (82%) were identified as C. jejuni, 11 (1 %) as C. coli, 58 (5%) as C. lari, and 128 (12%) isolates could not be identified to the species level using the methods described above; 29 of these isolates <lied before the DNA extraction was performed. Of note, 178 (21 %) of the isolates identified as C. jejuni by hipO gene PCR had a negative hippurate result when tested biochemically, and 73 (8%) gave a hipO gene PCR positive result only after DNA was extracted using the DNeasy Blood & Tissue kit (Qiagen).
The agreement between culture and 16S rDNA PCR for detecting Campylobacter spp. was very good (kappa statistic
=
0.88; P=
0.31 as determined by McNemar's test). The global sensitivity and specificity of the 16S PCR compared to culture were 89% and 98%, respectively (Table 1). The sensitivity of the 16S rDNA detection PCR is defined as the ability of the PCR method to detect the 16S rDNA gene of C. jejuni, C. coli and C. lari when C. jejuni, C. coli or C. lari was detected by the culture method, i.e. [(PCR +, culture+) +culture +]. Example for the 2,000-ml : 940 + (940 + 72) x 100=
93%. The specificity of the 16S rDNA detection PCR is defined as the ability of the PCR method to not detect the 16S rDNA gene of C. jejuni, C. coli and C. lari when C. jejuni, C. coli or C. lari was not detected by the culture method, i.e. [(PCR -, culture-)+ culture-]. Example for the 2,000-ml: 1393 + (1393 + 76) x 100=
95%. The highest sensitivity for the 16S PCR (93%) was observed for the 2,000-ml volume, followed by the 500-ml (89%) and the 10-ml (76%) volumes. The proportion of culture-negative, 16S PCR-positive results was also higher among the 2,000-ml samples (5%), compared to the 500-ml and 10-ml samples (1 %).spp. in 2,000-ml, 500-ml and 10-ml water samples.
Water Culhue + C1ùhue + Culhue - Cultme - Total Sensitivity Specificity
samples PCR + PCR- PCR+ PCR- (%) (%)
2000 ml• 940 7" 76 1393 2481 93 95
500 mlb 439 56 29 1957 2481 89 99
lOJlÙC 177 56 60 7150 7443d 76 99
Ali• 1556 184 165 10500 12405 89 98
aKappa statistic= 0.88; p= 0.74, as determined by McNemar's test. bKappa statistic = 0.89; p= 0.34, as determined by McNemar's test. cKappa statistic = 0.75; p= 0.71 , as determined by McNemar's test. dThree 10-ml subsamples of water were analyzed per site sample.
eAll subsamples combined: kappa statistic = 0.88; p= 0.31, as determined by McNemar's test.
Table 2 shows the frequency of the observed combinations of positive water volumes among the 2,481 environmental water site samples tested for Campylobacter spp., and the MPN calculated using the 1 x 2,000 ml, 1 x 500 ml and 3 x 1 O ml setup. The estimated quantity of Campylobacter spp. was between 0.4 to < 4.0 MPN/L in 25%, between 4.0 to < 40.0 MPN/L in 13%, and ~40.0 MPN/L in 5% of site samples,
respectively; 57% of site samples were negative for Campylobacter spp. (< 0.4 MPN/L).
The presence of Campylobacter spp. and thermotolerant coliforms were poorly correlated among 2,471 environmental water site samples. Of the 990 samples negative for thermotolerant coliforms 331 (33%) contained Campylobacter spp. Conversely, among the 1,481 samples positive for thermotolerant coliforms, 747 (50%) were negative for Campylobacter spp. The global analysis of the association between the presence of Campylobacter spp. and the presence of thermotolerant coliforms showed a Phi coefficient of 0.16 (P < 0.0001 ), consistent with a very weak association. When analyzing the data for each sampling site separately, the Phi coefficients varied between -0.30 and 0.49, with a mean ± standard deviation of 0.10 ± 0.11. The results were similar when analyzing the results for each year separately (data not shown).
the 2,481 water samples tested for Campylobacter spp. and the mean and 95% confidence limits of MPN/L calculated using the 1 x 2,000 ml, 1 x 500 ml and 3 x 10 ml volumes.
Combination of positives Frequency (O/o) Jv.lPN/L 95%CILL" 95%CIULb
0-0-0 1,410 (56.8%) < 0.4 1-0-0 550 (22.2%) 0.78 0.14 4.38 1-1-0 329 (13.3%) 5.75 0.13 259.16 1-1-1 64 (2.6%) 40.61 0 Infinity 0-1-0 45 (1.8%) 0.44 0.05 3.55 1-1-2 32 (1.3%) 110.02 0 Infin ity 1-1-3 17 (0.7%) 604.52 0 Infinity 1-0-[any positive] 20 (0.8%) 2.04 - 5.83 0.12 291.70 0-1-[any positive] 8 (0.3%) 0.89 - 1.80 0.17 8.43 0-0-[any positive) 6 (0.2%) 0.4-1.19 0.05 5.75
95% lower a and upper b confidence limits of the MPN/L values.
Figure 2 shows the prevalence rates of Campylobacter spp. and of thermotolerant coliforms in environmental water by week throughout the two years of the study. Campylobacter spp. was recovered in environmental water all year long, but the prevalence rates per week, and even from one year to the other, were quite variable: 3 7% of samples were positive for Campylobacter spp. during the first year of the study, compared to 49% during the second year (P < 0.0001). Similar variability was observed for thermotolerant coliforms, with 54% positive samples during the first year, compared to 66% during the second year (P < 0.0001).
However, there was only a weak correlation between the presence of Campylobacter spp. and thermotolerant coliforms by week of collection (Spearman'rho coefficient
=
0.27, P=
0.008). For example, in July-August 2005 as well as in April-May 2006, the prevalence rates ofthermotolerant coliforms were high, compared to low rates of Campylobacter spp. In contrast, from the end of October to mid-November 2005, rates of Campylobacter spp. were quite high, whereas rates of thermotolerant coliforms in water were very low. There were some weeks, such as in October 2005, where both classes of organisms were present at high levels; we speculate that these were periods of manure spreading associated with heavy rains, but this remains to be confirmed.- Thermotolerant coliforms -+-Ca"'F'f/Obacler spp. 100 90
1\
'
BO 1 •\
70rl j
~..
60r~!
u c 50..
;; li 40 et 301\
~ 0 .~:
'~
~ 1 ~n
1
~ nnn \ I 0M
~ ~ ~i i
~ ~ ~~
~~
~ ~ ~ ~ ~ ~ ~ ~~
~ 7 g ;; ;; ~ i i :ti
"' ~<
~ en z z0 ~
l.L l.L i ~ ~ ~ 7 ;;:; ~ :4 ci> <}, ~ ~ !il ~ !il ci> ,.:. "'"' 1' ---WOek (Ye•r 1) B - Thermotolerant coliforms -+-Campyiobacler spp. 100 90 BO ... 70
\
60 ~ ~..
...
u ~ l'i c 50n
~1
et 40...
~ ~ ~ 1 I ~ r~ '
.,.. 30i\
~...
20\
10n
~~
r\ I 0 ~ ~ ~ ~i
~ ~ ~~
M
~ ~ ~
... 1:i ~ ... ... ... ...~
~ g g ~ .!. ':!' ':!' ~ ~ ~~
<
~ en cil 0 7 ~ '.t l.L ~ i :t~
i i ;;; 1 ~ é ~ rD ~""
" ~ :4 :4 rD "' Week (Year 21 <}, ~FIGURE 2. Prevalence of Campylobacter spp. and thermotolerant coliforms per week, (A) for the first year of the study (July 17, 2005 to July 09, 2006) and (B) for the second year (July 16, 2006 to July 08, 2007). The 7 weeks during which no sampling was done are represented by the squares with X.
The seasonal variation in Campylobacter spp. MPN is depicted in Table 3. For both years of the study, the highest prevalence of Campylobacter spp. in environmental water (55.2% in year 1 and 57.8% in year 2) and the highest proportion of samples with > 40.0 MPN/L (8.9% in year 1 and 7.9% in year 2) were found during fall, compared to the three other seasons.
Campylobacter spp. at all sampling sites. Se as on Year 1 Summer Fall Winter Spring Year 2 Summer Fall Winter Spring n 351 417 130 392 383 341 11 0 347 Proportion of positive samples (%)a 21. 6 55.2 30.0 37.4 46.0 57.8 40.0 47.8 Proportion of samples with > 40.0 MPN/L (%)b 1.7 8.9 3.8 2.8 5.0 7.9 1.8 1.7
aTuere was a significant difference between the proportion of positive samples by season for year 1 (P < O. 0OO1) and for year 2 (P = O. OO 14), using Chi-square 2-tail test.
bThere was a significant difference between the proportion of samples with > 40.0 MPN of Campylobacter spp./L by season for year 1 (P < 0.001) and for year 2 (P = 0.001), using Chi-square 2-tail test.
The proportion of samples that yielded Campylobacter spp. was analyzed relative to the four levels of thermotolerant coliforms used to characterize water quality for recreational use (Figure 3). Over 70% of all samples were rated "excellent" water quality (0-20 thermotolerant coliforms per 100 ml) and only 12% were assessed as "poor" quality (> 200 thermotolerant coliforms per 1 OO ml). However, there was limited correlation between the water quality and the frequency of detecting Campylobacter (Kendall tau c = 0.196, se = 0.018; P < 0.0001). Over one-third of "excellent" quality samples were positive for Campylobacter, with rates exceeding 50% among samples classified as "good" and peaking at 65% among samples of "poor" quality.
90 80 Ill 0 70
a.
e
"
-rn c 60=
E<,a
50.... .
08
15-
Cl 40 ~30
CD Q.20
10 0Excellent GoO<:I Mediocre Water Quallty Class (based on
Trc
per 1 OO mL)10
0 3'
Poor
FIGURE 3. Percent of total samples in each water quality class (as defined by thermotolerant coliform (TTC) count level) and percent of samples in each water quality class positive for Campylobacter spp.
Samples were also assigned to four categories based on the estimated MPN/L of Campylobacter spp. Overall, 1,410 (56.8%) had < 0.4 MPN/L (lower limit of detection of the collection protocol); 629 (25.4%) had 0.4 to 4.0 MPN/L; 329 (13.3%), 4 to 40 MPN/L; and 113 (4.6%), > 40 MPN/L. Again, there was a limited association between the presence of increasing levels of Campylobacter and increasing levels of thermotolerant coliforms (Figure 4) (Kendall tau b = 0.233, se = 0.019; P < 0.0001).
For example, among samples with > 40.0 MPN/L of Campylobacter spp., 44.2% were of poor water quality based on thermotolerant coliforms counts, compared with 7.3% among samples with no detectable Campylobacter.
Il) 90 il)
"
<;)80
c!
z
70o..
~ 60c
Ill50
w"6.
i
40 Cl)0
...
30
r; CD 20 1.)...
G1 Q.10
0 ·--- --<0.4 0.4-4.04.040.0
MPNJL >40• 1Poor
• Mediocre Good OiExceHentFIGURE 4. Proportion of samples in each thermotolerant coliform count level according to the Campylobacter spp. count category.
Physicochemical parameters analyses. Water temperatures at the time of collection varied between 0.4 and 30.6°C (median = 1 l .0°C; mean = 11.6 ± 7 .6°C) and
consistent with the year round collection protocol, the distribution of temperatures was relatively even. Considered in intervals of 5°C, the water temperature was 0-5°C in 26% of evaluable samples (temperature was unavailable for 189 (7%) of samples due to technical problems), 5.1-10.0°C in 18%, 10.l-15.0°C in 14%, 15.l-20.0°C in 20%, 20.l-25.0°C in 12%, and >25°C in 3%. Figure 5 shows the frequency of samples at each temperature level positive for Campylobacter spp., thermotolerant coliforms and E. coli. Temperature had only a modest impact on recovery of coliforms, with ~50%
of samples under 10°C being positive, compared with 60-70% among warmer samples. In contrast, the frequency of samples positive for Campylobacter spp. was 40% for the coldest interval (0-5°C), peaked at 60% for samples 5-10°C, and then declined steadily with increasing temperature, with organisms recovered from only 5% of samples > 25°C (P < 0.0001, as determined by Chi-square). For each level of water temperature, the proportion of positive samples for Campy/obacter spp. was statistically different from that for thermotolerant coliforms and E. coli (P < 0.02).
10
MinMax
0.1
5.0
10.0
5.1
10.1
15.0
48715.1
20.0
··'1:>·Collforms-• E. coli
...,... Oampylobacter 30720.1
25.0
25. 1
30.6
Water Temperature ·Range
(~C)FIGURE 5. Distribution of positive site samples for Campylobacter spp., thermotolerant coliforms (TTC) and E. coli at various levels of water temperature. The "n=" indicate the total number of site sampi es at each level of water temperature.
The water turbidity varied from 0 to 981 NTU (median = 6 NTU; mean = 18 ± 51 NTU) among 2,164 evaluable samples; no data was available for 307 (12%) site samples due to technical problems. Most samples had low turbidity, with 0-5 NTU observed in 42%, 6-25 NTU in 33%, 26-50 NTU in 7%, 51-75 NTU in 3%, 76-125 NTU in 1 %, and > 125 NTU in 2%. Figure 6 shows the frequency of samples at each level of turbidity positive for Campylobacter spp., thermotolerant coliforms and E. coli. For each class of organisms, the frequency of positive samples increased modestly as turbidity increased from 0-5 NTU through 26-50 NTU; across this range, recovery of Campylobacter spp. was significantly less frequent than coliforms (P