Author Role:
Title, Monographic: PHYSITEL 1.0 : user's guide Translated Title:
Reprint Status: Edition:
Author, Subsidiary: Author Role:
Place of Publication: Québec Publisher Name: INRS-Eau Date of Publication: 1989
Original Publication Date: 31 août 1989 Volume Identification:
Extent of Work: v, 58
Packaging Method: pages Series Editor:
Series Editor Role:
Series Title: INRS-Eau, Rapport de recherche Series Volume ID: 280
Location/URL:
ISBN: 2-89146-277-7
Notes: Rapport annuel 1989-1990
Abstract: Rapport rédigé pour Canada Environment, Hydrology Division & Canada Center for Remote Sensing, Application Division
10.00$
Call Number: R000280
USER'S GUIDE by Jean-Pierre FORTIN Jean-Pierre VILLENEUVE Djilali BENMOUFFOK Martin MONTMINY Claude BLANCHETTE
Scientific Report INRS-Eau No 280
BY: Université du Québec Institut national de la recherche scientifique INRS-Eau 2800, rue Einstein Québec (Québec) G1X4N8 CANADA 31 août 1989
For: Hydrology Division Environment Canada Ottawa, Ontario K1AOE?
and
Application Division Canada Center for
Remote Sensing 154? Marivale Road Ottawa, Ontario K1A OY?
PHYSITEL 1.0
by
Jean-Pierre FORTIN Jean-Pierre VILLEN EUVE
Djilali BENMOUFFOK Martin MONTMINY Claude BLANCHETTE
31 août 1989
USER'S GUIDE
BY: Université du Québec Institut national de la recherche scientifique INRS-Eau 2800, rue Einstein Québec (Québec) G1X 4N8 CANADA
For: Hydrology Division Environment Canada Ottawa, Ontario K1AOE7
and
Application Division Canada Center for
Remote Sensing 1547 Marivale Road Ottawa, Ontario K1A0Y7
TABLE OF CONTENTS ... i
LIST OF FIGURES ... iii
PART 1 1.1 1.2 1.3 1.4 PART 2 2.1 2.2 2.2.1 2.2.2 2.2.2.1 2.2.2.2 2.2.3 2.2.4 2.3 2.3.1 2.3.1.1 2.3.1.2 2.3.1.2.1 2.3.1.2.2 2.3.1.2.3 2.3.1.2.4 2.3.1.2.4.1 2.3.1.2.4.2 2.3.1.2.5 2.3.1.2.5.1 2.3.1.2.5.2 2.3.1.2.6 2.3.1.2.7 2.3.2 2.3.2.1 GENERAL INFORMATION ... 2
Software main characteristics and hardware requirements ... 2
Introduction ... 3
Organization of the manual ... 4
Software availability and information ... 4
THE PHYSITEL PROGRAM (1.0) ... 6
General structure ... 6
Getting started ... 6
List of files on floppy disks ... 7
Installing PHYSITEL 1.0 ... 8
Installing PHYSITEL 1.0 using INSTALL.COM program ... 9
Installing PHYSITEL manually ... 10
Test data and structure of data files ... 10
Starting PHYSITEL 1.1 ... 13
Using PHYSITEL 1.0 ... 14
Sub-menu #1.0: régional data bases ... 14
Sub-menu #1.1: define new regional data base ... 15
Sub-menu #1.2: existing regional data base ... 16
Sub-menu #1.2.1: data base selection ... 17
Sub-menu #1.2.2: file content of selected regional data base ... 19
Sub-menu #1.2.3: header of selected regional data base ... 20
Sub-menu #1.2.4: data input ... 20
Sub-menu #1.2.4.1: land-use classes pixel by pixel from IMATEL ... 21
Sub-menu #1.2.4.2: input data from raster file ... 22
Sub-menu #1.2.5: change de X, Y coordinates ... 24
Sub-menu #1.2.5.1: degrees to UTM ... 25
Sub-menu #1.2.5.2: UTM to degrees ... 26
Sub-menu #1.2.6: file modification ... 27
Sub-menu #1.2.7: display ... 28
Sub-menu #2.0: watershed data bases ... 29
2.3.2.2.3 2.3.2.2.4 2.3.2.2.4.1 2.3.2.2.4.2 2.3.2.2.4.2.1 2.3.2.2.4.2.1.1 2.3.2.2.4.2.1.2 2.3.2.2.4.2.2 2.3.2.2.4.2.3 2.3.2.2.4.2.3.1 2.3.2.2.4.2.3.2 2.3.2.2.4.2.4 2.3.2.2.4.2.4.1 2.3.2.2.4.2.4.2 2.3.2.2.4.2.4.3 2.3.2.2.4.2.4.4 2.3.2.2.4.2.5 2.3.2.2.4.3 2.3.2.2.4.4 2.3.2.2.4.4.1 2.3.2.2.5 2.3.2.2.6 2.3.2.2.6.1
Sub-menu #2.2.3: file content of selected evatershed
data base ... 34
Sub-menu #2.2.4: add or edit files ... 35
Sub-menu #2.2.4.1: raster data integration ... 36
Sub-menu #2.2.4.2: watershed topography and mask from WDS files ... 37
Sub-menu #2.2.4.2.1: dem preprocessing ... 38
Sub-menu #2.2.4.2.1.1: filtering ... 39
Sub-menu #2.2.4.2.1.2: removal of local extreme values ... 40
Sub-menu #2.2.4.2.2: si ope determination ... 41
Sub-menu #2.2.4.2.3: aspect treatment ... 42
Sub-menu #2.2.4.2.3.1: aspect determination ... 43
Sub-menu #2.2.4.2.3.2: correction of aspect ... 44
Sub-menu #2.2.4.2.4: local pit processing ... 45
Sub-menu #2.2.4.2.4.1: localisation of local pits ... 46
Sub-menu #2.2.4.2.4.2: working data base ... 47
Sub-menu #2.2.4.2.4.3: fiat area outlets ... 48
Sub-menu #2.2.4.2.4.4: depression outlets ... 49
Sub-menu #2.2.4.2.5: drainage network determination ... 50
Sub-menu #2.2.4.3: river characteristics ... 51
Sub-menu #2.2.4.4: land-use integration for grid intervals ... 52
Sub-menu #2.2.4.4.1: paster data from IMATEL ... 53
Sub-menu #2.2.5: display files ... 54
Sub-menu #2.2.6: export file ... 55
Sub-menu #2.2.6.1: export to HYDROTEL ... 56
Figure 1.1 Figure 2.2 Figure 2.3 Figure 2.4 Figure 2.5 Figure 2.6 Figure 2.7 Figure 2.8 Figure 2.9 Figure 2.10 Figure 2.11 Figure 2.12 Figure 2.13 Figure 2.14 Figure 2.15 Figure 2.16 Figure 2.17 Figure 2.18 Figure 2.19
Integrated analysis of physical, remotely sensed and meteoralogical data for streamflow simulation and
forescasting by PHYSITEL, IMATELAND HYDROTEL ... 3
Geographie location of the test basin ... 11
Main-menu ... 14
Sub-menu #1.0: régional data bases ... 14
Sub-menu #1.1: define new regional data base ... 16
Sub-menu #1.2: existing regional data base ... 17
Sub-menu #1.2.1: data base selection ... 18
Sub-menu #1.2.2: file content of selected regional data base ... 19
. Sub-menu #1.2.3: header of selected regional data base ... 20
Sub-menu #1.2.4: data input ... 21
Sub-menu #1.2.4.1: land-use classes pixel by pixel from IMATEL ... 22
Sub-menu #1.2.4.2: input data fram raster file ... 23
Sub-menu #1.2.5: change de X, Y coordinates ... 24
Sub-menu #1.2.5.1: degrees to UTM ... 25
Sub-menu #1.2.5.2: UTM to degrees ... 26
Sub-menu #1.2.6: file modification ... 27
Sub-menu #1.2.7: display ... 28
Sub-menu #2.0: watershed data bases ... 29
Sub-menu #2.1: define new waterhed data base ... 29
Figure 2.22 Figure 2.23 Figure 2.24 Figure 2.25 Figure 2.26 Figure 2.27 Figure 2.28 Figure 2.29 Figure 2.30 Figure 2.31 Figure 3.32 Figure 3.33 Figure 2.34 Figure 2.35 Figure 2.36 Figure 2.37 Figure 2.38 Figure 2.39 Figure 2.40 Figure 2.41
Sub-menu #2.2.2: header of selection data base ... 33
Sub-menu #2.2.3: file content of selected evatershed data base ... 34
Sub-menu #2.2.4: add or edit files ... 35
Sub-menu #2.2.4.1: raster data integration ... 36
Sub-menu #2.2.4.2: watershed topography and mask from WDB files ... 37
Sub-menu #2.2.4.2.1: dem preprocessing ... 38
Sub-menu #2.2.4.2.1.1: filtering ... 39
Sub-menu #2.2.4.2.1.2: removal of local extreme values ... 40
Sub-menu #2.2.4.2.2: slope determination ... 41
Sub-menu #2.2.4.2.3: aspect treatment ... 42
Sub-menu #2.2.4.2.3.1: aspect determination ... 43
Sub-menu #2.2.4.2.3.2: correction of aspect ... 44
Sub-menu #2.2.4.2.4: local pit processing ... 45
Sub-menu #2.2.4.2.4.1: localisation of local pits ... 46
Sub-menu #2.2.4.2.4.2: working data base ... 47
Sub-menu #2.2.4.2.4.3: fiat area outlets ... 48
Sub-menu #2.2.4.2.4.4: depression outlets ... 49
Sub-menu #2.2.4.2.5: drainage network determination ... 50
Sub-menu #2.2.4.3: river characteristics ... 51
Sub-menu #2.2.4.4: land-use integration for grid intervals ... 52
Figure 2.44
Figure 2.45
Sub-menu #2.2.6: expert file ... 55
Sub-menu #2.2.6.1: expert te HYDROTEL ... 56
PART 1 GENERAL INFORMATION
1.1 Software main characteristics and hardware requirements
Name: PHYSITEL 1.0
Objective: Preparation of watershed data base for streamflow simulation by hydrotel
Programming language: "C", with use of GKS for display purposes
Type of microcomputer:
Memory requirements:
IBM compatibles with mathematical co-processor. A VGA board is suggested but not mandatory. Display drivers are furnished with the program for a number of display devices, but monochrome displays are not recommended.
640 k.
Written by: Martin Montminy and Djilali Benmouffok
1.2 Introduction
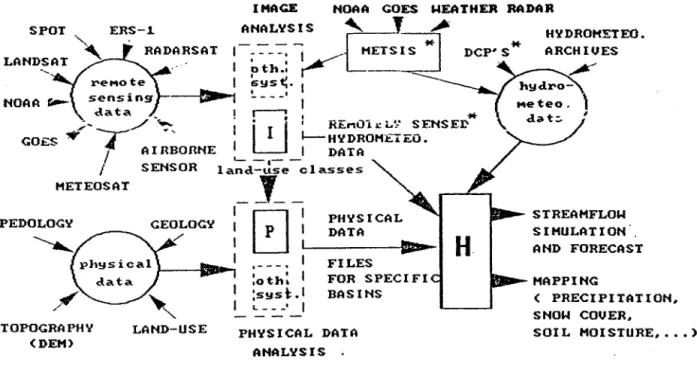
PHYSITEL 1.0 is one of three complementary programs developped specifically for hydrological applications. As seen in figure 1.1, HYDROTEL is a software program allowing simulatiom or forecast of streamflow in rivers. The analysis of remotely sensed data for input to HYDROTEL is done by IMATEL. As for PHYSITEL, it can be considered as a special type a GIS program allowing both the integration of spatial data into hydrological units and determination of relations between these units through the drainage network derived fram DEM data.
IMAGE NOAA GOES WEATHER RADAR
SPOT ERS-1. ANALYSIS
~
~
HYDROMETEO." , . RADARSAT
I-.-=---=-: 1
~
HETSIS *1DCP~S*
LAND~AT .' . 1 ~th.:
r
__
.-_ ...
reMotel::'ys~. 1 ~ !.._--' 1 - !r--:,"*
.;.- . / ,":--, l'~' REMOl d~~_ SENSE!:' GOES"T
1 I--HYDROM.t.u~.O. 1 AIRBORNE ~_, _ _ I DATA / SENSOR land-use classes_J __
HETEOSAT PEDOLOGY TOPOGRAPHY (DEM> 1 GEOLOGY 1 LAND-USE 1 1 ~ 1 PHYSICAL~
L . . :_D_A_T_A_-il~
.-
- -" , ' ,oth. 1 1 ;sysl; .1 L __ - ' 1 FILES BASINS PHYSICAL DATA ANALYSIS . STREAMFLOW SIMULATION AND FORECAST ( PRECIPITATION~ SNOW COVER. SOIL MOISTURE •••• >Figure 1.1 Integrated analysis of physical, remotely sensed and meteorological data for streamflow simulation and forescasting by PHYSITEL, IMATEL and HYDROTEL.
PHYSITEL 1.0 is the first version of PHYSITEL released for tests by the ENVIRONMENT Canada and CCRS users only.
PHYSITEL 1.0 does allow spatial integration of original raster data only to multiples of the original spatial resolution, but that limitation will be removed with PHYSITEL 2.0. With PHYSITEL 2.0, master integration will be allowed to any other raster resolution and to hydralogical units of any shape.
ln PHYSITEL 1.0, a certain number of options in the menus are not operationnel. These options will be come operationnel with PHYSITEL 2.0, together with other options.
1.3 Organization of the manual
ln part "lWO" , the user is first told how to install the computer program. Information on the data set furnished with the program is then given. This data set is made available to the user to allow him to get acquainted with the program. Information on how to start the program is next given. This is followed by a detailed information, window by window, on how to input and process data.
1.4 Software availability and information
The current version (1.0) of PHYSITEL is available only to Environment Canada and CCRS personnel participating in the testing of that version.
For more informations on PHYSITEL 1,0, please contact: Prof. Jean-Pierre Fortin INRS-Eau
2800, rue Einstein, bureau 105 Québec (Québec) G1X 4N8 CANADA Telephone: Telex:
Fax:
(418) 654-2591 051-31623 (418) 654-2600PART 2
PART 2 THE PHYSITEL PROGRAM (1.0)
2.1 General structure
As will be seen in the main menu, the pragram allows the preparation of regional as weil as watershed data bases.
Regional data bases will contain spatial data coming fram various sources with their original spatial resolution. The only modifications made to the original data will be done to their geographical coordinates, if necessary, as ail data in a particular regional data base will be referenced spatially with the same projection (UTM, LAM BERT or polar stereographie). Data sets whose spatial extent is larger or smaller than that of the regional data base will be accepted by PHYSITEL. In particular, PHYSITEL (y 2.0) will be able to input data fram and output data to SPANS (from TYDAC).
Data bases for particular watersheds will be derived fram regional data bases, with the spatial resolution and particular type of integration chosen by the user. Remember that the choice in PHYSITEL 1.0 is restricted to multiples of the original spatial resolution.
2.2 Getting started
This section gives ail necessary informations to install the program on your microcomputer. A data set is also furnished with the pragram to help the user to get acquainted with it.
2.2.1 List of files on floppy disks
PHYSITEL 1.0 is sent on two 1.2 M floppy disk.
Content:
Disk #1: program Disk.
· CONFIG.SYS · AUTOEXEC.BAT · KERNEL.SYS · PHYSITEL.EXE · PHYSITEL.ENM · MESSAGE.ENG · INSTALL.COM · INSTALL.ENM · DRIVERS.EXE . \ DATA · CLiFTON.ASC · CLiFTON.BIN · CLiFTON.SR8 · CLiFTON.ALT · CLiFTON.PTE · CLiFTON.ORI · CLiFTON.MSK · CLiFTON.CLA
Disk #2: Display drivers disk.
Adage/Lexidata PG90 Model30
AT&T 6300/6310 - 640 x 400 Monochrome AT&T 6300/6310 - 640 x 400 Color
Compaq Portable III Display
ADAGE30.SYS CGI6300B.SYS CGI6300C.SYS COMPAQ3.SYS
DGIS High Performance Displays Hercules InColor Display
Hercules Monochrome Graphies Adapter High Resolution EGA Displays
IBM 8514/a 1024 x 768 Display IBM 8514/a 640 x 480 Display
IBM Col or Graphies Adapter - High Res. Mono. IBM Color Graphies Adapter - Med. Res. Col or IBM Enhanced Graphies Adaptor - 4 modes IBM Personal System/2 - Mode 11
IBM Personal System/2 - Mode 12 IBM Personal System/2 - Mode 13 Toshiba 3100 Lap Top Display
2.2.2 Installing PHYSITEL 1.0 CGIDGIS.SYS HERCINCO.SYS HERCBW.SYS HIRESEGA.SYS IBMAFH.SYS IBMAFL.SYS IBMBW.SYS IBMCO.SYS IBMEGA.SYS IBMVGA11.SYS IBMVGA 12.SYS IBMVGA13.SYS T3100.SYS
The AUTOEXEC.BAT and CONFIG.SYS files on your system should first be modified to run PHYSITEL 1.0.
- modifications to AUTOEXEC.BAT file
add: SET KERNEL = path\PHYSITEL
where: "path" is the full path name including drive specification of location of the PHYSITEL subdirectory.
- modifications to CONFIG.SYS file
add: FILES
=
20 (or more)DEVICE = path\nam.name.sys
where: "path" is the full path name of the directory where the display driver is. "name" is the name of the display driver file.
DEVICE = path\GSSCGI.SYS
where: "path" is the full path name of the directory where the GSSCGI.SYS file is.
NOTE: the previous command may be modified to.
DEVICE
=
path\GSSCGI.SYS/Tln that case, only the essential parts of the GSS program are loaded when booting the computer, saving memory space for other programs run on the computer. It is then necessary to copy DRIVERS.EXE in the PHYSITEL directory and to run it prior to run physitel. Otherwise, this is not necessary.
When the AUTOEXEC.BAT and CONFIG.SYS files are mOdified, one may proceed with the other files.
PHYSITEL 1.0 can be installed using program INSTALL.COM present on program disk or by following the steps given below.
2.2.2.1 Installing PHYSITEL 1.0 using INSTALL.COM program
Run the program INSTALL.COM from the disk simply by typing INSTALL and a window will appear (figure 2.1). Enter the full path name of the directory including the drive.
INSTALLATION OF PHYSITEL 1.0
Directory where PHYSITEL 1.0 will be installed: c:\bin F10:RUN
Figure 2.1
ESC:RUN
Shows an example where the user wants to install PHYSITEL on drive C under directory \bin.
2.2.2.2 Installing PHYSITEL manually
Vou can also install PHYSITEL 1.0 following these very simple steps:
1. Create as new directory (or subdirectory) PHYSITEL, using DOS command MD; 2. Change from current directory (or subdirectory) to the new directory (subdirectory)
PHYSITEL, using DOS command CD;
3. When in subdirectory PHYSITEL make two new subdirectories under PHYSITEL, one called ROB the other called WDB.
4. Copy the files PHYSITEL.EXE, PHYSITEL.ENM and MESSAGE.ENG present on the program disk to the current directory PHYSITEL.
Vou should now be ready to start the program.
2.2.3 Test data and structure of data files
ln order to familiarize the user with PHYSITEL 1.0, a data set is included with the program. At the same time, it should be looked at as an example, for the preparation of other data sets.
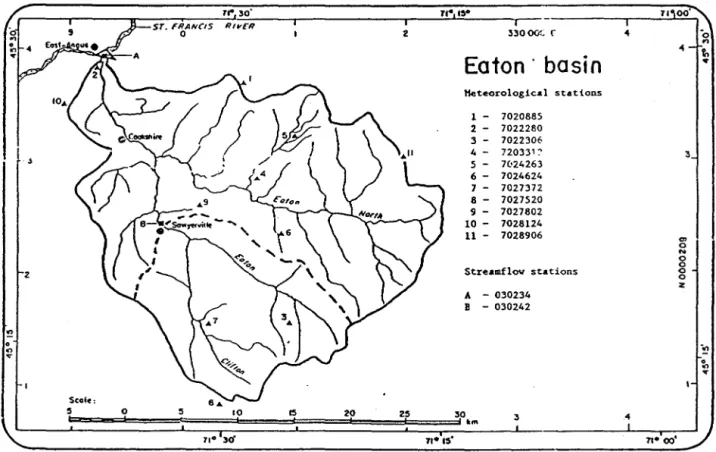
Test basin: sub-basin of the Eaton river upstream of streamgauge station 030242 (Iocated downstream of the bridge on highway 210, at Sawyerville. Figure 2.2 shows the position of the station on the map, together with those of meteorological stations and basins limits.
7" 30' ".·,f~· ST. FRANCIS RivER 1 r -33000'~ (" 4 '0 0 2 fOl 4 t.
Eaton' basin
..
Heteorologieal stations 1 - 7020885 1 - 7022280 3 - 7022306 4 - 720331~ 3 5 - 7(,24263 6 - 7024624 7 - 7027372 8 - 7027520 9 - 7027802 10 - 7018114 11- 7028906 . " 0 N 0 0 Streamflov stations 0 0 li! A - 030234 B - 030142 !! 0 .... on ... 0 on .... Seol.! 5 1 0 1 S 10 1 15 1 20 1 25 1 30 1 lm 3 4 71- 30' n· .,'Figure 2.2 Geographie location of the test basin.
Are included in the data set:
topographie data:
- File names and content for INPUT file:
- Clifton.ASC: mean altitude of each square (m), ASCII file. - Clifton.BIN: mean altitude of each square (m), BINARY file.
- Clifton.SR8: land-use data for each square; imatel file/SR8 format). Unfortunately this is not a classification of the Clifton basins and it's purpose is only to provide the user with a file in the correct format so that be can test the program.
- File structure for ASCII file (Clifton.ASC):
- matrix of altitude of each square entered row by row. Each value is separeted by one or more space, a tab or a new line. There is no header.
- File structure for binary file (Clifton.BIN):
- matrix of altitude of each square entered row by row. Each value is a binary integer coded on two bytes (Type short in C).
- File structure for land-use data (Clifton.SR8):
- this is the SR8 format used by IMATEL 1.0.
- File names and content for OUTPUT file:
- Clifton.ALT: mean altitude of each square (m);
- Clifton.ORI: aspect of each square to eight points of the compass, identified 1 to 8 counterclockwise from East (= 1);
- Clifton.PTE: slope of each square (m/m); - Clifton.MSK: basin mask;
- File structure for *.ALT, *.ORI, *.PTE, *.MSK:
- li ne #1: file type: 1;
- line #2: number of lines, number of colums;
- li ne #3: UTM coordinates (Easting, Northing) of upper left corner, grid size (m);
- line #4: title or comment identifying the file;
land-use data for each square (OUTPUT)
- File name: Clifton.CLA;
- File structure:
- line #1: file type: 1;
- line #2: number of line, number of columns, number of classes; - line #3: EAST, NORTH, class codes, TOTAL;
- line #4 to 3
+
(Ii x co): UTM coordinates (Easting, Northing) of upper left corner, number of pixels belonging to each class, total number of pixels.- class identification and codes:
- bare fields: "champ";
- crops and pasture 1: "herbe"; - crops and pasture 2: "paill"; - extracting areas: "gravi";
- forested areas 1 (coniferous): "resin"; - forested areas 2 (deciduous): "feuil";
- highways and other impervious areas: "route"; - surface waters 1: "eau1";
- surface waters 2: "eau2"; - urban areas: "urb" (not in use);
- waste lands and bushes: "frich" and "coupe"; - wet lands and marshes: "MAR" (not in use).
2.2.4 Starting PHYSITEL 1.1
Change to the directory in which you have your program files and type "PHYSITEL - e" to access the English version of PHYSITEL. The main menu will th en appear on the screen. Vou are now ready to start your session with PHYSITEL 1.0.
2.3 Using PHYSITEL 1.0
The main menu of PHYSITEL 1.0 contains 2 options (figure 2.3) allowing to access either regional or watershed data bases.
You can select either option by using the arrows on the key board and pressing "ENTER". It is also possible to select an option by typing its number directly. At the end of a session, it is possible to exit PHYSITEL 1.0 by selecting "EXIT" and pressing "ENTER" or by typing "0".
MAIN MENU
1._ Regional data bases;
2. Watershed data bases;
O. Exit.
Figure 2.3 Main menu.
2.3.1 Sub-menu #1.0: régional data bases
Two options are offered in sub-menu 1.0 (figure 2.4). Option 1 allows the definition of a new regional data base. If the user wants to access an existing data base, he selects option 2. One can return to the "main menu" by selecting option "0" and pressing "ENTER" or typing "0".
MAIN MENU
1. REGIONAL DATA BASES
2.
1
O. 1. Define new data base;
~ 2.- Use existing data·base;
0.- Return to previous menu.
2.3.1.1 Sub-menu #1.1: define new regional data base
Sub-menu #1.1 (figure 2.5) is used to define the characteristics of a new regional data base.
First type the file name (without extension) under which the ROB will be saved. A title or comment identifying the file more explicitely can be typed on the next lines.
The geographical are a covered by the ROB is th en entered, lower left corner first and upper right corner last. For each corner, the first coordinate is the longitude and the second the latitude. Both coordinates are typed as shown. For example, 71° 40' west would be typed as "7140.000W". Thousanths of a minute are used instead of "seconds" for accuracy purposes. Only portions of data sets included inside of these geographical limits will be stored in the ROB.
The cartographie projection to be used has also to be chosen. Ali data in the ROB will be spatially referenced with the projection. With PHYSITEL 1.0, only the UTM projection is available, so select "UTM".
One can quit the sub-menu any time by pressing "ESC" and return to the previous menu. Otherwise, once the characteristics of the new ROB are given they may be saved by pressing "F10". Informations on the characteristics of the cartographie projection to be used are then ashed. Press "return" after entering the needed informations.
DEFINE NEW REGIONAL DATA BASE
... Regional data base name: sudquec
... Title of comment identifying the file: Regional data base for southern Quebec
... Geographical area:
-Lower left corner (deg min.dec): -Upper right corner (deg min.dec): ... cartographic projection to be used: 1
1 - UTM
2 - LAMBERT(not available)
LONG. 7l40.l84W 7ll7.973W
3 - POLAR STEREOGRAPHIC(not available) FlO: store information
Figure 2.5 Sub-menu #1.1: define new regional data base.
2.3.1.2 Sub-menu #1.2: existing regional data base
LAT. 4506.9l3N 4523.599N
ESC: QUIT
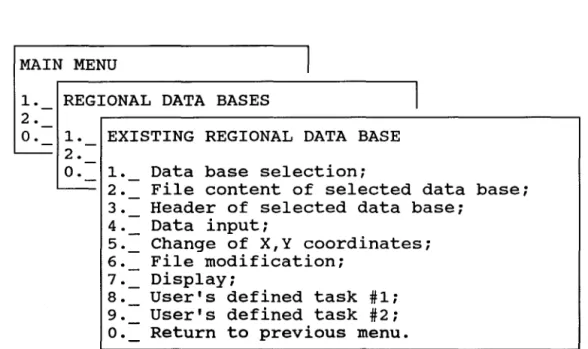
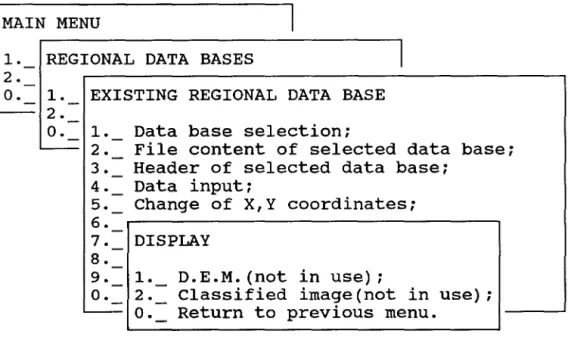
Seven options are now active in sub-menu #1.2. (figure 2.6). The two "user's defined tasks" will be available with PHYSITEL 2.0.
First a RDB has to be selected as the current one, by option 1.
Option 2 allows the user to see the actual content of the selected data base.
The header of the RDB, containing the characteristics of the data base defined in sub-menu #1.1, can be shown if option 3 is selected.
To input new data select option 4.
If a change in x-y coordinates is necessary it can be done by choosing option 5.
Modification of file content can be do ne if option 6 is chosen.
MAIN MENU 1
1. REGIONAL DATA BASES 1
2.
o.
1. EXISTING REGIONAL DATA BASE- 2.
O. 1. Data base selection;
~ 2. File content of selected data base;
3. Header of selected data basei
4. Data input;
5. Change of X,Y coordinatesi
6. File modificationi
7. DisplaYi
8. User's defined task #1;
9. User's defined task #2;
0.= Return to previous menu.
Figure 2.6 Sub-menu #1.2: existing regional data base.
2.3.1.2.1 Sub-menu #1.2.1: data base selection
A list of existing RDB is produced when sub-menu #1.2.1 is chosen (figure 2.7). Select the RDB on which you want to work by placing the cursor on that data base name and then by pressing "ENTER". The name of the current data before selection base appears in the lower left corner of the menu.
DATA BASE SELECTION SUDBEC
SUDQUEC
Current data base: sudquec
Figure 2.7 Sub-menu #1.2.1: data base selection.
2.3.1.2.2 Sub-menu #1.2.2: file content of selected regional data base
Sub-menu #1.2.2 shows the name of the RDB together with a list of files actually in the RDB (figure 2.8). A return to the previous menu is obtained by striking any key.
CONTENT OF CURRENT REGIONAL DATA BASE SUDQUEC.MNT
SUDQUEC.DEM SUDQUEC.ID SUDQUEC.SR8
Please strike any key to continue!
sudquec
2.3.1.2.3 Sub-menu #1.2.3: header of selected regional data base
The content of the header of the selected RDB is shown in sub-menu #1.2.3 for information only. No action can be taken. Return to the previous menu is done by striking any key.
HEADER OF SELECTED DATA BASE Regional data base name: sudquec Description of data base:
Regional data base from southern Quebec Cartographie projection: UTM
characteristics: zone : 19 Geographical area:
Lower left corner : Upper right corner:
EASTING 290000 319999 Please strike any key to continue
NORTHING 4999000 5028999
Figure 2.9 Sub-menu #1.2.3: header of selected regional data base.
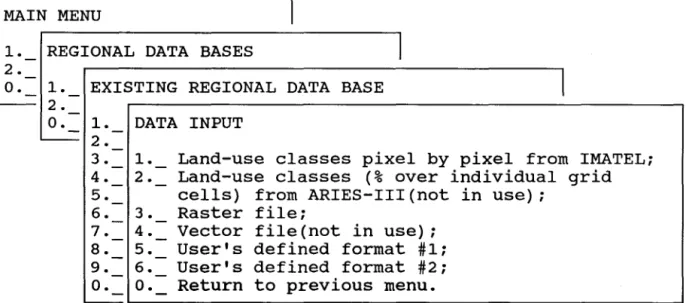
2.3.1.2.4 Sub-menu #1.2.4: data input
Sub-menu #1.2.4 (figure 2.10) is used to access specifie menus for input of various types of data. With PHYSITEL 1.0 it will be possible to input:
-land-use classes pixel by pixel fram Imatel (option 1)
- land-use classes (% over individual and calls) fram ARIES-III (not implemented for PHYSITEL 1.0)
- vector data formatted as defined in sub-menu #1.2.4.4 (not implemented for PHYSITEL 1.0).
Input of raster and vector data from SPANS (a Tydac TM) will be available with PHYSITEL 2.0.
Two more user's defined data input formats will be available with PHYSITEL 2.0.
MAIN MENU
1. REGIONAL DATA BASES
2.
1
o.
1. EXISTING REGIONAL DATA BASE2. O. 1. DATA INPUT ~ 2. 3. 4. 5. 6. 7. 8. 9.
o.
1. Land-use classes pixel by pixel from IMATEL; 2. Land-use classes
(%
over individual gr idcells) from ARIES-III (not in use); 3. Raster file;
4. Vector file(not in use) ; 5. User's defined format #1; 6. User's defined format #2; O. Return to previous menu.
~~---~ Figure 2.10 Sub-menu #1.2.4: data input.
2.3.1.2.4.1 Sub-menu #1.2.4.1: land-use classes pixel by pixel from IMATEL
Land-use classes on a pixel by pixel basis can be input from IMATEL. The land-use file, as output by IMATEL, should contain ail needed informations on class identification (see section 2.2.3 for more details).
Type the name of the IMATEL file and the extension to the extension to the regional file name, which will identify the file. You can also type a comment which will be stored in the header of the RDB file. Press "F10" to store the file.
MAIN MENU
1. REGIONAL DATA BASES
2.
O. 1. EXISTING REGIONAL DATA BASE
~:
1. IDATA INPUTLAND-USE CLASSES PIXEL BY PIXEL FROM IMATEL ... Imatel file name a: \data\clifton. sr8 ... RDB's file name : sudquec.sr8
... Title or comment identifying the file:
F10: store information ESC:QUIT
Figure 2.11 Sub-menu #1.2.4.1: land-use classes pixel by pixel from IMATEL.
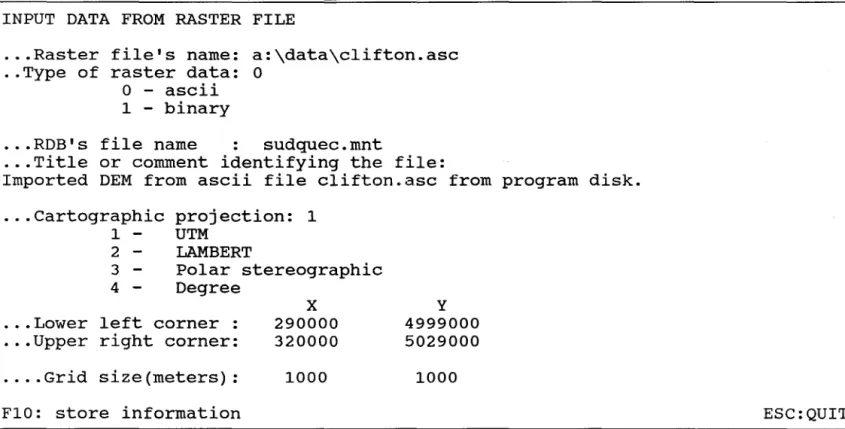
2.3.1.2.4.2 Sub-menu #1.2.4.2: input data from raster file
A general purpose raster format is available with PHYSITEL 1.0 (see section 2.2.3 for more details) (figure 2.12). It is provided to read D.E.M. data primarily, but could be used to read similar types of data as weil.
Type first the original file name of the raster data. Then, enter the type of data: 0 for "ASC", 1 for binary coded on two bytes. Continue by entering the extension to the regional file name under which the data will be saved. On the next line you can add a comment to identify the file.
Indicate the cartographie projection of the raster data, the coordinates of the lower left corner and the upper right corner (x-coordinate first). With PHYSITEL 1.0, only UTM coordinates may be entered. Finally, enter the grid size, in meters, in the X and Y directions.
INPUT DATA FROM RASTER FILE
... Raster file's name: a:\data\clifton.asc .. Type of raster data: 0
o -
aSCll1 - binary
... RDB's file name sudquec.mnt
... Title or comment identifying the file:
Imported DEM from ascii file clifton.asc from program disk. ... Cartographic 1 2 3 4 -projection: 1 UTM LAMBERT Polar stereographic Degree
... Lower left corner: ... Upper right corner:
X 290000 320000 . . . . Grid size(meters): 1000 F10: store information y 4999000 5029000 1000
Figure 2.12 Sub-menu #1.2.4.2: input data from raster file.
2.3.1..2.5 Sub-menu #1.2.5: change de X, Y coordinates
As can be seen in sub-menu 1.2.5 (figure 2.13), with PHYSITEL 2.0, it will be possible ta change the geographical coordinates of a point from degrees ta any of three cartographie projection and back. However, with PHYSITEL 1.0, it is only possible ta change fram degrees to UTM coordinates and back (options 1 and 4).
MAIN MENU
1. REGIONAL DATA BASES 1
2.
o.
1. EXISTING REGIONAL DATA BASEL - - 2. O. 1. '---- 2. 3. 4. 5. 6. 7. 8. 9. O. CHANGE OF X Y COORDINATES 1._ Degrees to UTM;
2._ Degrees to Lambert(not in use) ;
3. Degrees to Polar stereographie(not in use); 4. UTM to Degrees;
5.- Lambert to Degrees(not in use);
6. Polar stereographie to Degrees(not in use) ;
o.
Return to previous menu.~L-_ _ _ _ _ _ _ _ _ _ _ _ _ _ _ _ _ _ _ _ _ _ _ _ _ _ _ _ _ _ _ _ _ _ _ _ _ _ _ _ _ _ _ _ _ ~
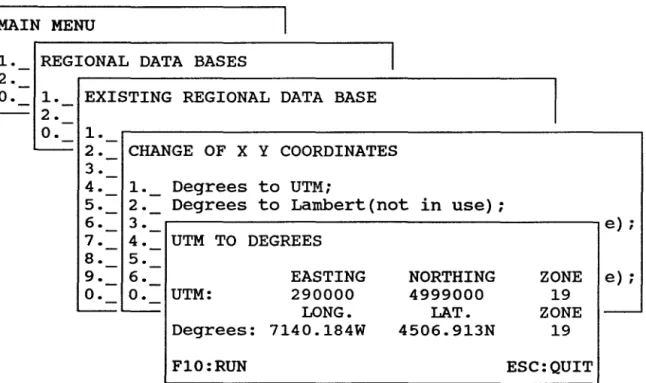
2.3.1.2.5.1 Sub-menu #1.2.5.1: degrees to UTM
Within PHYSITEL 1.0 sub-menu 1.2.5.1 (figure 2.14) serves as a geographical coordinate expressed in degrees.
The user enters the longitude and latitude of the coordinates in degrees using the same format as in sub-menu 1.1 plus the UTM zone relative to which the transformation will be
performed.
The result will appears when pressing IF10".
MAIN MENU
1. REGIONAL DATA BASES
2.
O. l . EXISTING REGIONAL DATA BASE 2. O. l . 2. CHANGE OF X Y COORDINATES 3. 4. l . DEGREES TO UTM 5. 2. 6. 3. LONG. 7. 4. Degrees: 7140.184w 8. 5. EASTING 9. 6. UTM: 290000 O. O. L . - - F10:RUN
Figure 2.14 Sub-menu #1.2.5.1: degrees to UTM.
LAT. ZONE e) ;
4506.913n 19
NORTHING ZONE
4999000 19 e) ;
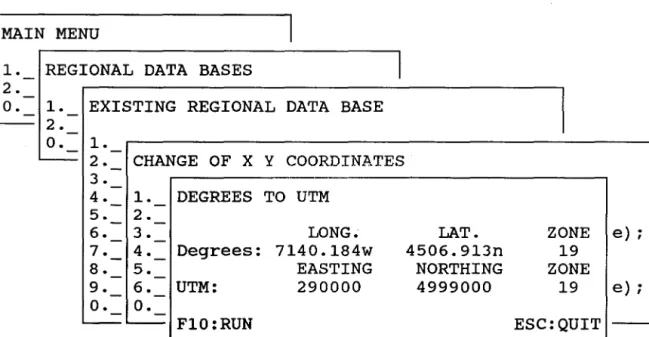
-2.3.1.2.5.2 Sub-menu #1.2.5.2: UTM to degrees
Sub-menu 1.2.5.2 (figure 2.15) is the conterpart of sub-menu 1.2.5.1 and is used to obtain the degree equivalent of a geographical coordinate expressed in UTM.
The users enters the easting, northing ans zone of the UTM coordinate and press "F10" to get the result.
MAIN MENU 1
1. - REGIONAL DATA BASES 1
2.
-O.
-
1.-
EXISTING REGIONAL DATA BASE' - - - - 2. -O.
-
1.-' - - 2. CHANGE OF X Y COORDINATES -3.
-4.
-
1. _ Degrees to UTMi5.
-
2._ Degrees to Lambert (not in use) ;6.
-
3.-
e) ;7.
-
4.-
UTM TO DEGREES8.
-
5.-9.
-
6.-
EASTING NORTHING ZONE e) ;O.
-
o.
-
UTM: 290000 4999000 19' - - - - LONG. LAT. ZONE
-Degrees: 7140.184W 4506.913N 19
FI0:RUN ESC: QUIT
2.3.1.2.6 Sub-menu #1.2.6: file modification
If a user wants to modify a file without leaving PHYSITEL, he may use this menu (figure 2.16). He has access to DOS and may use the program of its choice to edit the file. When this is done, he comes back to PHYSITEL 1.0 by typing "EDIT".
Type "exit" to return to PHYSITEL.
The COMPAQ Personal Computer MS-DOS Version 3.31
(C) copyright Compaq Computer Corp. 1982, 1988 (C) copyright Microsoft Corp. 1981, 1987
D:\PHYSITEL=>
2.3.1.2.7 Sub-menu #1.2.7: display
Oisplay of digital elevation model data or land-use classes on a pixel by pixel basis in the ROB, will be vailable in PHYSITEL. Oisplay of other files in the ROB is yet to be decided.
Choose option for OEM display and option 2 for land-use classe (figure 2.17).
These options will be available with PHYSITEL 2.0.
MAIN MENU
1. REGIONAL DATA BASES
2.
o.
1. EXISTING REGIONAL DATA BASE2.
O. 1. Data base selection;
2. File content of selected data base;
3. Header of selected data base;
4. Data input;
5. Change of X,Y coordinates;
6.
7. DISPLAY
8.
9. 1. D.E.M.(not in use);
O. 2. Classified image(not in use);
, - o.
Return to previous menu.2.3.2 Sub-menu #2.0: watershed data bases
It should noted immediately that a number of menus permitting to work on the watershed data bases (WOB) will be similar to those of the regional data bases (ROB).
Two options are offered in sub-menu 2.0 (figure 2.18). Option 1 allows the definited of a new water shed data bases. To have access to an existing WOB, option 2 has to be selected. On can return to the "main menu" by typing "0" or selecting option "0" and pressing "ENTER".
MAIN MENU
1. WATERSHED DATA BASES
2.
1
o.
1. Define new data base;--=
2.- Use existing data base; 0.- Return to previous menu.Figure 2.18 Sub-menu #2.0: watershed data bases.
2.3.2.1 Sub-menu #2.1: define new watershed data base
Sub-menu #2.1 (figure 2.19) is used to define the characteristics of a new watershed data base.
Frist type the file name (without extension) under which the WOB will be saved and the file name (without extension) of ROB fram which it will be created. A title or comment identifying the file may be added next.
The geographical area within which ail pertinent data should be has also to be entered. Ali subsequent operations in the WOB will be performed only on the data within that geographical area rather th an on the larger ROB geographical area, in other words, on a subject of the ROB data set. Choose the cartographie projection (only UTM for PHYSITEL 1.0) and give the longitude and latitude of the lower left corner and of the upper right corner of the area.
The grid size (in meters) used for spatial integration is next given. Remember that with PHYSITEL 1.0, only multiples of the original spatial resolution may be chosen. The cells obtained from that process will be the basis for the second spatial integration into homogeneous hydrological areas available with PHYSITEL 2.0.
Once the characteristics of the new WOB are given, they may be saved by pressing "F10". Informations on the parameters of the chosen cartographie projection are then asked. After giving those informations, press "enter".
DEFINE NEW WATERSHED DATA BASE
... Watershed data base name: clifton ... From regional data base: sudquec
... Title or comment identifying the data base:
Watershed data base for clifton basin from RDB sudquec ... Cartographic projection: 1 1 - UTM 2 - LAMBERT 3 - Polar stereographie 4 - Degree ... Geographical area: -lower left corner : -upper right corner: . . . grid size(m): F10: store information LONG. 7140.184W 7117.973W X 1000 LAT. 4506.913N 4523.599N Y 1000
Figure 2.19 Sub-menu #2.1: define new watershed data base.
2.3.2.2 Sub-menu #2.2: existing watershed data base
Apart from two user's defined tastes, five options are offered in sub-menu 2.2 (figure 2.20).
First particular a WDB has to be selected as the current data base, using option 1.
The header of the WDB, containing the characteristics of the data base defined in sub-menu 2.1, can be shown if option 2 is selected.
Option 3 user the uses to see the actual content of the selected data base.
Option 4 and 5 lead to a series of other permitting to add or edit files or display them.
Option 6 should be selected if the user wants to export files.
MAIN MENU
1. 2.
o.
WATERSHED DATA BASES
1. EXISTING WATERSHED DATA BASE
2.
o.
1. Data base selection;1
'--- 2. Header of selected data base;
3. File content of selected data base;
4. Add or Edit files;
5.= Display files;
6. Export files;
7.- User's defined task #1;
8. User's defined task #2;
O. Return to previous menu.
2.3.2.2.1 Sub-menu #2.2.1: data base selection
A Iist of existing WDB is produced when sub-menu #2.2.1 is chosen (figure 2.21). Select the WDB on which you want to work by placing the cursor on that data base name and then pressing "ENTER". The name of the current data base before selection appears in the lower left corner of the menu.
DATA BASE SELECTION EATON
CLIFTON
Current data base: clifton
ESC:QUIT2.3.2.2.2 Sub-menu #2.2.2: header of selected data base
The header content of the selected WDB is shown in sub-menu #2.2.2 (figure 2.22) for information purposes only. No action can be taken. Return to the previous menu by striking any key.
HEADER OF SELECTED DATA BASE
Watershed data base name: clifton From regional data base: sudquec Description of data base:
Watershed data base of Eaton bassin Cartographie projection: UTM
Caracteristics: zone : 19 Geographica1 area:
Lower left corner : Upper right corner: Grid size(m):
EASTING 290000 319999 1000 Please strike any key to continue
NORTHING 4999000 5028999
1000
2.3.2.2.3 Sub-menu #2.2.3: file content of selected evatershed data base
Sub-menu #2.2.3 shows the name of the WDB, together with a list of files currently in the WDB (figure 2.23). A return to the previous menu is obtained by striking any key.
FILE CONTENT OF SELECTED DATA BASE: clifton CLIFTON.ID CLIFTON.FIL CLIFTON.HIG CLIFTON.LOW CLIFTON.MNT CLIFTON.MAX CLIFTON.MIN CLIFTON.SLO CLIFTON.ASP CLIFTON.LPT CLIFTON.PAN CLIFTON.FLA CLIFTON.NET CLIFTON.BAS CLIFTON.PA2 CLIFTON.DB CLIFTON.ORI CLIFTON.PTl CLIFTON.PLA CLIFTON.DEB
Please strike any key to continue
2.3.2.2.4 Sub-menu #2.2.4: add or edit files
Sub-menu #2.2.4 (figure 2.24) gives access to the main tasks related to the preparation ofaWDB.
Option 1 is selected if raster data have to be spatially integrated according to the grid spacing defines dor the WDB, prier to other operations.
Option 2 leads to a series of tasks used to define the drainage network uptream of a particular point on a river, and this the watershed area uptream of that point. Ali points belonging to the watershed are subsequently identified using a mask of the watershed. Option 3 permits to define the characteristics of the river channels needed by HYDROTEL. In PHYSITEL 1.0, only a manual input is available to prepare the file in the proper format to be read by HYDROTEL.
Option 4 is to be used for the spatial integration of land-uses classes fram various sources.
Option 5 allows editing of the files.
MAIN MENU
1._ WATERSHED DATA BASES
2. - 1
0._ 1._ EXISTING WATERSHED DATA BASE
'---- 2.
-0._ 1._ Data base selection;
~ 2._ Header of selected data base;
3.
-4._ ADD OR EDIT FILES 5.
-6._ 1. Raster data integration; 7._ 2._ Watershed topography and 8._ 3._ River characteristics;
O. 4. Land-use;
~ 5.= File editing;
6._ User's defined task #1; 7._ User's defined task #2; 0._ Return to previous menu.
Figure 2.24 Sub-menu #2.2.4: add or edit files.
2.3.2.2.4.1 Sub-menu #2.2.4.1: raster data integration
If raster data have to be spatially integrated, sub-menu #2.2.4.1 is chosen (figure 2.25). This may be the case for a D.E.M. data file.
The name of the raster file in the RDB and its name (extension to the watershed file name) in the WDB are given first.
Then an integration pracess is chosen. Only one integration process is available for the moment, in which the mean areal value is computed.
Tape "F10" to run the task. Ali other needed informations are obtained fram the header file of the WDB.
MAIN MENU 1
1. WATERSHED DATA BASES
l
2.
o.
1. EXISTING WATERSHED DATA BASE' - - 2.
o.
1. RASTER DATA INTEGRATION•.. File name in RDB: sudquec.mnt ... File name in WDB: clifton.mnt Integration process: 1
1 - Mean value(single variable)
1 - 2 • 3 • 4. 5. 6. 7. 8.
o.
2 - user's defined integration process #1 3 - User's defined integration process #2'
-F10: RUN ESC:QUIT
10._ Return to previous menu.
2.3.2.2.4.2 Sub-menu #2.2.4.2: watershed topography and mask from WDS files
Sub-menu #2.2.4.2 (figure 2.26) gives access to ail tasks necessary to defined the drainage network upstream of a particular point on a river and this the area covered by the watershed corresponding to that network.
Option 1 is selected to pre-process the DEM file in order to obtain a smoother variation of elevation from point to point.
Option 2 is used to determine slopes, whereas option 3 is used for aspect treatment.
Option 4 is a spacial group of tasks permitting to make the necessary modifications for points or groups of points causing interruptions in the drainage network.
Option 5 allows determination of the drainage network. This option should be selected when ail necessary modifications have been done.
Two more user's defined functions will be available with PHYSITEL 2.0.
MAIN MENU 1
1. WATERSHED DATA BASES 1
2.
o.
1. EXISTING WATERSHED DATA BASE' " - 2.
o.
1.' " - 2. WATERSHED TOPOGRAPHY AND MASK FROM WDB FILES
3.
4. 1._ DEM preprocessingi 5. 2._ Slope determinationi 6. 3. Aspect treatmenti 7. 4.= Local pit processingi
8. 5._ Drainage network
&
mask determinationio.
6. User's defined application #1i~ 7. User's defined application #2i
o.
Return to previous menu.10._
Return to previous menu.2.3.2.2.4.2.1 Sub-menu #2.2.4.2.1: dem preprocessing
Two options are accessed by sub-menu #2.2.4.2.1 (figure 2.27) for pre-processing purposes on the original DEM file.
Option 1 is selected if filtering of the original file is wished. Erroneous values in the file resulting in extreme (minima or maxima) values can be removed if option 2 is selected.
MAIN MENU 1
1.
-
WATERSHED DATA BASES 12.
-o.
- 1. - EXISTING WATERSHED DATA BASE ' - - - - 2.-o.
- 1.-' - - - - 2. WATERSHED TOPOGRAPHY AND MASK FROM WDB FILES
-3.
-4.
-
1.-
DEM PREPROCESSING 5.-
2. -Filtering; 6. - 3.-
1.-7. - 4.
-
2.-
Removal of local extreme values; Return to previous menu.8. - 5. - O. -O. - 6.
-' - - - 7. User's defined application #2; 0.= Return to previous menu.
10._
Return to previous menu.2.3.2.2.4.2.1.1 Sub-menu #2.2.4.2.1.1: filtering
First enter the name of the file to be filtered (usually the original filename) and that of the filtered file (figure 2.28). In practice, only extensions to the filenames have to be given as ail file in the WDB differ only by their extensions.
With PHYSITEL 1.0, only a 3 X 3 filter is used, so choose option 1. Other options will be available with PHYSITEL 2.0.
Press "F10" to execute the task. It is also possible to display either the file to be filtered or the filtered file by pressing "F1 ". The name of the file to be displayed is asked. Press any key to come back to menu.
MAIN MENU 1
1._ WATERSHED DATA BASES
2. - 1
0._ 1._ EXISTING WATERSHED DATA BASE
"--- 2.
-o.
1. DEM PREPROCESSING10._
Ret •.. Filter to be used:1 1 - Default 3x3 filter2 - User's defined filter #1 3 - User's defined filter #2
F1:DISPLAY F10:RUN
Figure 2.28 Sub-menu #2.2.4.2.1.1: filtering.
l
clifton.mnt clifton.fil
2.3.2.2.4.2.1.2 Sub-menu #2.2.4.2.1.2: removal of local extreme values
Local extreme values which one effectively wrong values may be removed fram the DEM file by task 2.2.4.2.1.2 (figure 2.29).
Enter the name of the DEM file (filtered or unfiltered) fram which you want to remove those extreme values. Next, enter the filename under which you want to store the maxima and that for the minima. Storing the extreme values gives the user the possibility to decide that a particular value is not a wing value but correspond to a time value on the terrain.
Press "F10" to execute the tast and "F1" to display the file before and/or after removal of the extreme values.
MAIN MENU
1. WATERSHED DATA BASES
2.
O. 1. EXISTING WATERSHED DATA BASE
2.
WATERSHED TOPOGRAPHY AND
l . - DEM PREPROCESSING . 2. -3. l . -
-4. - 2. - REMOVAL OF LOCAL 5. - O.-MASK FROM WDB FILES
EXTREME VALUES O. l . 2. 3. 4. 5. 6. 7. 8.
O. 6. ' - - - •..••.. DEM file name in WDB: clifton.fil
-7. - Use ... File name of high values: clifton.hig O.
-
Ret ••.• File name of low values: clifton.low10 .- Ret Fl:DISPLAY F10:RUN ESC:QUIT
2.3.2.2.4.2.2 Sub-menu #2.2.4.2.2: slope determination
The si opes are determined by using task 2.2.4.2.2 (figure 2.30). Enter the filename of the DEM file in the WDB, followed by the filename you want to give to the si ope file.
Remember that only extensions need be given.
The method used to determine the slope is chosen next. With PHYSITEL 1.0, only option 1 is available.
Press IF10" to run the task and IF1" to display the slope file.
MAIN MENU
1.
2.
o.
WATERSHED DATA BASES
EXISTING WATERSHED DATA BASE
1. 2.
o.
1. 2. 3. 4. 5. 6. 7. 8.o.
WATERSHED TOPOGRAPHY AND MASK FROM WDB FILES 1
1. SLOPE DETERMINATION 2. 3. 4. 5. 6.
. .. DEM file name in WDB
(filtered or unfiltered): . .. Slope file name
7 • . . • Method to be used: 1
clifton.fil clifton.slo
o.
1 - Default slope determinationi---- 2 - User's defined slope determinationi
1°·_
F1:DISPLAY F10:RUN ESC:QUIT2.3.2.2.4.2.3 Sub-menu #2.2.4.2.3: aspect treatment
ln sub-menu 2.2.4.2.3 (figure 2.31) two options are offered. A first determination of aspect is obtained by using option 1. Then option 2 is used, more or less as a filter, to correct particular aspect directions with the help of both the slope and the DEM files. This happens, for instance if two contiguous slopes are in opposite direction, as computed previously.
MAIN MENU 1
l . - WATERSHED DATA BASES 1
2.
-O.
-
l .-
EXISTING WATERSHED DATA BASEl . . - - 2.
-O.
-
l .-l . . - - 2. WATERSHED TOPOGRAPHY AND MASK FROM WDB FILES
-3.-DEM preprocessing; 4. - l . -5.
-
2.-6.
-
3. - ASPECT TREATMENT 7.-
4.-1. Aspect determination; ation;
8.
-
5.-Correction of aspect; O. - 6. - 2.
-Return to previous menu.
' - - - 7. O.
-
-O.
-10'_
Return to previous menu. Figure 2.31 Sub-menu #2.2.4.3.2.3: aspect treatment.2.3.2.2.4.2.3.1 Sub-menu #2.2.4.2.3.1: aspect determination
ln order to compute aspect directions, enter the filename of the DEM file you want to use and then the filename of the aspect file that will be created (figure 2.32).
Only option 1 is available with PHYSITEL 1.0 to compute the aspects.
Press "F10" to run the task and "F1" to display the aspect file.
MAIN MENU
1.
2.
o.
WATERSHED DATA BASES
1.
2.
o.
EXISTING WATERSHED DATA BASE
WATERSHED TOPOGRAPHY AND MASK FROM WDB FILES 1._ DEM preprocessing; 2._ 1 1. 2. 3. 4. 5. 6. 7. 8.
o.
3._ ASPr===============================================~ 4.-
ASPECT DETERMINATION 5. - 1.-6._ 2._ •.. DEM file name in WBD
7._ 0._ (filtered or unfiltered):
0._ - ••. Aspect file name :
clifton.fil clifton.asp 10._ Ret ... Method to be used: 1
1 - Default aspect determination;
2 - User's defined aspect determination;
F1:DISPLAY F10:RUN ESC:QUIT
2.3.2.2.4.2.3.2 Sub-menu #2.2.4.2.3.2: correction of aspect
If a few aspect directions have to be corrected, it is possible to do so. The following task will make use of informations coming from the DEM, slope and aspect files to check conflicting directives that make the correction if necessary. Enter the filenames of the previously created DEM, si ope and aspect files (figure 2.33) and press IF10" to run the task. The corrections are made directly to the aspect file. The corrected aspect file may be displayed by pressing IF1".
MAIN MENU 1
1. WATERSHED DATA BASES 1
2.
-o.
1. EXISTING WATERSHED DATA BASE- 2.
-o.
1.- 2.
-
WATERSHED TOPOGRAPHY AND MASK FROM WDB FILES3. -4._ 1._ DEM preprocessingi 5. 2.
-6. 3.
-
ASPECT TREATMENT 7. 4. -8. 5.-
1.-o.
6. 2. - CORRECTION OF ASPECT - 7.o.
o.
' - - - .•.•.. DEM file name·
clifton.fil·
-file clifton.slo
.•.. Slope name
·
·
10 .- Ret ... Aspect file name
·
·
clifton.aspF1:DISPLAY F10:RUN ESC:QUIT
2.3.2.2.4.2.4 Sub-menu #2.2.4.2.4: local pit processing
Normal drainage from different parts of a watershed may be bloked by a point whose altitude is lorner th an ail surrownding points or by a group of such points, ail at the same altitude and forming a fiat area. The tasks accessed by sub-menu #2.2.4.2.4 (figure 2.34) are designed to find an outlet for such points or fiat areas.
Option 1 is used to locate ail local pits (single point).
A temporary working data base regrouping ail information on each point must be created with option 2 to facilitate the other options.
Option 3 give access to the task permitting to find an outlet from local pits or fiat areas blocking normal drainage.
Option 4 is used to complete the work for ail uptream points whose normal drainage was block previously.
MAIN MENU 1
1._ WATERSHED DATA BASES 1
2.
-o.
1. EXISTING WATERSHED DATA BASE- 2.
-o.
1.- 2. - WATERSHED TOPOGRAPHY AND MASK FROM WDB FILES
3.
-4._ 1._ DEM preprocessing; 5._ 2._ Slope determination;
6. - 3.
-7.
-
4. - LOCAL PIT PROCESSING8. - 5.
-o.
6. 1. Localisation of local pits;~ 7.- 2.- Working data base;
0.- 3.- Find fIat areas outleti
~ 4.- Find depression outlet;
10._ 0.=
Return to previous menu.Figure 2.34 Sub-menu #2.2.4.2.4: local pit processing.
2.3.2.2.4.2.4.1 Sub-menu #2.2.4.2.4.1: localisation of local pits
Enter the filenames of the DEM and aspect file, as weil as the filename of the file to contain informations on format local pits (figure 2.35). Press IF10" to run the task.
MAIN MENU
1. WATERSHED DATA BASES
2.
o.
1. EXISTING WATERSHED DATA BASE2.
o.
1. 2. 3. 4. 5. 6. 7. 8. O.WATERSHED TOPOGRAPHY AND MASK FROM WDB
1. - DEM preprocessing;
2.
-
Slope determination;3.
-4.
-
LOCAL PIT PROCESSING5. -6. - 1.
-7.
-
2. - LOCALISATION OF LOCAL PITSO.
-
3.-' " - - 4. • ••••• • DEM file name in WDB:
lo._~
·
..
Aspect file name in WDB: · . . . Local pit file name: F10:RUNFigure 2.35 Sub-menu #2.2.4.2.4.1: localisation of local pits.
FILES ion; clifton.fil clifton.asp clifton.lpt ESC:QUIT
2.3.2.2.4.2.4.2 Sub-menu #2.2.4.2.4.2: working data base
To simplify the next sub-menus a working data containing ail pertinent information on each point in particular the DEM, slope and aspect files is prepared. Enter the filenames of the DEM, slope and aspect files, as weil as the filename of the temporary working data base. Then, press IF10" to run the task (figure 2.36).
MAIN MENU
1. WATERSHED DATA BASES
2.
O. 1. EXISTING WATERSHED DATA BASE
2.
o.
1.2. WATERSHED TOPOGRAPHY AND MASK FROM WDB FILES
3. 4. 5. 6. 7. 8. O. 1._ DEM preprocessing; 2._ Slope determination; 3.
-4.
-
LOCAL PIT PROCESSING5. -6. 1.
-
-7. - 2. - WORKING DATA BASE
O. - 3.
-L - - 4.
lo._~
..•.. Slope file name in WDB: . . . • . . . DEM file name in WDB: ... Aspect file name in WDB: . . . Data base file name: F10:RUNFigure 2.36 Sub-menu #2.2.4.2.4.2: working data base.
ion; clifton.fil clifton.slo clifton.asp clifton.db ESC:QUIT
2.3.2.2.4.2.4.3 Sub-menu #2.2.4.2.4.3: fiat area outlets
Sub-menu #2.2.4.2.4.3 gives access to the task permitting to find an outlet fram local pits or fiat are as blocking normal drainage fram upstream points. Enter the filenames of the working data base and local pit files as weil as those of the files in which informations on outlets and fiat areas will be stored (figure 2.37). The fiat area file is prepared for informations only. It can be used to localise fiat areas on a map.
MAIN MENU 1
1. - WATERSHED DATA BASES 1
2.
-o.
- 1.-
EXISTING WATERSHED DATA BASE- 2.
-o.
- 1.-- 2. WATERSHED TOPOGRAPHY AND MASK FROM WDB FILES -3. -DEM preprocessing; 4. - 1. -5.
-
2.-
Slope determination; 6. - 3.-7.
-
4. - LOCAL PIT PROCESSING8. - 5. - ion;
O. - 6. - 1.
--
7.-
2.-
FLAT AREA OUTLETSO. - 3.
-- 4. · .. Data base file name: clifton.db
10._ 0.= · .. Local pit file name: clifton.lpt
' - - - ....• Outlets file name: clifton.out
· .. Flat area file name: clifton.fla
F10:RUN ESC:QUIT
2.3.2.2.4.2.4.4 Sub-menu #2.2.4.2.4.4: depression outlets
With the previous task, an outlet is found for each local pit or fiat area, the task accessed fram sub-menu #2.2.4.2.4.4 does the same of ail points upstream of those local pits or fiat areas in order to restore normal drainage everywhere. The depressions are made of local pits or fiat areas, plus ail points upstream of those discontinuities.
Enter the filenames of the working data base and of the depression files as weil as that of the outlet file obtained with the previous task (figure 2.38). Press "F10" to run the task.
MAIN MENU 1
1. - WATERSHED DATA BASES 1
2.
-o.
- 1. - EXISTING WATERSHED DATA BASE- 2.
-o.
- 1.-- 2. WATERSHED TOPOGRAPHY AND MASK FROM WDB FILES
-3. -4. -5. -6.-7. -8.
-o.
-DEM preprocessing; 1. -2.-
Slope determination; 3.-4. - LOCAL PIT PROCESSING
5. -6. - 1. -7. - 2.
-
DEPRESSION OUTLETSo.
- 3. -' - - - 4.10._
O..
. . . . Data base flle name. . . . Outlets file name: ... Depression file name: F10:RUN
Figure 2.38 Sub-menu #2.2.4.2.4.4: depression outlets.
ion;
cllfton.db clifton.out clifton.dep
2.3.2.2.4.2.5 Sub-menu #2.2.4.2.5: drainage network determination
Once ail previous operations have been done successfully, it is possible to determine the drainage network. Enter the filename of the working data base and the geographical position of the basin outlet (figure 2.39). With PHYSITEL 1.0, only method #1 is available to determine the drainage network and the mask of the watershed (essentially a finary file identifying points inside or outside the basin limits). The right point has to be chosen as the basin outlet. Otherwise. an erroneous watershed will be obtained. Press IF10" to run the task and IF1" to display the results.
MAIN MENU 1
WATERSHED DATA BASES 1
1.
-2.
-o.
1. EXISTING WATERSHED DATA BASE'---- 2.
-o.
1.-
-' - - - - 2. WATERSHED TOPOGRAPHY AND MASK FROM WDB FILES -3.
-DEM preprocessingi 4. 1.
-
-5. - 2.-6. - 3. - DRAINAGE NETWORK & MASK DETERMINATION 7. - 4.
-file clifton.db
8. - 5.
-
. . . Data base name.
.
O.
-
6. - . . . • . . . • Network file name: clifton.basL . . - - 7. .•• Basin outlet EASTING: 297000
-o .
NORTHING: 5026000•.. Method to be used: 1
1 - Default determinationi
2 - User's defined determinationi
F1:DISPLAY F10:RUN ESC:QUIT
2.3.2.2.4.3 Sub-menu #2.2.4.3: river characteristics
It is intented to use informations fram both a remotely sensed image and digital evalation model to determine most river characteristics. This will be available with PHYSITEL 2.0. Only a manual input permitting to go back to DOS to prepare the proper files, is currently available (figure 2.40). So, choose option 1, to prepare the file.
MAIN MENU
1.
2.
o.
WATERSHED DATA BASES 1
1.
-
EXISTING WATERSHED DATA BASE 2.-o.
- 1.-
Data base selection;' - - - 2. -3.
-
RIVER CHARACTERISTICS 4. -1. Manual input; 5.-2.= Interactive input using
6.
-7.
-
0._ Return to previous menu.8.
-o.
- 4.-
Land-use; File editing;' - - - 5.
-6. - User's defined task #1;
7. - User's defined task #2; Return to previous menu.
o.
-Figure 2.40 Sub-menu #2.2.4.3: river characteristics.
DEM(not in use)
,
.
2.3.2.2.4.4 Sub-menu #2.2.4.4: land-use integration for grid intervals
When integration of a raster file containing a single variable (e.g. DEM data) is wished, one should use sub-menu 2.2.4.1. However wh en the raster file refers to a number of variables, as it is the case for land-use, sub-menu #2.2.4.4 is to be used (figure 2.41). With PHYSITEL 1.0, only integration of land-use raster data fram IMATEL is available. So, choose option 1.
MAIN MENU
1. WATERSHED DATA BASES
2.
o.
1. EXISTING WATERSHED DATA BASE2.
O. 1. Data base selection;
2. Header of selected data base;
3.
4. LAND-USE INTEGRATION FOR GRID INTERVALS
5.
6. 1. Raster data from IMATEL;
7. 2. statistics from ARIES-III (not in use);
8. 3. User's defined integration;
O. O. Return to previous menu.
~L-________________________________________ ~
6. User's defined task #1;
7. User's defined task #2;
O. Return to previous menu.
2.3.2.2.4.4.1 Sub-menu #2.2.4.4.1: paster data fram IMATEL
Enter the file names (extensions only) of the file to integrate and of the file where to store the result. Only method 1 is implemented within PHYSITEL 1.0. Press IF10" to run the task.
MAIN MENU 1
1._ WATERSHED DATA BASES
2.
1
-o.
1. EXISTING WATERSHED DATA BASEL...- 2.
-0._ 1._ Data base selection;
---- 2._ Header of selected data base;
3.
-4._ LAND-USE INTEGRATION FOR GRID INTERVALS 5. -6.
-
1. -7. - 2.-8. - 3.
-o.
o.
~~lt;.-
7. O.RASTER DATA FROM lMATEL .•. File name in ROB: ..• File name in WDB:
sudquec.sr8 clifton.sr8 .•. Method to be used: 1
1 - Default integrationi
2 - User's defined integrationi 1
F10:RUN ESC:QUIT
2.3.2.2.5 Sub-menu #2.2.5: display files
Sub-menu 2.2.5 (figure 2.43) lets you display most file present in WDB. Choose option 1,2,3 or 5 and a window appears prompting you to give the name of the file to display. It up to the user to give the correct file name. Option 4 is not implemented yet.
Option 1 will display the DEM with different colors for different class of altitudes.
Option 2 will display the file with different colors for different class of slopes.
Option 3 will display the file with 9 different colors 8 for the standard aspects plus one for fiat square noted as "FL" in the legend.
Option 4 will display the mask of basin using blue for square inside the basins and black if outside.
MAIN MENU
1. 2.
o.
WATERSHED DATA BASES 1
1.
-
EXISTING WATERSHED DATA BASE2.
-o.
-
1.-
Data base selectioniC o - 2. Header of selected data basei
-3.
-
File content of selected data 4. -5. - DISPLAY FILES 6.-7.
-
1. - DEMi 8. - 2._ Slopeio.
- 3. _ Aspecti-
4. _ Drainage(matrix)i 5. - Maski6. - User's defined task #li
7. - User's defined task #2i
o.
-
Return to previous menu.Figure 2.43 Sub-menu #2.2.5: display files.