ANALYSIS OF PCDD/Fs IN HUMAN BLOOD PLASMA USING CALUX
BIOASSAY AND GC-HRMS : A COMPARISON
N. Van Wouwe1, G. Eppe2, C. Xhrouet2,, I. Windal1, H. Vanderperren3, S. Carbonnelle1, I. Van Overmeire1, N. Debacker1, A. Sasse1, E. De Pauw2, F. Sartor1, H. Van Oyen1, L. Goeyens1 1 Scientific Institute of Public Health, 14 J. Wytsman street, B-1050 Brussels, Belgium 2 Center of Analysis of Residues in Traces (CART), University of Liège, B6c Sart-Tilman, B-4000 Liège, Belgium
3 Federal Agency for the Safety of the Food Chain, Leuven road 17, B-3080 Tervuren, Belgium
Introduction
In 1999, Belgium faced a severe food crisis when about 50 kg of PCBs containing 1 g of dioxins were introduced in the food chain1. Great concerns were expressed about the public health impact of this food chain contamination. The possible increase of the dioxins body burden was first investigated through a Monte-Carlo simulation based on the dietary habits observed among adolescents and the PCBs/dioxins measurements in food carried out during the crisis2. The results of this study indicated that adverse health effects are unlikely to be observed owing to the low increase of the dioxins body burden caused by the crisis. In the meantime, an epidemiological survey was still in progress in order to validate the results of this simulation study. Indeed, unused frozen plasma collected in November-December 1998 were available from about 250 blood donors who agreed to provide a second blood sample in 2000-2001. In this way, 250 plasma samples collected before and after the crisis were available for analytical determinations. The aim of the present paper is to compare the results of the CALUX bioassay with those of the GC-HRMS analyses carried out in 209 of these plasma samples.
Materials and Methods Blood Sampling
Plasma samples were collected in polyethylene bags and directly frozen at – 80 °C after blood donation. Their volume ranged from 90 to 650 ml depending on the donation. In February 2002, they were defrost and divided into three aliquots: one for the analysis of 21 dioxin-like congeners (50-200ml), a second one for CALUX-TEQ analysis (20-60ml) and the last one for 7 PCBs markers analyses (20-60ml). These aliquots were stored in polyethylene bottles and kept at -20°C until analyzed.
GC-HRMS analysis
The analyses of the 21 dioxin-like congeners (17 PCDD/Fs + 4 cPCBs) were performed by the CART. Details concerning the method have been previously described 3. Briefly, after addition of 13
C-labeled internal standards, 30-60ml of sample were mixed with formic acid and water (1:1:1). This mixture was loaded on a preconditioned Isolute C18 cartridge and target analytes were eluted with hexane. The extract was cleaned on a Power-Prep system with an automated multi-column clean-up using disposable silica, alumina and carbon. Purified extract with recovery standard were
Organohalogen Compounds, Volumes 60-65, Dioxin 2003 Boston, MA
then injected on a Helwett Packard 6890 serie Gas Chromatography- AUTOSPEC ULTIMA High Resolution Mass Spectrometer. TEQs of all congeners were calculated using 2,3,7,8-TCDD TEFs reported by WHO4.
CALUX- analysis
Bio-analyses were performed at the Scientific Institute of Public Health in Brussels. Briefly, 10ml of blood plasma was extracted with acetone and hexane and dried on a Celite/Na2SO4 column. The extract was then transferred on an Acid Silica column in series with an activated Carbon column (XCARB column). After elution of the sample with hexane, the acid silica column was discarded and the XCARB column was then differentially eluted to yield a PCB and a Dioxin fraction. This last fraction was evaporated and exposed to the mouse hepatoma H1L6.1 cell line developed by Xenobiotic Detection System, Inc. After an exposure time of 20h, cells were lysed and measurements were made with a luminometer 5.
Lipid determination
Because no data were available about the feeding state of donors before plasma donations, values were reported on a lipid weight basis 6. The lipid content of samples was enzymatically determined by the CART.
Results and Discussion
In this paper, only PCDD/Fs concentrations were taken into account for GC-HRMS TEQ values in order to compare those with results of the dioxin fraction in CALUX assay.
Mean CALUX-analyses and mean GC-HRMS TEQ obtained from the 209 first analyses are quite similar to those observed in independent surveys carried out in Belgium (Table 1). However, some caution must be taken. Until now CALUX analyses in Belgium were performed using different purification protocols and different cell line.
Source CALUX analyses
(pg TEQ/g fat)
GC-HRMS analyses of PCDD/Fs (pg I-TEQ/g fat) Present study (n=209) 40.5 (5.0 – 91.3) 25 (1.8 – 68.4) Nawrot & al, 2002 7 (n=200) 33.0 (2.0 – 243.5) - Pauwels & al, 2000 8 (n=106) 46.8 (2.0 – 160.2) - Fierens & al, 1999 9 Waste incinerators (n=52)
Controls (n=27)
- -
36.7 (9.2 - 101.0) 27.2 (5.0 – 71.0) Koppen & al, 2002 10 (n=47) 35.0 (4.2 – 64.9) 48.0 (31.2 – 81.3)
Table 1: Mean TEQ-value (range) observed during various Belgian studies by CALUX bioassay and GC-HRMS
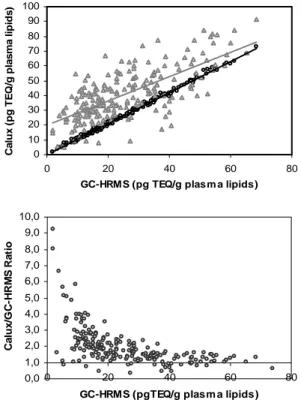
A correlation coefficient of 0.71 has been found between the results of the CALUX bioassay and the results of the GC-HMRS determination (Figure 1). This correlation coefficient is quite comparable to those reported in previous publication12,13. However, the values measured by CALUX bioassay are significantly higher than concentrations of dioxins measured by chemical methods and this difference decreases as the concentration of dioxins gets higher. This bias between the two methods could be explained by various factors :
Organohalogen Compounds, Volumes 60-65, Dioxin 2003 Boston, MA
1) Genetically modified cells used in bioassay are characterized by specific REP values which are different from WHO-TEFs 11. When multiplying concentrations of each congener measured by GC-HRMS with the corresponding REPs, TEQ-values very close to those calculated with WHO-TEFs are obtained (difference from 0 to 2,5 pg TEQ/g fat). These new TEQ-values are presented on figure 1 by open cycles. These values should be considered as what we would measure by CALUX assay if only PCDD/Fs were present in the sample extract. Therefore, the obtained Bioassay results (open triangles) indicate the presence of additional compounds contributing to the TEQ-values in most samples.
2) The potential of Bioassay to measure all compounds with AhR affinity, in addition with the observed non-additive effects of some molecules reacting with bio-analytical method14, could explain the biggest part of this discrepancy between the two methods. Environmental contaminants like brominated dioxins, PCT, PCN, etc … possibly go through the purification columns and take part in the CALUX response. More investigation is required to determine if these kinds of compounds finally reach the dioxin fraction, in which proportion and with which level of contribution to the bio-analysis TEQ-values.
3) The last factor refers to the limit of quantification of GC-HRMS analyses. For samples with low levels of contamination, most of dioxin-like congeners are below the quantification limit. When the concentrations of these congeners are set to be zero, they do not contribute to the GC-HRMS TEQ-value. This could lead to an underestimation of the TEQ-value for chemical analyses at low concentrations and enhance the bias between CALUX and GC-HRMS results (Figure 2).
0 10 20 30 40 50 60 70 80 90 100 0 20 40 60 8
GC-HRMS (pg TEQ/g plasm a lipids)
C a lu x ( p g T E Q /g p la s m a lip id s ) 0
Figure 1: Comparison of CALUX analyses of the dioxin fraction and GC-HRMS analyses of the 17 PCDD/Fs for human blood plasma. ∆ :CALUX results (R:0,71), o : GC-HRMS results with REP (R:0,99)
0,0 1,0 2,0 3,0 4,0 5,0 6,0 7,0 8,0 9,0 10,0 0 20 40 60
GC-HRMS (pgTEQ/g plasm a lipids)
Ca lu x /G C -HRM S Ra ti 80 o
Figure 2 : CALUX/GC-HRMS ratio as a function of concentrations measured by GC-HRMS
Organohalogen Compounds, Volumes 60-65, Dioxin 2003 Boston, MA
Figure 2 shows the importance of these three factors on the CALUX/GC-HRMS ratio at low concentrations. For values above 20 pg TEQ/g fat, the ratio ranges from 3 to 1. For lower level of contamination, the ratio varies from 9 to 5 if lower-bound values are taken in consideration. However, this last ratio is decreased to less than 3 when upper-bound values are used (data not shown). Similar trends were observed for samples of marine mammals analyzed by CALUX bioassay with the same cell line15.
Conclusions
Because CALUX bioassay measures more dioxin-like compounds than the 17 specific PCDD/Fs congeners analyzed by chemical analysis it is not surprising that TEQ values obtained with bio-analysis are higher than those reported with GC-HRMS. The bio-analytical method must be seen as a complementary method providing information about other environmental contaminations as well as the interactions amongst contaminants.
References
1. Bernard A., Hermans C., Broekaert F., De Poorter G., De Cock A., Houins G. (1999), Nature, Vol 401, 231-232
2. Vrijens B., De Henauw S., Dewettinck K., Talloen W., Goeyens L., De Backer G., Willems J.L. (2002), Food Additives and Contaminants, Vol 19(7), 687-700 3. Focant J-F, De Pauw E. (2002), Journal of Chromatography B, Vol 776, 199-212
4. Van den Berg M., Birnbaum L., Bosveld A., Brunström B., Cook P., Feeley M., et al (1998), Environmental Health Perspectives, 106, 775-792
5. Brown D.J., Kishimoto Y., Ikeno O., Chu M., Nomura J., Murakami T., Murata H. (2000), Organohal. Comp., Vol 45, 200-201
6. Phillips D.L., Pirkle J.L.,. Burse V.W, Bernert J.T.,. Omar Henderson J.L,. Needham L.L, (1989), Arch. Environ. Comtam. Toxicol., Vol 18, 495-500
7. Nawrot T.S., Staessen J.A., Den Hond E.M., Koppen G., Schoeters G., Fagard R., Thijs L., Winneke G., Roels H.A. (2002), Environmental Health Perspectives, 110(6), 583-589 8. Pauwels A., Cenijn P.H., Schepens P. J-C., Brouwer A. (2000), Environmental Health Perspectives, 108(6), 553-556
9. Fierens S., Mairesse H., Focant J-F., André J-E., Eppe G., De Pauw E., Bernard A. (2001), Organohal. Comp. Vol 52, 334-336
10. Koppen G., Covaci A., Van Cleuvenbergen R., Schepens P., Winneke G., Nelen V., Van Larebeke N., Vlietinck R., Schoeters G. (2002), Chemosphere, Vol 48, 811-825
11. Brown D.J., Chu M., Van Overmeire I., Chu A., Clark G.C. (2001), Organohal. Comp. Vol 53, 211-214
12. Kayama F.,Hamamatsu A., Sagisaka K., Brown D., Clark G., Suzuki T., 2001, Organohal. Comp. Vol 54, 48-50
13. Kayama F., Horiguchi H., Oguma E., Fujino J., Yabushita H., Brown D.J., Clark G. (2002), Organohal. Comp. Vol 55, 275-278
14. Windal I., Schroijen C., Van Wouwe N., Carbonnelle S., Van Overmeire I., Brown D., Clark G., Baeyens W., Goeyens L., this conference
15. Windal I., Van Wouwe N., Carbonnelle S., Van Overmeire I., Eppe G., Xhrouet C., De Pauw E., Baeyens W., Joiris C., Goeyens L., This conference
Organohalogen Compounds, Volumes 60-65, Dioxin 2003 Boston, MA