Age, sex, and weight at weaning influence organ weight and gastrointestinal development of weanling pigs
13
0
0
Texte intégral
(2) 516. Australian Journal of Agricultural Research. yield and composition can limit piglet growth to well below their potential (Williams 1995; Toner et al. 1996). Sucking pigs grow at approximately 220 g/day between birth and weaning, but this growth rate is far below the biological potential of the artificially reared pig, which can grow in excess of 400 g/day (Hodge 1974; Harrell et al. 1993; Dunshea et al. 1999). The provision of suitable, high quality starter (nursery) diets to early-weaned pigs that increase voluntary feed intake and expedite growth rate has potential to increase the overall productivity of the pig enterprise (Dritz et al. 1996). The design of appropriate diets for early-weaned piglets needs to consider the digestive and physiological development of the piglet. Pigs weaned at approximately 28 days lack little, except absolute ingestive capacity, in terms of gastrointestinal or enzymatic development, and should be relatively capable of digesting the majority of protein and energy sources despite marked changes to gut structure and function (Cranwell et al. 1995; Pluske 2001). In contrast, less is known about how well the piglet weaned at 14 days is able to cope with complex nutrient sources and nutrients, although some studies have highlighted the changes in small intestinal structure and function that occur in piglets weaned around this age (Kelly et al. 1991a, 1991b). There is little information, however, concerning the effects of sex or liveweight on gastrointestinal development of these early-weaned piglets. Further understanding in these areas is likely to be important for the development of nutritional and husbandry programs as these pigs are likely to be most susceptible to the simultaneous stressors imposed at weaning. The aim of this study was to examine the interactive effects of weaning age, liveweight at weaning, sex of the pig, and time after weaning on aspects of gastrointestinal tract development and function. More specifically, changes in visceral organ weights, histological changes along the length of the small intestine, and the activities of selected enzymes in the small intestine and pancreas in the first 14 days following weaning at either 14 days or 28 days of age were investigated. The general hypothesis tested was that light pigs would have a less mature gastrointestinal tract than heavy pigs, and follow a different pattern of gut maturation after weaning. Materials and methods Animals and feeding Forty-eight (Large White × Landrace) pigs were allocated to a 2 × 2 × 2 × 3 factorial arrangement with the respective factors being sex (male and female), age at weaning (14 and 28 days), size at weaning (heavy and light), and sampling time after weaning (1, 7, and 14 days). Pigs obtained from 2 farrowing dates that were separated by 2 weeks were weighed at birth and then weekly thereafter until selection for this study. Pigs were randomly allocated to a slaughter day at the day of selection to avoid any unintentional bias during the subsequent selection. Where possible, each litter was standardised to have 11 pigs. Pairs of heavy and. J. R. Pluske et al.. Table 1.. Composition of the experimental diet (g/kg). Ingredient. g/kg. Dehulled oats Whey powder Skim milk powder Fishmeal Full-fat soybeans Meatmeal Water Tallow Vitamins and mineralsA Zinc oxide Acid Lac dry Tryptosine (mix of L-tryptophan and L-lysine) Amoxyl L-Threonine DL-Methionine Endoxacillin L-Tryptophan. 488 200 100 88.3 035 026.3 023 021 003.5 003 003 002.7 002 001.63 001.03 000.6 000.13. Estimated composition B Digestible energy (MJ DE/kg) Total lysine (g/kg). 015.5 016.1. A. Vitamin mineral premix provided the following nutrients per kg of air-dry diet (mg): retinol, 6.4; cholecalciferol, 083; α-tocopherol, 22; menadione, 60; riboflavin, 3.3; nicotinic acid, 16.5; pantothenic acid, 5.5; pyrodoxine, 1.1; biotin, 56; choline, 1100; cyanocobalamin, 017; Fe, 88; Zn, 55; Mn, 22; Cu, 6.6; I, 22; Se, 1. B Estimated from ingredients.. light pigs of the same sex were weaned from an individual sow. The mean (and range) liveweights at weaning were 9.25 (8.15–11.58), 5.84 (4.74–7.53), 5.51 (4.75–6.93), and 3.46 (2.87–4.27) kg for heavy and light pigs weaned at 28 and 14 days, respectively. All pigs were weaned on the same date, meaning that pigs from different age groups were derived from different sows. This occurred because it was not possible to use the same sow for both weaning ages because ‘all-in, all-out’ farrowing was practiced. However, all sows and litters were housed in the same shed. In all, 48 pigs were weaned into individual pens in the research and development unit at QAF, Corowa, NSW. The weaning room was maintained at 28°C with additional heating provided by individual heat lamps. Thirty-two pigs were offered a pelleted diet (Table 1) on an ad libitum basis, while the remaining 16 pigs (2 pigs from each treatment group) were removed from the sow and fasted for 24 h before being euthanased for determination of gut histology and enzymology. On Day 6 and Day 13 after weaning, 2 pigs from each group had their feed removed and, 24 h later, were weighed and euthanased. The Victorian Institute of Animal Science Animal Ethics Committee and the QAF Animal Ethics Committee approved all experimental procedures. The companion paper by Dunshea et al. (2003b) provides the performance data of pigs in this experiment. Post-mortem procedures Pigs were euthanased i.v. with a lethal dose of pentobarbitone solution (Lethobarb, May and Baker Pty Ltd, Australia). Cervical dislocation and exsanguination of each pig followed, reducing the amount of blood present as a potential contaminant during sample collection and weighing. The abdomen was then opened, from the sternum to the pubis, the entire gastrointestinal tract was removed, and was then divided into 4 sections (stomach, small intestine, caecum, and colon) that were tied off with light twine before being separated. The small.
(3) Gut development in weanling pigs. Australian Journal of Agricultural Research. 517. intestine was stripped free of its mesentery and laid on a table into sections of equal length. Segments of small intestine approx. 10 cm in length and corresponding to distances of 10, 25, 50, 75, and 90% along the length of the organ were then clamped with haemostats. One segment at each site was filled with 5–10 mL of ice-cold, 0.01 mol/L phosphate-buffered saline (pH 7.4) and then excised, wrapped in aluminum foil, and then immersed into liquid nitrogen for subsequent enzymatic and mucosal protein determinations. Adjacent segments at sites 25, 50, and 75% along the small intestine were filled with 5–10 mL ice-cold, phosphate-buffered formalin and then, after 5–10 min, were excised and placed into specimen jars containing the same formalin solution. The empty weights of the stomach, small intestine, caecum, and colon were determined by first weighing the organ containing its contents and then re-weighing the organ after contents were removed and the organ was blotted dry. The weights of the pancreas, liver, heart, kidneys, spleen, and thymus were also recorded for each pig. After the pancreas was weighed, a sample was taken, wrapped in aluminum foil, and then immersed into liquid nitrogen for subsequent enzymatic determinations.. amount of enzyme causing transformation of 1.0 µmol of substrate per min at 25°C. Lipase (EC 3.1.1.3) activities were determined by a pH-stat titration method using tributyrin as a substrate, as described by Borgström and Hildebrand (1975). Interassay CV for the lipase activity was 4.2%. One unit (U) of enzyme activity is defined as the amount of enzyme hydrolysing 1 µmol substrate per min. A competitive ELISA was used for measuring pancreatic colipase. The estimation was adapted to a procedure described previously for measuring enterostatin (Mei et al. 1993). Antiserum was obtained by immunising a rabbit (3BI-16) with porcine procolipase (purified from porcine pancreas according to the method of Erlanson et al. 1973). Ninety-six-well microtiter plates were coated overnight with 0.2 µg/mL procolipase (purified; Erlanson et al. 1973). The antibody against procolipase was diluted 1 : 5000, the secondary biotin conjugated antibody (Sigma Chemicals Inc., St Louis, USA) was diluted 1 : 6000, and the streptavidin-alkaline phosphatase (Sigma Chemicals Inc., St Louis, USA) was diluted 1 : 6000. The plate was developed by the addition of p-nitrophenyl phosphate (Sigma Chemicals Inc.), and a standard curve ranging from 500 µg/mL to 0.7 µg/mL was used in this assay.. Histology. Protein content of the intestinal mucosa. After fixation for several days, ring-shaped lengths of small intestine from all 3 sites were excised, dehydrated, and embedded in paraffin wax. From each of these, 6 transverse sections (4–6 µm) were cut, stained with haematoxylin and eosin, and mounted on glass slides. The height of 10 well oriented villi and their associated crypts was measured with a light microscope using a calibrated eyepiece graticule (after Pluske et al. 1996a).. The protein content of the supernatant fraction of the mucosal homogenate was determined using the method described by Gornall et al. (1949), as adapted by Kelly (1985).. Small intestinal and pancreatic enzyme activities Methods used for the determination of lactase (β-galactosidase; EC 3.2.1.23), sucrase (sucrose-α-glucosidease; EC 3.2.1.48), maltase (α-glucosidease; EC 3.2.1.20), and glucoamylase (glucan 1,4-αglucosidase; EC 3.2.1.3) were adapted from techniques described by Kidder and Manners (1980), Hampson (1983), and Kelly et al. (1991a). The mucosa was removed from the partially thawed sections of the small intestine using a spatula, weighed, and then homogenised in distilled water for 30 s in a polytron (Model CH–6010, Kinematica, Kriens-Luzern, Switzerland). Substrate concentrations and incubation conditions were the same as those used by Kidder and Manners (1980) and Kelly et al. (1991a). In brief, tubes containing the homogenate specific for each enzyme assay were submerged into boiling water following a 30-min incubation at 37°C, and the free glucose was liberated by the action of the mucosal enzymes was then measured using the glucose-6-phosphate dehydrogenase (EC 1.1.1.49)hexokinase (EC 2.7.1.1) assay (Boehringer-Mannheim Biochemica, Germany) for the spectrophotometric determination of glucose. Enzyme activities were expressed as the specific activity of the enzyme per gram of mucosa, and are means for the 5 sites tested. Each pancreas was homogenised at 0°C in 0.2 M Tris-HCl buffer containing 0.05 M CaCl2, pH 7.8, in the ratio 1:10 (w/v) using a glass/glass homogeniser with motor-driven pestle. The homogenates were then centrifuged at 3000G for 1 h (4°C), and the supernatant was used for analysis of total soluble protein, and trypsin and amylase activity. Total protein was analysed using the Lowry method (Lowry et al. 1951), but modified for 96-well microplates (Pierzynowski et al. 1990) and using BSA as a standard. Trypsin activity was measured with a microplate modification (Pierzynowski et al. 1990) of the original method by Fritz et al. (1966), using N-α-benzoyl-dl-arginine-pnitroanilide. Amylase activity was analysed, using blue starch as a substrate, with the Phadebas Amylase Test (Pharmacia, Uppsala, Sweden) according to manufacturer’s instructions. Trypsin and amylase activities were expressed as units (U), with one unit defined as the. Statistics For liveweight, organ weights, and pancreatic enzyme activity the treatment effects were assessed by analyses of variance for a factorial arrangement with the main effects being age at weaning, weight at weaning, sex, and time after weaning. Only 2 pigs were assessed per treatment since the predominant statistical contrast was in the main effects (i.e, sex, weight at weaning, age at weaning) rather than the time points after weaning. All interactions were investigated and none was removed. Where interactions were significant, they are footnoted in the table and reference is made to the nature of the interaction in the text. Split-plot analysis was used to examine the effect of site along the small intestine on histology and enzymology indices. For these analyses, sow and pig were used as blocking factors. Log transformation of the raw data was used where data were skewed and the variances increased with the mean value. The pig was considered the experimental unit. All analyses were performed using GENSTAT (Payne et al. 1993).. Results Liveweights and organ weights of pigs At weaning, there were expected age and weight differences in visceral and gut weights with most tissues being greater in mass in older and heavier pigs (Tables 2 and 3). As anticipated, liveweight at weaning was greater in pigs that were larger (7.07 v. 4.38 kg, P < 0.001) and older (7.34 v. 4.11 kg, P < 0.001) but was not different between boars and gilts (P = 0.34). Liveweight increased with time after weaning (5.73, 7.02, and 8.33 at 1, 7, and 14 days post-weaning, respectively, P < 0.001) with the effects of sex, age, and weight being maintained. Effects of the various treatments were similar for carcass weight. The weights of the liver, heart, and kidneys were greater in pigs that were larger (P < 0.001) and older (P < 0.001) at weaning, but were not different between boars and gilts. The weight of the liver and heart increased with time after.
(4) 518. Australian Journal of Agricultural Research. Table 2.. J. R. Pluske et al.. Effects of sex, age, and weight at weaning, and days post-weaning, on liveweight, carcass weight and organ weights of weaned pigs A, Age at weaning; W, Weight at weaning; S, Sex; D, days post-weaning Day. Boar 28 days Heavy Light. Liveweight (kg)A. Carcass weight (kg). Liver (g). Heart (g)C. Kidneys (g). Spleen (g). Thymus (g). 01 07 14 01 07 14 01 07 14 01 07 14 01 07 14 01 07 14 01 07 14. 08.85 10.25 11.93 07.43 08.41 08.97 215 241 346 53.1 55.8 59.3 54.2 64.0 73.0 23.8 32.6 26.4 30.7 28.8 21.9. 05.27 06.45 09.51 04.31 05.09 07.27 132 168 266 34.7 33.9 46.8 30.1 44.3 59.0 19.0 23.7 21.9 16.2 15.5 19.3. 14 days Heavy Light 05.12 07.10 06.60 04.18 05.71 05.04 160 187 202 30.1 35.6 35.1 32.0 48.0 34.0 13.3 19.3 16.7 12.2 17.1 13.9. s.e.d.B. Gilt. 03.05 04.08 03.83 02.30 03.08 02.78 109 118 133 20.6 25.6 30.6 28.5 24.6 30.2 06.6 10.2 14.4 04.9 05.2 05.7. 28 days 14 days Heavy Light Heavy Light 09.39 10.93 12.69 07.88 08.74 09.86 222 264 304 50.1 58.1 73.0 55.4 62.5 75.4 21.7 35.2 47.5 27.4 26.2 26.3. 05.87 07.21 09.66 04.75 05.66 07.46 147 184 261 33.7 40.3 46.5 32.7 57.8 56.2 17.4 27.4 29.4 19.7 16.6 19.3. 04.91 05.81 07.45 03.98 04.56 05.77 163 140 209 31.3 40.6 54.3 33.1 39.2 49.2 17.1 15.5 26.7 16.1 11.7 20.6. 03.35 04.35 04.94 02.62 03.42 03.74 110 112 141 28.2 38.7 31.6 27.5 28.3 37.1 11.3 09.2 17.2 07.2 09.4 07.4. S. Significance A D. W. 0.294. 0.480. <0.001. 0.005. <0.001. 0.231. 0.430. <0.001. 0.015. <0.001. 15.0. 0.950. <0.004. 0.047. <0.002. 2.300. 0.095. <0.001. 0.023. <0.001. 1.92. 0.360. <0.001. 0.003. <0.001. 1.59. 0.062. <0.001. 0.058. <0.001. 1.26. 0.550. <0.001. 0.980. <0.001. A. Liveweight determined after 24-h fast. Standard error of the difference for effect of D. For effects of S, A, and W, divide by 1.225, 1.225, and 2.575, respectively. C A.W interaction, P = 0.049 (see text for details). B. Table 3.. Effects of sex, age, and weight at weaning, and days post-weaning, on empty weights of organs of the gastrointestinal tract in weaned pigs A, Age at weaning; W, weight at weaning; S, sex; D, days post-weaning Day. Boar 28 days Heavy Light. Pancreas (g). Stomach (g)B. Small intestine (g)C. Caecum (g)D. Colon (g). A. 01 07 14 01 07 14 01 07 14 01 07 14 01 07 14. 10.6 8.4 14.9 12.8 18.6 14.9 46.1 30.8 53.3 40.1 93.8 69.3 223 164 316 271 613 451 14.1 9.5 20.2 19.2 44.9 30.9 53.4 34.1 088.7 61.0 169.2 104.5. s.e.d.A. Gilt. 14 days Heavy Light 8.1 11.8 11.1 25.8 39.8 42.5 180 260 336 8.8 16.4 16.8 39.7 67.4 72.4. 4.9 8.1 8.7 21.6 29.2 27.3 168 190 195 8.5 18.6 9.4 27.8 56.9 45.7. 28 days Heavy Light 12.3 8.2 18.9 11.7 25.8 20.9 53.4 34.5 56.0 45.3 87.1 60.8 253 194 340 275 488 463 21.2 9.8 27.0 18.7 32.4 31.7 60.6 39.8 116.4 93.4 148.6 119.5. 14 days Heavy Light 6.1 11.3 15.6 24.7 40.3 44.7 164 270 52 7.5 14.3 18.7 33.7 64.3 91.1. 05.8 08.7 08.8 21.8 32.4 42.3 160 178 246 07.3 07.0 12.8 30.3 52.0 63.5. S. Significance A D. 0.81. 0.23. <0.002. <0.003. <0.001. 2.53. 0.52. <0.001. <0.001. <0.001. 15.1. 0.96. 0.001. <0.001. <0.001. 1.64. 0.76. <0.001. <0.002. <0.014. 6.51. 0.40. <0.001. <0.001. <0.005. Standard error of the difference for effect of D. For effects of S, A, and W, divide by 1.225, 1.225, and 2.575, respectively. A.D interaction, P = 0.010 (see text for details). C A.D interaction, P = 0.046 (see text for details). D A.D interaction, P = 0.050 (see text for details). B. W.
(5) Gut development in weanling pigs. weaning (P < 0.001, P = 0.023, and P = 0.003 for liver, heart, and kidneys, respectively). The spleen and thymus were heavier in pigs that were larger (P < 0.001) and older (P < 0.001). Only splenic weight increased with time after weaning (16.2, 21.6, and 23.8 g at weaning, and 7 and 14 days post-weaning, respectively, P = 0.058), and tended to be less in boars than in gilts (18.1 v. 22.9 g, P = 0.062) (Table 2). The pancreas was greater in pigs that were larger (13.7 v. 10.1 g, P = 0.002) and older (14.8 v. 9.1 g, P < 0.001) at weaning, but was not significantly different between boars and gilts. The weight of the pancreas increased with time after weaning (8.0, 12.0, and 15.4 g at weaning, and 7 and 14 days post-weaning, respectively, P < 0.001). The weights of the stomach, small intestine, caecum, and colon were greater in pigs that were heavier (0.001 > P = 0.008) and older (0.001 > P = 0.014) at weaning, and were not different between boars and gilts. Stomach weight increased with time after weaning (32, 42, and 58 g at 1, 7 and 14 days post-weaning, respectively, P < 0.001), although there was an interaction (P = 0.010) such that the stomach weight increased with time after weaning to a much greater extent in the pigs weaned at 28 days than it did in the pigs weaned at 14 days. The weight of the small intestine increased with time after weaning (216, 295, and 476 g at 1, and 7, and 14 days post-weaning, respectively, P < 0.001), although a significant interaction occurred (P < 0.001) such that its weight increased in both weaning age groups, but the increase was much greater in the older pigs. The weights of the caecum and colon also increased with time after weaning (10.8, 17.7, and 24.7 g at 1, 7, and 14 days post-weaning, respectively, P < 0.002, for caecum; 40, 75, and 102 g at weaning, and 7 and 14 days post-weaning, respectively, P < 0.001, for colon) (Table 3). Relative weights (as percentage of liveweight) of visceral organs The relative weight of the liver was affected only by the age of the pig, with pigs weaned at 14 days of age having heavier liver weights than pigs weaned at 28 days (2.92 v. 2.52%, P = 0.008). A significant interaction occurred between weaning age and sex (P = 0.018) for the relative weight of the heart, it being greater in gilts weaned at 14 days of age. The relative weight of the kidneys showed significant effects of age (0.71 v. 0.62% for pigs weaned at 14 days and 28 days of age, respectively, P = 0.040) and weight (0.62 v. 0.70% for heavy and light, respectively, P = 0.034). The relative weight of the thymus decreased with time after slaughter (P = 0.028), and a significant interaction occurred between age and weight of pigs such that light pigs weaned at 14 days had the lowest thymus weights (0.15 v. an average of 0.25%, P = 0.015). The relative weight of the pancreas increased with day after weaning (0.14 v. 0.18 v. 0.19% at 1, 7, and 14 days after weaning, respectively, P = 0.014), and there was a trend (P = 0.059) for light pigs to have a relatively heavier pancreas than heavy pigs (0.18 v. 0.16%) (Table 4).. Australian Journal of Agricultural Research. 519. A significant 3-way interaction between age, weight, and day after weaning occurred for the relative weight of the stomach (P = 0.013), with light boars and gilts weaned at 14 days of age having relatively heavier stomachs than their heavy counterparts and pigs weaned at 28 days of age; this effect was maintained to 14 days after weaning. Significant 3-way interactions between age, sex, and weight (P = 0.029), age, weight, and day after weaning (P = 0.005), and sex, weight, and day after weaning (P = 0.002) occurred for the relative weight of the small intestine. To summarise these interactions, light early-weaned boars and gilts had greater relative small intestinal weights than heavy and 28-day-oldweaned pigs of either sex, although with increasing days after weaning, these differences became narrower. Significant main effects of sex (0.27 v. 0.24% for boars and gilts respectively; P = 0.020), day after weaning (0.19 v. 0.27 v. 0.30% at 1, 7, and 14 days after weaning, respectively, P < 0.001), and weight (0.28 v. 0.23% for light and heavy pigs respectively; P = 0.013) were recorded for the weight of the caecum (Table 4). Small intestinal histology and enzymology The protein content of the mucosa increased after weaning, particularly in the first week (107.6, 123.8, and 126.2 mg protein/g mucosa at 1, 7, and 14 days post-weaning, respectively, P < 0.001). Mean villous height was lower in boars than in gilts (367 v. 406 µm, P = 0.015), but was not different between pigs weaned at 28 and 14 days (P = 0.47) or between heavy and light pigs (P = 0.81). Mean villous height was greatest immediately after weaning, then decreased and remained low by the 14th day (480, 329, and 353 µm at 1, 7, and 14 days post-weaning, respectively, P < 0.001) (Table 5). Mean villous height decreased distally along the small intestine (407, 385, and 369 µm for sites 25, 50, and 75%, respectively, P < 0.001). Mean crypt depth was similar between boars and gilts (P = 0.59), pigs weaned at 28 and 14 days (P = 0.60), and heavy and light pigs (P = 0.90). Mean crypt depth increased with time after weaning (143, 182, and 201 µm at 1, 7, and 14 days post-weaning, respectively; P < 0.001) (Table 5), and decreased distally along the length of the small intestine (181, 176, and 169 µm for sites 25, 50, and 75%, respectively, P < 0.001). The specific activity of maltase in the small intestine was lower in boars than in gilts (0.85 v. 1.09 µmol glucose/(min.g mucosa), P = 0.002), greater in pigs weaned at 28 days compared with 14 days (1.28 v. 0.66, P < 0.001), and tended to be greater in heavier pigs (1.04 v. 0.90 µmol glucose/(min.g mucosa), P = 0.055). Maltase activity increased with time after weaning (0.44, 0.97, and 1.50 at 1, 7, and 14 days post-weaning, respectively, P < 0.001), although there was a significant interaction (P = 0.022) such that maltase activity was lower in boars than in gilts at 7 and 14 days after weaning but not on the first day after weaning (Table 5). Maltase activity was greatest between 50 and 75%.
(6) 520. Australian Journal of Agricultural Research. Table 4.. Effects of sex, age, weight, and days after weaning on the relative weights of visceral organs (percent of fasted liveweight) of the gastrointestinal tract in weaned pigs A, Age at weaning, W, weight at weaning; S, sex; D, days post-weaning Day. Boar 28 days Heavy Light. Liver. HeartB. Kidneys. ThymusC. Pancreas. StomachD. Small intestineE. CaecumF. ColonG. J. R. Pluske et al.. 01 07 14 01 07 14 01 07 14 01 07 14 01 07 14 01 07 14 01 07 14 01 07 14 01 07 14. 2.42 2.36 2.91 0.60 0.55 0.50 0.61 0.63 0.61 0.35 0.28 0.18 0.12 0.14 0.16 0.52 0.52 0.79 2.52 3.08 5.15 0.16 0.20 0.38 0.60 0.87 1.42. 2.51 2.60 2.79 0.67 0.53 0.49 0.58 0.69 0.62 0.31 0.24 0.20 0.16 0.20 0.16 0.58 0.63 0.73 3.13 4.23 4.73 0.18 0.30 0.32 0.64 0.95 1.10. 14 days Heavy Light 3.12 2.64 3.03 0.59 0.50 0.53 0.62 0.68 0.52 0.24 0.24 0.21 0.16 0.16 0.17 0.50 0.56 0.65 3.51 3.66 5.07 0.17 0.23 0.26 0.78 0.95 1.10. s.e.dA. Gilt. 3.66 2.88 2.54 0.68 0.63 0.83 0.94 0.60 0.76 0.16 0.13 0.12 0.16 0.20 0.21 0.71 0.72 0.76 5.49 4.67 4.70 0.28 0.46 0.36 0.91 1.40 1.24. 28 days Heavy Light 2.36 2.43 2.12 0.53 0.53 0.59 0.59 0.57 0.63 0.28 0.24 0.22 0.13 0.17 0.20 0.57 0.51 0.70 2.73 3.12 3.70 0.22 0.25 0.24 0.65 1.07 1.09. 2.56 2.55 2.69 0.58 0.56 0.48 0.56 0.80 0.58 0.32 0.23 0.20 0.14 0.16 0.21 0.59 0.63 0.64 3.37 3.82 4.78 0.16 0.26 0.32 0.68 1.29 1.24. S. Significance A D. 0.153. 0.38. <0.008 <0.14. 0.021. 0.052. <0.001 <0.062 0.107. 0.044. 0.62. <0.040 <0.61. 0.027. 0.68. <0.026 <0.028 0.006. 0.012. 0.48. <0.19. 0.023. 0.94. <0.030 <0.001 <0.001. 0.247. 0.39. <0.003 <0.002 <0.001. 0.017. 0.020. <0.45. <0.001 0.013. 0.063. 0.70. <0.15. <0.001 0.056. 14 days Heavy Light 3.32 2.42 2.80 0.64 0.69 0.73 0.68 0.68 0.66 0.33 0.20 0.28 0.12 0.20 0.21 0.50 0.70 0.60 3.33 4.66 4.71 0.15 0.25 0.25 0.69 1.10 1.22. 3.29 2.68 2.79 0.84 0.72 0.64 0.82 0.79 0.72 0.21 0.11 0.15 0.17 0.19 0.18 0.65 0.74 0.86 4.72 3.83 4.98 0.22 0.25 0.26 0.90 0.99 1.28. 0.014. W 0.27. 0.034. 0.059. A. Standard error of the difference for effect of D. For effects of S, A, and W, divide by 1.225, 1.225, and 2.575, respectively. A.S interaction, P = 0.018 (see text for details). C A.W interaction, P = 0.015 (see text for details). D A.W (P = 0.001) and A.W.D interactions (P = 0.013) (see text for details). E W.D (P = 0.003), A.S.W (P = 0.029), A.W.D (P = 0.005) and S.W.D (P = 0.002) interactions (see text for details). F A.W interaction (P = 0.072) and S.W interaction (P = 0.085). G A.S.W interaction (P = 0.040) (see text for details). B. along the small intestine. The specific activity of glucoamylase was highest in pigs weaned at 28 days rather than 14 days (2.19 v. 1.03 µmol glucose/(min.g mucosa), P < 0.001), but was not different between boars and gilts (P = 0.66) or between heavy and light pigs (P = 0.28). Small intestinal glucoamylase activity increased with time after weaning (0.71, 1.75, and 2.36 at 1, 7, and 14 days post-weaning, respectively, P < 0.001) (Table 5). Glucoamylase activity was greatest between 50 and 75% along the small intestine (Fig. 1). The specific activity of lactase tended to be less in boars than in gilts (1.07 v. 1.50 µmol glucose/(min.g mucosa), P = 0.062), but was not different between pigs weaned at 28 or 14 days (P = 0.69) or between heavy and light pigs (P = 0.44). However, there was an interaction (P = 0.005) such that in the pigs weaned at 14 days, those that were. heavier had a higher lactase activity, whereas the converse was true in pigs weaned at 28 days. This was particularly so on the day after weaning as indicated by the interaction (P = 0.038) between age and weight at weaning and time post-weaning. Lactase activity decreased over the first 2 weeks from weaning (1.59 and 1.00 at 1 and 14 days post-weaning, respectively, P = 0.012) (Table 5). Lactase activity was greatest at the proximal end of the small intestine. The specific activity of sucrase was lower in boars than in gilts (0.92 v. 1.86 µmol glucose/(min.g mucosa), P = 0.017), higher in pigs weaned at 28 days compared with 14 days (2.00 v. 0.86, P = 0.005), but was not different between heavy and light pigs (P = 0.96). Sucrase activity increased in the first 2 weeks after weaning (0.94 and 1.84 at 1 and 14 days post-weaning, respectively, P = 0.020); however, there was an interaction (P = 0.022) such that.
(7) 14. 1. 14. 494 305 317 154 189 176 112 115 125 0.19 0.63 0.93 0.37 0.88 1.34 0.463 (2.90) –0.095 (0.80) –0.228 (0.59) –0.06 (0.87). 480 317 363 143 192 214 94 123 125 0.87 1.02 1.59 1.21 2.73 3.13 –0.266 (0.54) –0.082 (0.83) –0.010 (0.98) 0.40 (2.48). 472 320 362 146 171 218 108 124 126 0.58 0.91 1.79 0.81 2.64 3.07 0.434 (2.72) –0.193 (0.64) 0.292 (1.96) 0.37 (2.34). Day 28 Heavy Light. Boar. 412 273 312 138 160 220 114 123 127 0.22 0.62 0.62 0.41 1.32 0.92 –0.274 (0.53) 0.239 (1.73) –1.354 (0.04) 0.32 (2.10). Day 14 Heavy Light 502 359 351 137 181 190 107 126 129 0.26 0.83 1.79 0.48 1.53 2.25 0.246 (1.76) 0.216 (1.64) 0.053 (1.13) 0.161 (1.45). Gilt. 516 377 368 140 192 213 93 129 124 0.16 0.58 1 0.28 1.11 1.45 0.148 (1.41) –0.013 (0.97) 0.349 (2.23) 0.221 (1.66). Day 14 Heavy Light 478 304 358 138 197 198 122 127 127 0.85 1.77 1.76 1.51 2.27 2.48 0.4 (2.51) –0.302 (0.50) 0.414 (2.59) 0.19 (1.55). 488 377 391 151 175 176 110 124 126 0.41 1.48 2.31 0.63 1.69 3.94 0.489 (3.08) 0.214 (1.64) 0.249 (1.77) 0.513 (3.26). Day 28 Heavy Light. 0.1129. 0.0731. 0.176. 0.092. 2.9. 6.0. 17.3. s.e.d.A. 0.017. 0.062. 0.656. 0.002. 0.363. 0.602. 0.015. S. 0.005. 0.694. <0.001. <0.001. 0.665. 0.606. 0.474. A. 0.020. 0.012. <0.001. <0.001. <0.001. <0.001. <0.001. Significance D. B. Standard error of the difference for effect of D. For effects of S, A, and W, divide by 1.225, 1.225, and 2.575, respectively. See Fig. 1 for means for different segments along the length of the small intestine (see text for details). C S.D interaction, P = 0.022 (see text for details). D Since raw data displayed heterogeneity in variances, data were log-transformed for ANOVA. Values in parentheses are geometric means derived after back-transformation. E A.W interaction, P = 0.005; A.W.T interaction, P = 0.038 (see text for details). F S.D interaction, P = 0.022 (see text for details).. A. SucraseD,F [µmol glucose/(min.g mucosa)]. LactaseD,E [µmol glucose/(min.g mucosa)]. Glucoamylase [µmol glucose/(min.g mucosa)]. MaltaseC [µmol glucose/(min.g mucosa)]. Protein (mg/g mucosa). Crypt depth (µm). 1 7 14 1 7 14 1 7 14 1 7 14 1 7 14 1. Day. 0.959. 0.442. 0.277. 0.055. 0.913. 0.903. 0.812. W. <0.001. <0.001. <0.001. <0.001. 0.058. 0.007. <0.001. LB. Effects of sex, age, and weight at weaning, days post-weaning, and length along the small intestine on small intestinal histology and enzymology in weaned pigs A, Age at weaning; W, weight at weaning; S, sex; D, days post-weaning; L, length along the small intestine. Villous height (µm). Table 5.. Gut development in weanling pigs Australian Journal of Agricultural Research 521.
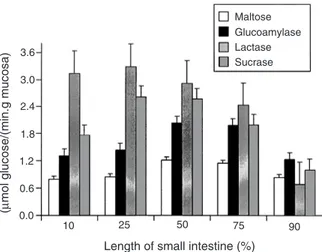
(8) Australian Journal of Agricultural Research. (µmol glucose/(min.g mucosa). 522. J. R. Pluske et al.. Maltose Glucoamylase Lactase Sucrase. 3.6 3.0 2.4 1.8 1.2 0.6. next week (22131, 10186, and 10965 U/g pancreas at 1, 7, and 14 days post-weaning, respectively; P = 0.002). The activity of lipase in the pancreas was similar between boars and gilts (P = 0.22) and between pigs weaned at 28 days compared with 14 days (P = 0.20), but was higher in heavy compared with light pigs (5129 v. 3311 U/g pancreas, P = 0.050). Pancreatic lipase activity decreased in the first week after weaning and remained constant thereafter (6095, 3396, and 3381 U/g pancreas at 1, 7, and 14 days post-weaning, respectively; P = 0.049) (Table 6). Discussion. 0.0 10. 25. 50. 75. 90. Length of small intestine (%). Fig. 1. Mean specific activities (µmol of glucose released per minute per gram of mucosa) of maltase (EC 3.2.1.20), glucoamylase (EC 3.2.1.3), lactase (EC 3.2.1.23), and sucrase (EC 3.2.1.48) measured at sites 10, 25, 50, 75, and 90% along the length (proximal to distal orientation) of the small intestine. Bars represent the mean and capped lines the standard error of the mean for 48 pigs per site, with pigs being sampled at 1 and 14 days after weaning.. activity was lower in boars and gilts on the first day after weaning (0.47 v. 1.85), whereas there was no significant effect of sex at 14 days post-weaning (Table 5). Sucrase activity was greatest between 50 and 75% along the small intestine (Fig. 1). Pancreatic enzyme activity Pancreatic trypsin activity tended to be lower in boars than in gilts (11.5 v. 15.3 U/g pancreas, P = 0.065), but was higher in pigs weaned at 28 days compared with 14 days (20.2 v. 8.7 U/g pancreas, P < 0.001) and in heavy compared with light pigs (15.7 v. 11.1 U/g pancreas, P = 0.028). Pancreatic trypsin activity increased in the first 2 weeks after weaning (9.0, 14.4, and 17.9 U/g pancreas at 1, 7, and 14 days post-weaning, respectively; P = 0.003); however, there was an interaction (P = 0.016) such that trypsin activity increased more rapidly after weaning, and to a greater extent, in pigs weaned at 28 days compared with those weaned at 14 days (Table 6). The activity of amylase in the pancreas was similar between boars and gilts (P = 0.35), between pigs weaned at 28 days compared with 14 days (P = 0.22), and between heavy compared with light pigs (P = 0.15). There was no effect of time after weaning on amylase activity (6266, 8110, and 8810 U/g pancreas at 1, 7, and 14 days post-weaning, respectively, P = 0.29). Pancreatic colipase activity tended to be lower in boars than in gilts (11561 v. 15812 U/g pancreas, P = 0.085), but was not different in pigs weaned at 28 days compared with 14 days (P = 0.57) or between heavy and light pigs (P = 0.14). Pancreatic colipase activity decreased in the first week following weaning and remained constant over the. The components of the pig’s gastrointestinal tract that are mainly responsible for the digestion and absorption of feed are the stomach, small intestine, pancreas, and liver. The ability of the pig to perform digestive and absorptive functions will depend on the physical capacity of the gut, the nature and amount of the secretions it can provide (e.g. acids, enzymes, bicarbonate, bile), the development of mechanisms to control these secretions, and the digestive and absorptive capacity of the mucosal surface of the small intestine (Cranwell 1995). In the current study, it was evident that pigs weaned at 28 days of age, and pigs that were heavier at either weaning age, had heavier organs (on an absolute basis) than pigs weaned at 14 days and that were lighter at either weaning age. When expressed on a percentage liveweight basis, however, the relative weights of the stomach, small intestine, caecum, and colon in light boars and gilts weaned at 14 days of age were actually greater compared with those in all other pigs. These observations are consistent with the findings of Ebner et al. (1994) that undernourished pigs will preferentially maintain gut size at the expense of other sites of protein deposition, such as skeletal muscle. Whereas the relative weights of these gut tissues showed a steady increase with time after weaning for the pigs weaned at 28 days of age and the heavy pigs weaned at 14 days of age, the corresponding changes in the light pigs weaned at 14 days were far less marked. This suggests that the pattern of gut development after weaning proceeds differently for light-for-age, early-weaned pigs compared with their heavy counterparts, or in light and heavy pigs weaned at 28 days of age. The weights of all organs increased with time after weaning, an effect most likely due to the increase in solid food intake and hence increased supply of nutrients available for growth (see companion paper by Dunshea et al. 2003b). In support, Kelly et al. (1991b) reported that 14-day-old weaned pigs fed an amount of 150, 175, 205, 225, and 235 g/day on Day 1–5 after weaning, respectively, had heavier gastrointestinal organs (absolute or per kg bodyweight) than pigs fed 0, 25, 50, 75, and 100 g/day on Day 1–5 after weaning, respectively. However, the weights and relative weights of the stomach, small intestine, and caecum increased with time after weaning to a greater extent in pigs weaned at 28 days compared with their counterparts weaned.
(9) 14. 7. 1. 14. 7. 1. 14. 7. 1. 14. 7. 1. 1.20 (15.9 1.46 (28.7) 1.36 (23.0) 3.97 (9419) 4.01 (10280) 3.88 (7621) 4.25 (17906) 4.24 (17338) 4.27 (18707) 3.95 (8954) 3.78 (6053) 4.05 (11246). 0.87 (7.5) 1.33 (21.2) 1.22 (16.6) 3.75 (5559) 4.15 (13996) 3.85 (7047) 4.21 (16218) 4.07 (11858) 3.51 (3243) 3.56 (3639) 3.62 (4150) 2.84 (689). 28 days Heavy Light. Boar. 0.98 (9.5) 0.81 (6.5) 1.09 (12.2) 3.81 (6471) 3.88 (7621) 3.87 (7379) 4.59 (39174) 3.87 (7482) 3.87 (7345) 3.99 (9863) 3.23 (1683 3.33 (2138). 0.72 (5.2) 0.66 (4.5) 1.01 (10.1) 3.75 (5649) 3.39 (2449) 3.84 (6918) 4.22 (16749) 3.71 (5164) 3.92 (8375) 3.73 (5321) 3.27 (1866) 3.33 (2158). 14 days Heavy Light 1.06 (11.4) 1.62 (41.4) 1.63 (43.0) 3.83 (6683) 4.09 (12274) 3.95 (8954) 4.48 (29854) 3.83 (6714) 4.34 (21928) 3.95 (8810) 3.44 (2761) 3.80 (6339). 0.92 (8.4) 1.47 (29.2) 1.54 (34.4) 3.45 (2825) 4.13 (13335) 4.15 (14256) 4.20 (15704) 4.29 (19498) 4.15 (14093) 3.84 (6871) 3.66 (4519) 3.62 (4169). 28 days Heavy Light. Gilt. 0.95 (8.9) 1.04 (10.9) 1.18 (15.0) 4.00 (9977) 3.98 (9528) 4.04 (10914) 4.35 (22336) 4.00 (9886) 4.18 (15136) 3.62 (4130) 3.56 (3648) 3.82 (6531). 0.93 (8.5) 0.88 (7.6) 1.01 (10.2) 3.82 (6531) 3.65 (4487) 3.98 (9528) 4.46 (28973) 4.05 (11272) 4.08 (11912) 3.65 (4426) 3.69 (4909) 3.44 (2754). 14 days Heavy Light. 0.112. 0.093. 0.096. 0.080. s.e.d.A. 0.221. 0.085. 0.346. 0.065. S. Effects of sex, age, and weight at weaning, and days post-weaning, on pancreatic enzymology in weaned pigs A, Age at weaning; W, weight at weaning; S, sex; D, days post-weaning. 0.201. 0.568. 0.217. <0.001. B. 0.049. 0.002. 0.292. 0.003. Significance A D. Standard error of the difference for effect of D. For effects of S, A, and W, divide by 1.225, 1.225, and 2.575, respectively. Since raw data displayed heterogeneity in variances, data were log-transformed for ANOVA. Values in parentheses are geometric means derived after back-transformation. C A.D interaction, P = 0.016 (see text for details).. A. LipaseB (U/g pancreas). ColipaseB (U/g pancreas). AmylaseB (U/g pancreas). TrypsinB,C (U/g pancreas). Day. Table 6.. 0.050. 0.143. 0.146. 0.028. W. Gut development in weanling pigs Australian Journal of Agricultural Research 523.
(10) 524. Australian Journal of Agricultural Research. at 14 days of age. This most likely reflected the greater level of voluntary feed intake seen in pigs weaned at an older age (Dunshea et al. 2002, 2003b). Cranwell (1995) summarised data from numerous studies highlighting the rapid growth of gastrointestinal organs after weaning, and concluded that the weaned pig requires a relatively larger digestive system than a sucking pig to satisfactorily digest and absorb the inherently less digestible diets offered after weaning, and maintain a commercially acceptable level of performance. The length of time that it takes the pig to develop its digestive and absorptive capacity, irrespective of weaning age, sex and liveweight, is likely therefore to be one of the greatest limitations affecting performance after weaning (Cranwell 1995). Villous height, crypt depth, and the specific activities of lactase and sucrase have often been used as ‘markers’ of small intestinal maturity and development after weaning. The small intestine undergoes marked changes in villous and crypt architecture, and reductions in specific enzyme activity and absorptive capacity, after weaning (Pluske et al. 1997a). The permeability of the small intestine is also changed in the post-weaning period (Spreeuwenberg et al. 2001). The cumulative effect of these changes has been considered to reduce digestive and absorptive capacity in vivo after weaning (Hampson 1983), with the implication that this is associated with the low levels of feed intake seen in this period. It is clear that the amount of feed eaten per se in the post-weaning period influences villous height and crypt depth (Pluske et al. 1997a; Pluske 2001), although other factors such as diet form (Pluske et al. 1996a) and specific nutrients and dietary components are also involved. In the current study, villous height was unaffected by age and weight at weaning but was higher in gilts than in males, whilst crypt depth was not influenced by age, sex, or weight at weaning. Mean villous height decreased with time after weaning and crypt depth increased with time after weaning, results also reported by Kelly et al. (1991a), and proposed by Hampson (1986) to reflect the progression towards an ‘adult-type’ gut stimulated largely by the withdrawal of sows’ milk. The heights of villi reported in this study are generally lower than those reported elsewhere for pigs killed at either 14 or 28 days of age, but crypt depths are similar to literature values. Lower villous heights in this study might have been a reflection, in part, of the 24-h fast imposed on pigs before euthanasia. However, the fast was deemed necessary to ensure that the gastrointestinal tract was free of contents to avoid any possible confounding effects caused by differences in feed intake across treatments. Maintenance of villous height and crypt depth after weaning commensurate with higher rates of liveweight gain can be achieved by stimulating pigs to eat as soon as possible after weaning, and is stimulated more by offering a milk liquid diet than a pelleted weaner diet (Pluske et al. 1996a, 1996b). Pigs offered milk liquid diets after weaning grow. J. R. Pluske et al.. faster than pigs offered a pelleted diet (Dunshea et al. 1999). However, provision of a dry solid diet on an ad libitum basis, as opposed to a milk liquid diet, fails to mitigate villous atrophy and crypt elongation after weaning, which suggests that a component of the adaptive response of digestive and absorptive function following weaning is independent of nutrient intake (Kelly et al. 1991a, 1991b: McCracken et al. 1995; Pluske et al. 1996a, 1996b). Nevertheless, it has been reported previously that pigs weaned heavier and at an older age eat more dry feed after weaning than pigs weaned lighter and at an earlier age (Dunshea et al. 2002, 2003b). This increased intake might cause a reduction in the number of days that the older/heavier pigs take to reach slaughter weight (Dritz et al. 1996). The specific activity of lactase declined whilst that of sucrase increased in the 14 days after weaning, data that are in agreement to those of Kidder and Manners (1980) and Kelly et al. (1991a) but in contrast to those of Hampson (1986). Lactase and sucrase activities were not different between weaning ages or within heavy and light pigs of the same age, and these data have not been reported elsewhere. However, absolute values vary considerably between individual studies, and the method of enzyme expression (i.e. activity per gram of mucosa, per gram of mucosal protein, or total activity) markedly influences interpretation of the results (Kelly et al. 1991a, 1991b; Pluske 2001). The decline in lactase activity occurred despite the diet containing 190 g of lactose per kg of diet. Kelly et al. (1991c) reported that in sucking piglets aged 5 weeks, the lactase activity of enterocytes continued to increase during migration up the villus, although over this period the maximal activity of lactase was expressed at decreasing distances from the junction of the crypt and villus due to the decrease in villous height that occurs with time. Nevertheless, a significant decline in total lactase activity in the small intestine occurs between 3 and 5 weeks of age often despite the presence of considerable quantities of dietary lactose. The reasons for this are not clear, but might be related to a reduction in enterocyte lifespan (Tsuboi et al. 1981, 1985), a suppression in the rate of enzyme synthesis (Kelly et al. 1991c), and (or) a 2-stage decline in the regulation of lactase expression that involves both a shortening of the time allowed for enzyme expression on the villus and an inhibition in the rate at which lactase is expressed (Smith and James 1987). Lactose digestion in the weaned pig, however, is still efficient (relative to the suckling pig) because of the increase in surface area in the small intestine that occurs following weaning (Pluske et al. 1996c). The specific activity of both enzymes was maximal at 50–75% along the small intestine, a result also reported by Kelly et al. (1991a) (Fig. 1). Maltase and glucoamylase are brush-border enzymes that hydrolyse dimeric glucose molecules derived initially from the actions of amylase on starch in the mouth and small intestine. The 3–4-fold increases recorded in the specific.
(11) Gut development in weanling pigs. activities of maltase and glucoamylase in the first 14 days after weaning are consistent with the report of McCracken (1984) and Kelly et al. (1991a), who commented that the activity of these brush-border enzymes is induced rapidly (even by 3 days post-weaning in pigs weaned at 14 days of age) provided suitable dietary substrates are provided. The diet offered to pigs after weaning contained in excess of 300 g starch per kg of diet, so it is of little surprise that the activities of these enzymes increased in this manner. Kelly et al. (1991b) reported higher total activities of maltase and glucoamylase in 14-day-old weaned pigs fed 150, 175, 205, 225, and 235 g/day on Day 1–5 after weaning, respectively, as opposed to pigs fed 0, 25, 50, 75, and 100 g/day on Day 1–5 after weaning, respectively, following weaning. These data emphasise further the importance to gut structure and function of correct nutritional and husbandry strategies that cause pigs to eat feed as soon as possible after weaning. The higher specific activities of maltase and glucoamylose in pigs weaned at 28 days of age than at 14 days of age most likely reflect the age-related increase in the activity of these enzymes in the small intestine (Kidder and Manners 1980), since pigs weaned at 28 days were not offered creep feed during lactation. Studies on the development of pancreatic secretion, as distinct from investigations into the occurrence and changes in zymogen/enzyme concentrations in pancreatic tissue, are relatively few in number. Direct comparisons between any studies are often complicated by factors such as differences between breeds and strains of pigs studied, the methods and units of measurement used for the various enzymes, experimental designs, dietary interventions, and the age of pigs at weaning (Cranwell 1995). In the current study, the activities of trypsin, amylase, colipase, and lipase were expressed per gram of pancreas in order to standardise enzyme measurements, because pancreatic weights were influenced by all factors in the study except gender (Table 3). Increased trypsin activity in pigs weaned at 28 days of age and in heavier pigs might partly explain why these pigs perform better after weaning than pigs weaned at 14 days of age or which are light-for-age (Dunshea et al. 2003a). There was no increase in the specific activity of amylase after weaning; however, Cranwell et al. (1997) showed an increase in the total activity of amylase in the pancreas with time after weaning. An increase in total activity can be caused by an increase in pancreas size (Table 3) and/or substrate induction of the enzyme arising from the intake of starch (Lindemann et al. 1986; Corring and Chayvialle 1987), much in the way that maltase and glucoamylase increase after weaning. Amylase activity per gram of pancreas was unaffected by sex, age, and weight at weaning, and so differences seen in the total activity of amylase by Cranwell et al. (1997) reflected differences in pancreas weight. Colipase and lipase activity per gram of pancreas were highest in pigs at weaning and then both decreased to a. Australian Journal of Agricultural Research. 525. constant level over the next week, a pattern that most likely reflected the lower fat content of the dry pelleted diet compared with sows’ milk. The effect of the dietary lipid concentration on lipase secretion was demonstrated by Corring and Chayvialle (1987), who showed that a 7-fold increase in lipid intake caused a 1.8-fold increase in lipase secretion from the pancreas. Cranwell et al. (1997) reported that the total activity of colipase and lipase were greatest in pigs weaned at 28 days of age and in heavier pigs, which is best explained again by the increase in pancreas size. Of interest in this study were the lower height of the villi and the lower specific activities of maltase, lactase, sucrase, trypsin, and colipase seen in boars rather than gilts. Dunshea (2001) and Dunshea et al. (2003a) have observed superior performance in gilts over boars in the post-weaning period, and it is possible that the collective influence of these enzymes caused subtle changes in digestibility and absorption that, in turn, promoted faster growth. Also, Dunshea et al. (2002) found that enzyme supplementation was more beneficial for heavy, male pigs weaned at 24 days, whereas the converse was true for the light, female pigs weaned at 14 days. Also, the response to enzyme supplementation did not become apparent until the third week post-weaning. The reasons for this are unknown but may be related to the fact that weaned gilts have a larger, more developed gastrointestinal system and greater pancreatic enzymic capacity than boars. In support, Cranwell et al. (1997) reported that the total pancreatic activity of trypsin, amylase, colipase, and lipase tended to be greater in gilts than in boars. Collectively, these data suggest that gastrointestinal function in gilts might be more developed than in boars around the time of weaning, irrespective of weaning age or weight, and that split-sex feeding practices to take advantage of this dichotomy might enhance production efficiency. In conclusion, these data highlight the general underdevelopment of pigs weaned at 2 weeks of age and in pigs weaned light-for-age at either 2 or 4 weeks. Heavier body organs, gastrointestinal organs, and accessory digestive organs after weaning, except for the spleen, presumably reflected the increase in substrates available for cellular growth as feed intake increased after weaning. Interestingly, the relative weights (% of liveweight) of the stomach and small intestine and, to a lesser extent, the caecum and colon, were greater in the light, 14-day-old weaned pigs, but these differences diminished with increasing time after weaning. In association with these increases were increases in the specific and/or total activities of maltase, glucoamylase, and sucrase in the brush-border membrane, an increase in the specific activity of trypsin, and increases in the total activities (after Cranwell et al. 1997) of all the pancreatic enzymes. These changes most likely reflected the inducible nature of these enzymes in response to the greater availability of their substrates, such as starch and protein,.
(12) 526. Australian Journal of Agricultural Research. provided in the pelleted diet after weaning. Some differences in enzyme activity and villous architecture were observed between gilts and boars, and such difference might help to explain growth differences often seen between the two sexes. Acknowledgments The authors acknowledge the financial assistance of Australian Pork Limited (formally the Pig Research and Development Corporation). These data were presented in part at the 6th Biennial Meeting of the Australasian Pig Science Association [Cranwell PD, Pierzynowski SG, Rippe C, Pluske JR, Powers GN, Campbell RG, Kerton DJ, King RH, Dunshea FR (1997). Weight and age at weaning influence pancreatic size and enzymic capacity. In ‘Manipulating pig production VII’. (Ed. PD Cranwell) p. 66. (Australasian Pig Science Association: Werribee, Vic.)] and [Pluske JR, Power GN, Cranwell PD, Pierzynowski SG, Campbell RG, Kerton DJ, King RH, Dunshea FR (1997b). Sex and age at weaning affect small intestinal histology and enzymatic capacity. In ‘Manipulating pig production VII’. (Ed. PD Cranwell) p. 67. (Australasian Pig Science Association: Werribee, Vic.)]. The technical assistance of Ms Inger Mattsson at the University of Lund is appreciated. References Borgström B, Hildebrand H (1975) Lipase and co-lipase activities of human small intestinal contents after a liquid test meal. Scandinavian Journal of Gastroenterology 10, 585–591. Corring T, Chayvialle JA (1987) Diet composition and the plasma levels of some peptides in regulating pancreatic secretion in the pig. Reproduction, Nutrition and Development 27, 967–977. Cranwell PD (1995) Development of the neonatal gut and enzyme systems. In ‘The neonatal pig: development and survival’. (Ed. MA Varley) pp. 99–154. (CAB International: Wallingford, UK) Cranwell PD, Pierzynowsk SG, Rippe C, Pluske JR, Power GN, Campbell RG, Kerton DJ, King RH, Dunshea FR (1997) Weight and age at weaning influence pancreatic size and enzymic capacity. In ‘Manipulating pig production IV’. (Ed. PD Cranwell) p. 174. (Australasian Pig Science Association: Werribee, Vic.) Cranwell PD, Tarvid I, Harrison DT, Campbell RG (1995) Weight at weaning, causes and consequences. In ‘Manipulating pig production V’. (Eds DP Hennessy, PD Cranwell) p. 174. (Australasian Pig Science Association: Werribee, Vic.) Dritz SS, Owen KQ, Nelssen JL, Goodband RD, Tokach MD (1996) Influence of weaning age and nursery diet complexity on growth performance and carcass characteristics and composition of high health status pigs from weaning to 109 kilograms. Journal of Animal Science 74, 2975–2984. Dunshea FR (2001) Sexual dimorphism in growth of sucking and growing pigs. Asian Australasian Journal of Animal Science 14, 1610–1615. Dunshea FR, Eason PJ, Kerton DJ, King RH (1999) Supplemental milk before and after weaning improves growth performance of pigs. Australian Journal of Agricultural Research 50, 1165–1170. Dunshea FR, Kerton DJ, Cranwell PD, Campbell RG, Mullan BP, King RH, Pluske JR (2002) Interactions between weaning age, weaning weight, sex and enzyme supplementation on growth performance of pigs. Australian Journal of Agricultural Research 53, 939–945.. J. R. Pluske et al.. Dunshea FR, Kerton DK, Cranwell PD, Campbell RG, Mullan BP, King RH, Pluske JR (2003a) Interactions between weaning age, weaning weight, sex, and enzyme supplementation on growth performance of pigs. Australian Journal of Agricultural Research 53, 939–945. Dunshea FR, Kerton DK, Cranwell PD, Campbell RG, Mullan BP, King RH, Power GN, Pluske JR (2003b) Lifetime and post-weaning determinants of performance indices of pigs. Australian Journal of Agricultural Research 54, 363–370. Ebner S, Schoknecht P, Reeds PJ, Burrin DG (1994) Growth and metabolism of gastrointestinal and skeletal muscle tissues in protein-malnourished neonatal pigs. American Journal of Physiology 266, R1736–R1743. Erlanson C, Fernlund P, Borgström B (1973) Purification and characterization of two proteins with co-lipase activity from porcine pancreas. Biochimica Biophysica Acta 310, 437–445. Fritz H, Hartwich G, Werle E (1966) On protease inhibitors. I. Isolation and characterization of trypsin inhibitors from dog pancreas tissue and pancreas secretion. Hoppe Seylers Z Physiology and Chemistry 345, 150–167. Gornall AG, Bardawill CJ, David MM (1949) Determination of serum proteins by means of the biuret reaction. Journal of Biological Chemistry 177, 751–766. Hampson DJ (1983) Post-weaning changes in the piglet small intestine in relation to growth-checks and diarrhoea. PhD thesis, University of Bristol. Hampson DJ (1986) Alterations in piglet small intestinal structure at weaning. Research in Veterinary Science 40, 32–40. Harrell RJ, Thomas MJ, Boyd RD (1993) Limitations of sow milk yield on baby pig growth. In ‘1993 Cornell Nutrition Conference for Feed Manufacturers’. pp 156–164. (Cornell University: Ithaca, NY) Hodge RW (1974) Efficiency of food conversion and body composition of the preruminant lamb and young pig. British Journal of Nutrition 32, 113–126. Kelly D (1985) The role of nutrition and E. coli in digestive tract development and performance of early-weaned pigs. PLD Thesis, Queens University, Belfast. Kelly D, King TP, McFadyen M, Travis AJ (1991c) Effect of lactation on the decline of brush border lactase activity in neonatal pigs. Gut 32, 386–392. Kelly D, Smyth JA, McCracken KJ (1991a) Digestive development in the early-weaned pig. I. Effect of continuous nutrient supply on the development of the digestive tract and on changes in digestive enzyme activity during the first week post-weaning. British Journal of Nutrition 65, 169–180. Kelly D, Smyth JA, McCracken KJ (1991b) Digestive development in the early-weaned pig. II. Effect of level of food intake on digestive enzyme activity during the immediate post-weaning period. British Journal of Nutrition 65, 181–188. Kidder DE, Manners MJ (1980) The level and distribution of carbohydrases in the small intestine mucosa of pigs from 3 weeks of age to maturity. British Journal of Nutrition 43, 141–153. Lindemann MD, Cornelius SG, El Kandelgy SM, Moser RL, Pettigrew JE (1986) Effect of age, weaning and diet on digestive enzyme levels in the piglet. Journal of Animal Science 62, 1298–1307. Lowry OH, Rosebrough NJ, Farr AL, Randall RJ (1951) Protein measurement with the folin phenol reagent. Journal of Biological Chemistry 193, 265–275. McCracken BA, Gaskins HR, Ruwe-Kaiser PJ, Klasing KC, Jewell DE (1995) Diet-dependent and diet-independent metabolic responses underlie growth stasis at weaning. Journal of Nutrition 125, 2838–2845. McCracken KJ (1984) Effect of diet composition on digestive development of early-weaned pigs. Proceedings of the Nutrition Society 43, 109A..
(13) Gut development in weanling pigs. Australian Journal of Agricultural Research. Mei J, Bowyer RC, Jehanli AM, Patel G, Erlanson-Albertsson C (1993) Identification of enterostatin, the pancreatic pro-colipase activation peptide in the intestine of rat: effect of CCK-8 and high-fat feeding. Pancreas 8, 488–493. Payne RW, Lane PW, Genstat 5 Committee (1993) ‘Genstat 5 Reference Manual.’ (Oxford Science Publications: Oxford, UK) Pierzynowski SG, Weström BR, Svendsen J, Karlsson BW (1990) Development of exocrine pancreas function in chronically cannulated pigs during 1–13 weeks of postnatal life. Journal of Pediatric Gastroenterology and Nutrition 10, 206–212. Pluske JR (2001) Morphological and functional changes in the small intestine of the newly-weaned pig. In ‘Gut environment of pigs’. (Eds A Piva, KE Bach Knudsen, JE Lindberg) pp. 1–27. (Nottingham University Press: Nottingham, UK) Pluske JR, Hampson DJ, Williams IH (1997a) Factors influencing the structure and function of the small intestine in the weaned pig: A review. Livestock Production Science 51, 215–236. Pluske JR, Power GN, Cranwell PD, Pierzynowski SG, Campbell RG, Kerton DJ, King RH, Dunshea FR (1997b) Sex and age at weaning affect small intestinal histology and enzymatic capacity. In ‘Manipulating pig production VI’. (Ed. PD Cranwell) p. 67. (Australasian Pig Science Association: Werribee, Vic.) Pluske JR, Thompson MJ, Atwood CS, Bird PH, Williams IH, Hartmann PE (1996c) Maintenance of villous height and crypt depth, and enhancement of disaccharide digestion and monosaccharide absorption, in piglets fed cows’ whole milk after weaning. British Journal of Nutrition 76, 409–422. Pluske JR, Williams IH, Aherne FX (1996a) Maintenance of villous height and crypt depth in piglets by providing continuous nutrition after weaning. Animal Science 62, 131–144.. 527. Pluske JR, Williams IH, Aherne FX (1996b) Villous height and crypt depth in piglets in response to increases in the intake of cows’ milk after weaning. Animal Science 62, 145–158. Smith MW, James PS (1987) Cellular origin of lactase decline in postweaned rats. Biochimica et Biophysica Acta 905, 503–506. Spreeuwenberg MAM, Verdonk JMAJ, Gaskins HR, Verstegen MWA (2001) Small intestine epithelial barrier function is compromised in pigs with low feed intake at weaning. Journal of Nutrition 131, 1520–1527. Toner MS, King RH, Dunshea FR, Dove H, Atwood CS (1996) The effect of exogenous somatotropin on lactation performance of first-litter sows. Journal of Animal Science 74, 167–172. Tsuboi KK, Kwong LK, D’Harlingue AE, Stevenson DK, Kerner JA Jr, Sunshine P (1985) The nature of maturational decline of intestinal lactase activity. Biochimica et Biophysica Acta 840, 69–78. Tsuboi KK, Kwong LK, Neu J, Sunshine P (1981) A proposed mechanism of normal intestinal lactase decline in the postweaned animal. Biochemical and Biophysical Research Communications 101, 645–652. Williams IH (1995) Sow milk as a major nutrient source before weaning. In ‘Manipulating pig production IV’. (Eds DP Hennessy, PD Cranwell) pp. 107–113. (Australasian Pig Science Association: Werribee, Vic.). Manuscript received 13 September 2002, accepted 27 February 2003. http://www.publish.csiro.au/journals/ajar.
(14)
Figure


+2

Documents relatifs
Assessment of domestic pigs, wild boars and feral hybrid pigs as reservoirs of hepatitis E virus in Corsica, France.. Ferran Jori, Morgane Laval, Oscar Maestrini, François
The increase in predictive ability from using a social genetic effects model compared to a classical animal model was only significant for gilts in the univariate
In this study we have developed a tool which can be used to provide growth alarms at individual level (identified pigs) and batch level (identified or unidentified pigs)..
Development of gender stereotypes relative to sport competence and value during adolescence.. Julie Boiché 1,2 Aïna Chalabaev 3 Philippe Sarrazin
Although it is very likely that reproductive skipping exists in a long-lived species such as the Greater Fla- mingo, we tested but did not retain the specific hy- pothesis that
In trial A, to investi- gate the variations of average daily gain (ADG), weight and blood variables around weaning, only data collected from 9 days before to 19 days after weaning
L’archive ouverte pluridisciplinaire HAL, est destinée au dépôt et à la diffusion de documents scientifiques de niveau recherche, publiés ou non, émanant des
ANOVAs were carried out on the effects of participants’ sex (2) and age (3) for all the evaluations concerning female drivers: driving skills, courtesy behind the wheel, compliance
