Adding Value to Test-Day Data by Using Modified Best Prediction
Method
A. Gillon
1, S. Abras
2, P. Mayeres
2, C. Bertozzi
2and N. Gengler
1,31
Animal Science Unit, Gembloux Agro-Bio Tech, University of Liege, Passage des Déportés 2,
5030 Gembloux, Belgium
2
Walloon Breeding Association, Rue des Champs Elysées 4, 5590 Ciney, Belgium
3National Fund for Scientific Research, Rue d’Egmont 5, 1000 Brussels, Belgium
Abstract
Computation of lactation yields from test-day data has lost much of its importance for genetic evaluations as the use of test-day models is currently quite widespread. In the other hand its interest for intra-farm management is increasing as a base for advanced management tools. The first and principal aim of this study was to develop a method which takes into account advantages and disadvantages of existing methods, and to test its potential to provide useful management tools to dairy farmers. A test-day model with modifications to able daily run and management tools was developed. Because of its similarities with best prediction, the method developed here was called modified best prediction. The second objective was to compare the accuracy of this new method with best prediction and test interval methods. Modified best prediction showed good results for predicting daily yields and was slightly better than best prediction for lactation yields prediction. Management tools obtained with modified best prediction are explained.
Keywords: lactation yields computation, modified best prediction, test-day model, management tools.
1.0 Introduction
Milk performance recording and computing of lactation yields from test-day yield data had historically two main purposes: intra herd management and genetic evaluation. The last one is often the main reason to do milk recording, however the desire of assessing precisely phenotypic performances of dairy cows was at the origin of milk recording. As the use of test-day models is currently quite widespread, lactation yields computation for genetic evaluations has lost much of its importance. At the same time, its interest for intra-farm management has increased because farms are getting larger and economic sustainability is more and more difficult to achieve.
The official method recommended by ICAR (2009) to compute lactation yields is the test interval method (TIM). This method connects test-day data using linear interpolation between them. Over the years, alternative methods for computing cumulated productions were developed and approved by ICAR. These methods are interpolation using standard lactation curves (Wilmink, 1987), multiple trait prediction (MTP, Schaeffer and Jamrozik, 1996) and best prediction (BP; VanRaden, 1997). MTP combines, using a Bayesian method, the a priori knowledge on standard lactation curve and the observed data. BP combines recorded yields into a lactation record using selection index procedures, therefore it has best linear prediction properties. BP is more accurate than TIM but less accurate than the simultaneously equations as provided by BLUP (Pool and Meuwissen, 1999).
Furthermore, several authors have shown the potential for calculating cumulated production with test-day models (TDM). Pool and Meuwissen (1999), Mayeres et al. (2004), and Vasconcelos et al. (2004) reported the ability of a TDM to predict daily and lactation yields. Mayeres et al. (2004), Koivula et al. (2007), and Caccamo et al. (2008) showed the interest of using a TDM to bring useful management tools to dairy farmers. However full, population wide TDM require important computations resources. They are therefore performed on schedules, e.g., three times a year for the INTERBULL international genetic evaluations. This reduces their direct usefulness as farmers need lactation yields and other management results a few days after milk recording.
The aim of this study was first to develop a new method which takes into account advantages and disadvantages of existing methods, is applicable on the field, and brings useful management tools. The
second objective was to test the ability of this new method to describe and predict daily and lactation yields.
2.0 Materials and Methods
2.1 Data
Data available in this study were 21,839,073 test-day data (milk, fat, protein, and somatic cell count) coming from milk recording in Walloon region of Belgium and collected between January 1980 and March 2010. These data included all lactations and all dairy breeds, including dual purpose breeds. Pedigree and lactation data were also provided.
Additional data consisting in daily individual milk yields were collected in 8 herds. After editing, 132,607 daily production records, from 562 lactations, 312 cows and 4 herds were kept.
2.2 Model
Because of its similarities with BP, the method developed here was called modified-BP (mBP). However, some elements of others methods have been included.
The mBP method has the following properties:
- multiple-trait computation (milk, fat and protein yields, somatic cell score); - (co)variances are supposed to be known and constant;
- standard lactation curves account for general pattern of lactation curve within breed and age at calving classes, year of production within herd, season of production within herd, herd deviation from general pattern of lactation curve, and genetic value of the cow.
The main differences between mBP and BP are the definition of the standard lactation curves and the inclusion of individual genetic value. In order to minimize bias, components of standard lactation curves specific to the herd are computed jointly with random individual effect. Components of standard lactation curves obtained using the whole population (i.e. genetic values and general pattern of lactation within breed, age at calving and parity) are not recomputed each time but extracted from databases. If a cow moves from one herd to another during its lactation, standard lactation curves components specific to the herd are changed at the time of transfer. The inclusion of genetic effects is important for predicting daily yields when lactation is in progress if a cow is genetically more or less persistent than population average.
Among possible implementations of this method, we choose to use a multi-trait multi-lactation random regression TDM that allowed direct joint estimation of fixed and random effects. Data were pre-corrected for population level effects in order to make possible a daily run at herd level. Therefore, mBP could be located between BP and population-wide TDM with BLUP properties integrating ideas about distributed computing and sequential solving (Gengler et al., 2000). Classical fixed herd x test-day effect was replaced by three herd effects to enable herd-management prediction following Mayeres et al. (2004). These three effects are a fixed herd x test year effect, a fixed herd x test month x period of 5 years effect, and a random herd x test-day effect. These three herd effects reflect evolution of herd management level, corrected for lactation stage, age at calving, parity, and genetics.
The global model could be written as follows:
e
Za
Zp
Wh
Tt
Xβ
y
=
+
+
+
+
+
Where:- is the vector of observations (milk, fat and protein yields, somatic cell score);
y
- is the vector of fixed effects:
β
- herd x test year,
- herd x test month x 5 year period; - is the vector of random herd x test-day effect;
t
- is the vector of herd x year of calving random regression coefficients;
h
- is the vector of permanent environmental random regression coefficients;
p
- is the vector of genetic additive random regression coefficients (data are pre-corrected for this effect);
a
- is the vector of residuals;
e
-
X
,T
,W
and are incidence matrices assigning observations to effects.Z
Herd x year of calving random regression effect was not used for somatic cell score modelling.
Finally a variant of this method was tested. This variant contains integration of expectations of constant animal effects to observed average values using a Bayesian prediction approach. The Bayesian method is similar to the MTP method, only avoiding expectations about lactation shape curves. This approach was called mBPb. Using this variant, the expected value of the residuals in a given lactation for a given animal was forced to be zero. The reason for the development of this alternative method was that with standard mBP, expected value of the residuals is only zero by herd. The consequence is that predicted curves could not reflect the observed records of extreme cows compared to the average animal in this herd.
(Co)variances estimations were obtained from REML and Gibbs sampling (Misztal, 2009).
2.3 Validation
In order to validate mBP, adjustment quality and prediction ability were studied. Adjustment quality is the difference between observed records used for solving the model and predicted values for these test-days. Prediction ability is the ability of the model to predict values of the following test-day. mBP and mBPb were run for 400 herds. Data of last available test-day were set to zero. All records needed for running mBP and mBPb were used to assess the adjustment quality of the model; and daily predictions for the last available test-date were used to assess the prediction ability of the model. Mean error, mean square error and correlations were computed for these two parameters.
Lactation yields prediction was also estimated. To match as much as possible to the reality, official test-day records were simulated, using actual daily production and respecting the schedule of conditions and the characteristics of the Walloon situation:
- each herd had the probability of 87 percent to be simulated in a A4 test plan and 13 percent to be simulated in a A6 plan;
- time between two tests was between 22 and 37 days (A4) or between 38 and 53 days (A6). To make test interval longer, each test-day had also 1 percent of probability to be cancelled;
- corresponding to the current practice, tests were not done in July for A4 plan; - first test of the lactation had to be performed after the fourth day in milk.
A total of 200 simulations were done. Using these simulated test-day data, mBP, mBPb, BP and TIM lactations yields were computed and compared to the real ones. When real daily milk yields were missing, predictions for these days were not taken into account for mBP, mBPb, BP and TIM lactation yields calculation. For each method, mean, standard deviation, relative bias and correlation with actual lactation yields were computed on overall data set, by parity, and by test plan.
BP method was official best prediction program downloaded on AIPL website. To allow comparison with mBP, data were pre-corrected for parity x age at calving x breed, and standard lactation curves accounted for herd x season of calving.
Lactation yields prediction when lactation is in progress was also studied. The method was similar but only 25 simulations were done. For each simulation, 11 data sets were created: the first one contained only first test-day records; the second one contained only first and second test-day records, and so on. Each 305-d lactation yields prediction was compared to the real one for each data set.
3.0 Results and Discussion
3.1 Lactation curve modelling and herd means
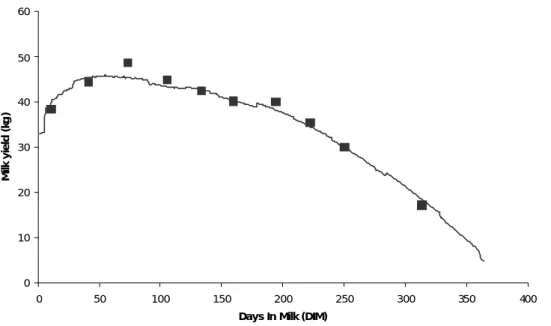
As described before mBP is a method to compute daily and lactation yields, but it also can compute management tools such as evolution of herd effects, peak yield and persistency. This method can be run daily herd by herd, and farmers can receive results a few days after milk recording. Figure 1 shows milk yields modelled with mBP method from an ended lactation. Prediction of entire lactation with four test-day records is shown on Figure 2. The inclusion of genetic effects in lactation curve allows to take into account genetic persistency of a cow, in addition to average persistency of the herd (explained by herd x year of calving effect) and of the breed (explained by class of 5 DIM x class of breed x class of age at calving effect). 0 10 20 30 40 50 60 0 50 100 150 200 250 300 350 400
Days In Milk (DIM)
M ilk y ie ld ( kg )
Figure 1. Illustration of the modelling of a lactation by modified-best prediction (mBP) method ( test day record; —mBP modelling).
0 5 10 15 20 25 30 35 0 50 100 150 200 250 300 350 400
Days In Milk (DI M)
M ilk ( k g )
Figure 2. Prediction of the entire lactation with four test day records by modified-best prediction (mBP) method ( test day record; — mBP modelling).
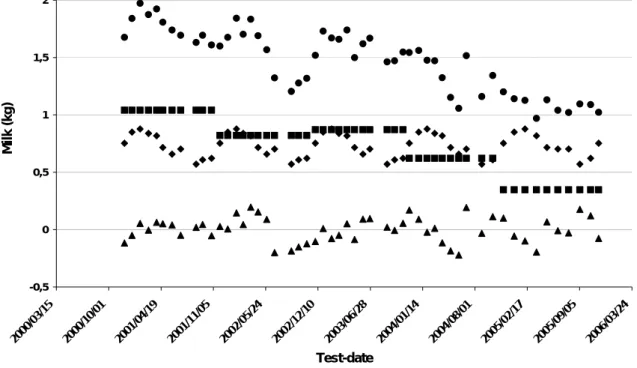
As in Mayeres et al. (2004) a modification of classical fixed herd x test-date effect was done in order to predict herd effects for each day of the lactation. Figure 3 shows evolution of these three effects for a particular herd. Herd x test year effect shows a regular decrease of management level over the years. Herd x test month x period of 5 years effect shows seasonal variation of management level inside years. And herd x test-day effect includes the part of the herd variation that is not explained by the two previous effects. Sum of these three effects shows the general evolution of herd management, which is decreasing in this particular herd. General decrease can be explained by an extensification of farming practices and seasonal variation by period of grazing or seasonal feeding. But if these variations can not be explained, results indicate management problems that need to be identified and solved. These herd management level indicators are corrected for lactation stage, breed, age at calving, and genetic, so interpretation of these values is more accurate than interpretation of raw yields. Similarly to Koivula et al. (2007), values of random herd x test day effect reflects difference between predicted and observed values for herd management. No thresholds to detect management problems have been tested so far. Herd x calving year random regression could also be plotted as done by Caccamo et al. (2008).
-0,5 0 0,5 1 1,5 2 2000/ 03/ 15 2000/ 10/ 01 2001/ 04/ 19 2001 /11/ 05 2002/ 05/ 24 2002/ 12/ 10 2003/ 06/ 28 2004/ 01/ 14 2004/ 08/ 01 2005 /02/ 17 2005/ 09/ 05 2006/ 03/ 24 Test-date M ilk ( k g )
Herd x Year Herd x Month x 5 year Herd x Test-day Sum
Figure 3. Evolution of herd solutions for a particular herd.
3.2 Validation
Adjustment quality was analyzed for mBP and mBPb methods. Table 1 shows results for parity one. Results were similar for other parities. Adjustment quality is the difference between available records and predicted values for these test-days. As shown in Table 1 mean error is null, mean square error is small and correlations are high, ranging from 0.85 for somatic cell score to 0.95 for milk yields. The two methods showed similar results. Prediction ability is shown in Table 2 for first parity. Prediction ability is the ability to predict values of the following test-day. The mBPb method was inferior to mBP in its ability to predict yields of following test-day. This result was not unexpected as in mBPb the prediction is centred on the already observed values for a given cow. Further results given in Table 3 will show that this issue disappears when more test-days become available.
Table 1. Adjustment quality for mBP and mBPb methods in first parity.
mBP mBPb
Trait N
ME1 MSE2 Corr.3 ME1 MSE2 Corr.3
Milk (kg) 651,266 0.00 4.28 .95 0.00 4.17 .95
Fat (kg) 651,266 0.00 0.01 .92 0.00 0.01 .92
Protein (kg) 651,266 0.00 0.01 .93 0.00 0.01 .94
SCS 556,791 0.00 0.70 .85 0.00 0.68 .85
1 ME: mean error
2 MSE: mean square error
3 Corr.: correlation between observation and prediction
Table 2. Prediction ability for mBP and mBPb methods in first parity.
mBP mBPb
Trait N
ME1 MSE2 Corr.3 ME1 MSE2 Corr.3
Milk (kg) 7,368 -0.09 12.37 .87 -1.73 29.47 .75
Fat (kg) 7,368 0.00 0.03 .83 -0.06 0.06 .69
Protein (kg) 7,368 0.01 0.01 .85 -0.07 0.03 .72
SCS 6,233 0.00 1.70 .57 -0.22 2.31 .49
1 ME: mean error
2 MSE: mean square error
3 Corr.: correlation between observation and prediction
Simulation of fictive test-day yields was done with real daily milk yields in order to maximize situations that can be present in reality. Lactations yields were computed using 5 methods: real yields, mBP, mBPb, BP, and TIM. For each method, mean and standard deviation were reported. Relative bias and correlation with real productions were also computed. For lactation yields description (when lactation is finished), analyse was done per parity and per data collecting plan. For lactation yields prediction (when lactation is in progress), analyse was done by number of available tests. Table 3 shows that mBP method was the best method even if differences were quite small. BP had higher relative bias for first parity. Additional study has to be made to see if it can be explained by production level. After 3 tests, lactation yields were predicted with high precision: relative bias was smaller than 1 percent and correlations were higher than .90 with mBP and mBPb methods. With BP, this level of precision was reached after 5 available tests.
Table 3. Lactation yields prediction when lactation is terminated (description) and when lactation is in progress (prediction) for 4 methods: mBP, mBPb, BP, and TIM, compared with real lactation yields.
Mean std Mean std r.bias1Corr.2 Mean std r.bias1Corr.2 Mean std r.bias1 Corr.2 Mean std r.bias1Corr.2
DESCRIPTION all 80200 7230 1930 7227 1917 -0.04 0.991 7235 1949 0.07 0.990 7077 1927 -2.12 0.985 7254 1951 0.33 0.990 by parity lact=1 26600 6361 1352 6361 1364 0.00 0.985 6369 1383 0.13 0.985 6012 1200 -5.49 0.979 6376 1382 0.24 0.984 lact=2 17600 7348 1853 7356 1849 0.11 0.990 7363 1880 0.20 0.990 7217 1775 -1.78 0.987 7385 1883 0.50 0.990 lact=3 15600 7986 2182 7962 2176 -0.30 0.991 7974 2217 -0.15 0.991 7946 2177 -0.50 0.991 8000 2205 0.18 0.990 lact=4 10000 8036 1999 8029 1970 -0.09 0.990 8050 2000 0.17 0.989 8045 1993 0.11 0.989 8086 2004 0.62 0.988 lact=5 4800 8157 1877 8128 1823 -0.36 0.986 8148 1878 -0.11 0.987 8137 1865 -0.25 0.988 8176 1890 0.23 0.987 lact=6 + 5600 6643 1730 6677 1673 0.51 0.988 6644 1717 0.02 0.988 6631 1673 -0.18 0.987 6655 1718 0.18 0.988 by data collection plan
A4 69774 7230 1930 7229 1917 -0.01 0.991 7236 1948 0.08 0.991 7080 1928 -2.07 0.986 7253 1950 0.32 0.991 A6 10426 7230 1930 7213 1912 -0.24 0.988 7225 1955 -0.07 0.987 7054 1924 -2.43 0.982 7256 1958 0.36 0.987
PREDICTION
number of available tests
1 3179 7716 1833 7489 1670 -2.94 0.907 7373 2343 -4.45 0.811 7731 1954 0.19 0.838 - - - -2 5638 7556 1889 7449 1800 -1.42 0.934 7466 2308 -1.19 0.884 7786 2030 3.04 0.896 - - - -3 6271 7473 1861 7436 1852 -0.50 0.948 7509 2216 0.48 0.920 7653 1989 2.41 0.923 - - - -4 6695 7292 1867 7272 1877 -0.27 0.960 7345 2136 0.73 0.943 7368 1962 1.04 0.942 - - - -5 7603 7117 1904 7101 1910 -0.22 0.974 7160 2085 0.60 0.966 7114 1976 -0.04 0.962 - - - -6 7211 7272 1878 7248 1863 -0.33 0.979 7299 1989 0.37 0.975 7213 1919 -0.81 0.968 - - - -7 6842 7462 1958 7438 1936 -0.32 0.985 7482 2033 0.27 0.983 7376 1989 -1.15 0.977 - - - -8 6066 7602 1908 7566 1882 -0.47 0.988 7595 1947 -0.09 0.987 7484 1919 -1.55 0.981 - - - -9 5267 7745 2082 7720 2067 -0.32 0.992 7742 2122 -0.04 0.991 7610 2114 -1.74 0.986 - - - -10 3701 7639 2024 7613 2006 -0.34 0.992 7626 2042 -0.17 0.992 7455 2024 -2.41 0.987 - - - -11 2656 7816 2110 7786 2083 -0.38 0.993 7803 2116 -0.17 0.992 7624 2135 -2.46 0.988 - - - -1
Relative bias (%) = (mean - real mean)*100 / real mean 2
Correlations between real and predicted lactation yields
BESTPRED T IM
305-d lactation yields
N Real mBP mBPb
4.0 Conclusions
The new proposed method called mBP is a daily and lactation yields computation method based on TDM that can bring management tools such as evolution of management level, peak yield and persistency. This method can be run daily herd by herd, and farmers can receive results a few days after milk recording. Validation showed that mBP was better than mBPb, that was developed to solve issues with extreme cows, and BP but differences were small. Possible management tools can be directly deduced from results that are potentially very useful tools to dairy farmers.
5.0 Acknowledgments
The authors gratefully acknowledge financial support of the Ministry of Agriculture of the Walloon Region of Belgium [Service Public de Wallonie, Direction générale opérationnelle “Agriculture, Ressources naturelles et Environnement”, projets 2732, 2733 et D31-1207], help from John Cole (AIPL-ARS-USDA) in the installation and parameterisation of best prediction, and manuscript review by Catherine Bastin (Gembloux Agro-Bio Tech, University of Liege, Belgium). The first author and Nicolas Gengler, research associate at the National Fund for Scientific Research (Brussels, Belgium), acknowledge the financial support provided by the National Fund for Scientific Research through grants F.4552.05 and 2.4507.02 F for processing facilities.
6.0 References
Caccamo M., Veerkamp R. F., de Jong G., Pool M. H., Petriglieri R., and Licitra G.. 2008. Variance components for test-day milk, fat, and protein yield, and somatic cell score for analyzing management information. J. Dairy Sci. 91:3268-3276.
Gengler N., Tijani A., and Wiggans G. R. 2000. Use of sequential estimation of regressions and effects on regressions to solve large multitrait test-day models. J Dairy Sci. 83: 369 (online-only: http://jds.fass.org/cgi/data/83/2/369/DC1/1).
ICAR. 2009. International agreement of recording practices. Available on www.icar.org
Koivula M., Nousiainen J. I., Nousiainen J., and Mäntysaari E. A.. 2007. Use of herd solutions from a random regression test-day model for diagnostic dairy herd management. J. Dairy Sci. 90:2563-2568. Mayeres P., Stoll J., Bormann J., Reents R., and Gengler N.. 2004. Prediction of daily milk, fat, and protein production by a random regression test-day model. J. Dairy Sci. 87:1925-1933.
Misztal, I. 2009. BLUPF90 family of programs. University of Georgia. http://nce.ads.uga.edu/~ignacy/numpub/blupf90
Pool M. H. and Meuwissen T. H. E.. 1999. Prediction of daily milk yields from a limited number of test days using test day models. J. Dairy Sci 82:1555-1564.
Schaeffer L. R. and Jamrozik J.. 1996. Multiple-trait prediction of lactation yields for dairy cows. J. Dairy Sci. 79:2044-2055.
VanRaden P. M.. 1997. Lactation yields and accuracies computed from test day yields and (co)variances by best prediction. J. Dairy Sci. 80:3015-3022.
Vasconcelos J., Martins A., Petim-Batista M. F., Colaço J., Blake R. W., and Carvalheira J.. 2004. Prediction of Daily and lactation yields of milk of milk, fat, and protein using an autoregressive repeatability test day model. J. Dairy Sci. 87:2591-2498.
Wilmink J. B. M.. 1987. Comparison of different methods of predicting 305-day milk yield using means calculated from within-herd lactation curves. Livest. Prod. Sci. 17:1-17.