Soil microarthropod communities from Mediterranean forest
ecosystems in Central Italy under different disturbances
Silvia Blasi&Cristina Menta&Lorena Balducci&Federica Delia Conti&Enrico Petrini& Gianluca Piovesan
Received: 29 August 2011 / Accepted: 23 April 2012 / Published online: 15 May 2012 # Springer Science+Business Media B.V. 2012
Abstract The aim of this study is to assess soil qual-ity in Mediterranean forests of Central Italy, from evergreen to deciduous, with different types of man-agement (coppice vs. high forest vs. secondary old growth) and compaction impacts (machinery vs. rec-reational). Soil quality was evaluated studying soil microarthropod communities and applying a biologi-cal index (QBS-ar) based on the concept that the higher is the soil quality, the higher will be the number of microarthropod groups well adapted to the soil habitat. Our results confirm that hardwood soils are characterised by the highest biodiversity level among
terrestrial communities and by a well-structured and mature microarthropod community, which is typical of stable ecosystems (QBS value, >200). While silvicul-tural practices and forest composition do not seem to influence QBS-ar values or microarthropod communi-ty structure, the index is very efficient in detecting soil impacts (soil compaction due to logging activities). Several taxa (Protura, Diplura, Coleoptera adults, Pauropoda, Diplopoda, Symphyla, Chilopoda, Diptera larvae and Opiliones) react negatively to soil compac-tion and degradacompac-tion (QBS value, <150). In particular, Protura, Diplura, Symphyla and Pauropoda, are taxo-nomic groups linked to undisturbed soil. This index could also be a useful tool in monitoring soil biodi-versity in protected areas and in urban forestry to prevent the negative effects of trampling. QBS-ar is a candidate index for biomonitoring of soil microarthro-pod biodiversity across the landscape to provide guid-ance for the sustainable management of renewable resource and nature conservation.
Keywords Soil fauna . Soil disturbance . Forest management . Biological
index . Microarthropods . Soil monitoring
Introduction
Monitoring ecosystem components plays a key role in acquiring basic data to assess the impact of land man-agement systems and to plan resource conservation. DOI 10.1007/s10661-012-2657-2
Electronic supplementary material The online version of this article (doi:10.1007/s10661-012-2657-2) contains
supplementary material, which is available to authorized users.
S. Blasi
:
L. Balducci:
E. Petrini:
G. Piovesan (*)DendrologyLab,
DAFNE, Università degli Studi della Tuscia, Via S. C. de Lellis,
01100 Viterbo, Italy e-mail: piovesan@unitus.it
C. Menta
:
F. D. ContiDepartment of Evolutionary and Functional Biology, University of Parma,
Strada Farini 90, 43100 Parma, Italy
L. Balducci
Département des Sciences Fondamentales, University of Quebec in Chicoutimi,
555, boulevard de l’Université,
Maintaining soil quality is of the utmost importance to preserve biodiversity and sustainable management of renewable resources. However, the study of soil com-munities is still in an early stage and information on diversity of soil animals is actually very sparse with a few studies regarding the patterns of soil biodiversity across the landscape (Bardgett2002; Callaham et al. 2006). There is a compelling need for establishing a set of bioindicators and indexes to understand propri-eties and monitor changes in the soil organisms. The research challenge is to select biomonitors in situ for a wide range of environmental factors that re-spond to deteriorating or improving habitat quality linked to changing patterns of land use (Hodkinson and Jackson 2005; Ruf et al. 2003).
Soil properties determine ecosystem function and vegetation composition/structure, serve as a medium for root development, and provide moisture and nutrients for plant growth (Minnesota Forest Resour-ces Council 1999). Disturbances linked to natural forces and to human activities can alter physical, chemical and biological properties of soils which can, in turn, impact long-term productivity (Burger and Zedaker 1993; Gupta and Malik 1996). Human activities alter the quantity and quality of detritus availability and the chemical–physical properties of microhabitats that influence microarthropods, most of which are sedentary and unable to respond spatially and temporally to soil property changes (Bird et al. 2000).
Soil quality is defined here as the capacity of a specific kind of soil to function, within natural or managed ecosystem boundaries, to sustain plant and animal productivity, maintain or enhance water and air quality and support human health and habitation (Doran and Parkin 1994; Karlen et al. 1997). It can be evaluated through chemical–physical properties (e.g. granulometry, organic matter, heavy metals) and biological indicators. Biotic indices, based on inverte-brate community studies, were recently developed as a promising tool in soil-quality monitoring (Cassagne et al.2004; Deleporte1981; Guinchard and Robert1991; Menta et al. 2008; Paquin and Coderre 1997; Parisi 2001; Parisi et al.2005). Soil invertebrates are a fun-damental component of soil ecosystems, playing an important role in breaking down organic matter, regu-lating the recycling of nutrients, controlling the activ-ity of microflora and developing soil structure (Lebrun 1987; Radea and Arianoutsou 2002; Rusek 1985;
Toutain 1987). These organisms are highly sensitive to natural and human disturbances (Deleporte 1981; Hogervorst et al.1993; Paoletti and Hassall1999) and are increasingly being recognised as a useful tool for assessing soil quality.
Various studies have described the structure of soil invertebrate communities in relation to forest diversity, dynamics and management (Bird et al.2000; Doblas-Miranda et al. 2007; Hedde et al. 2007; Jabin et al. 2004; Kaneko and Salamanca 1999; Paquin and Coderre1997; Theenhaus and Schaefer1995). Over-exploitation generally results in dramatic and rapid changes in vegetation and soil quality that are likely to significantly affect soil invertebrate communities and, more in general, forest goods and services (Minnesota Forest Resources Council 1999).
The aim of this study is to assess soil quality in various Mediterranean forests of Central Italy, from evergreen to deciduous, with different types of man-agement (e.g. coppice vs. high forest). Soil quality was analysed through a biological index, the QBS-ar, based on the concept that the higher the soil quality, the higher will be the number of microarthropod groups adapted to the soil habitat (Gardi et al.2008; Menta et al.2008; Parisi et al.2005). Particular atten-tion was focused on stands with different levels of soil compaction, due to harvesting methods, grazing and recreation. In cases of multiple use forests (e.g. wood, pasture and recreation), such as the Mediterranean landscape, soil compaction can deeply alter edaphic fauna microhabitat and vegetation productivity. Since compaction produces a decrease in soil porosity and water retention, it is a target impact that needs to be monitored and managed in Mediterranean resource planning.
Materials and methods
Study area description
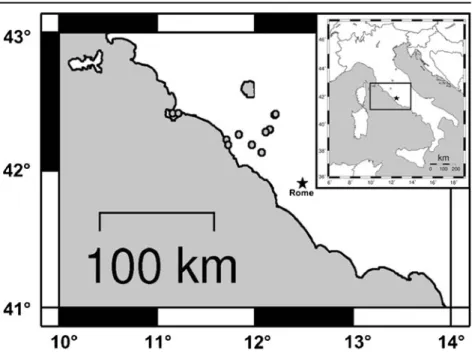
A total of 11 forest areas of Central Italy (Regions— Lazio, Toscana; Provinces—Viterbo, Roma and Grosseto; Fig.1) were selected along an altitudinal gra-dient from 3 to 1,045 m above sea level (Fig.2). They are referred to as five compositional type (coenosis), and each one is dominated by Fagus sylvatica (beech); Castanea sativa (chestnut); Quercus cerris (Turkey oak) and Quercus pubescens (downy oak); Quercus ilex
(holm oak); and Pinus pinea (umbrella pine). Apart from vegetation composition/successional stages, the forest stands differ by forest manage-ment and type of disturbance (Table 1; detailed site description in the Electronic supplementary material (ESM)). In every forest stand, a variable number of sampling plots were chosen in relation to the specific disturbance studied; soil plots were considered impacted by tractor (with either tires or tracks), tourists (recreational use or tourist trampling) or animals when heavy marks of soil disturbance were present at the time of sampling.
Soil sampling, microarthropods extraction and QBS-ar index application
Each plot consisted of a square (10×10 m) with ho-mogeneous forest cover, slope, exposure and pedolo-gy. Along the plot diagonals, three 1,000-cm3 soil samples were taken. Microarthropods were extracted from each sample with a Berlese–Tüllgren funnel (for detailed explanation, see theESM). The microarthro-pod community was identified to order level using a stereo microscope. Soil biological quality was expressed using the QBS-ar index (Parisi et al. Fig. 1 Map showing the
locations of soil sampling sites 0 10 20 30 40 50 60 0 200 400 600 800 1000 1200 Sea Distance (km) Al ti tu d e ( m )
Holm oak coppice
Turkey-Downy oak coppice Turkey oak coppice
Turkey oak stored coppice
Turkey oak high forest High beech forest Old-growth beech forest
Chestnut coppice
Planted umbrella pine Planted umbrella pine
Fig. 2 Distribution of sam-ple plots along an altitudinal gradient from the coast to the mountains
T able 1 Geographical and stand characteristics of sample plots Forest type Municipality Latitude (N) Longitude (E) Sampling dates Sampling plots Soil disturbance a Maximum tree height (m) T ree age (years) Litter thickness (cm) Bedrocks Old-growth beech forest Soriano nel Cimino (VT) 42°24 ′24 ″ 12°12 ′10 ″ 28/04/08 and 16/09/08 9 b T ractor (1), natural gap (2) 35 –47 >200 1– 7 V olcanic Beech high forest Ronciglione (VT) 42°18 ′13 ″ 12°08 ′59 ″ 15/04/08 2 2 5– 30 ~150 4– 8 V olcanic Chestnut coppice with standards Soriano nel Cimino (VT) 42°24 ′51 ″ 12°12 ′13 ″ 08/05/08 and 16/09/08 6 b Recently coppiced (3) 25 2– 25 1– 8 V olcanic T urkey oak stored coppice T olfa (RM) 42°1 1′ 12 ″ 1 1°57 ′52 ″ 02/03/07, 12/03/07, 16/03/07 and 07/1 1/07 13 b T ractor (3), recently coppiced (6) 18 36 4– 7 V olcanic T urkey oak high forest V etralla (VT) 42°17 ′01 ″ 12°06 ′16 ″ 15/04/08 2 b 30 –35 ~150 2– 5 V olcanic T urkey oak coppice with standards Canale Monterano (RM) 42°08 ′05 ″ 12°04 ′14 ″ 16/05/08, 22/10/07 and 24/10/07 11 b Over grazing (1), recently coppiced (8) 10 3– 22 3– 6 V olcanic T urkey –downy oak coppice with standards T arquinia (VT) 42°15 ′41 ″ 1 1°49 ′57 ″ 04/06/08 2 b 15 –20 22 5– 7 Sedimentary Holm oak coppice Orbetello (GR) 42°24 ′55 ″ 1 1°09 ′30 ″ 1 1/12/07 1 1 5 ~15 4 Sedimentary Planted umbrella pine Orbetello (GR) 42°25 ′03 ″ 1 1°13 ′12 ″ 1 1/12/07 3 Recreational use (3) and sea ef fect (1) 25 84 2– 4 Sedimentary (sand) Planted umbrella pine T arquinia Lido (VT) 42°13 ′28 ″ 1 1°42 ′21 ″ 04/06/08 and 16/06/08 3 b Recreational use (1) 10 –25 ~50 1– 3 Sedimentary Planted umbrella pine San Giorg io, T arquinia (VT) 42°1 1′ 20 ″ 1 1°43 ′22 ″ 04/06/08 and 16/06/08 3 b Recreational use (2) and sea ef fect (2) 10 24 –35 1– 3 Sedimentary (sand) Every stand is identified by the average of geographic coordinates of sampling plots VT V iterbo, RM Roma, GR Grosseto a A sampling plot can be af fected by more than one type of disturbance b The site was sampled for physical –chemical soil analyses
2005). Soil organisms are separated into biological forms according to their morphological adaptation to soil environments; each of these forms is associated with a score named eco-morphological index (EMI), which ranges from 1 to 20 in proportion to the degree of adaptation (Tab. S1 in theESM). The QBS-ar index value is obtained from the sum of the EMI of all collected groups. If in a group, biological forms with different EMI scores are present, the higher value (more adapted to the soil form) is selected to represent the group in the QBS-ar calculation. This index was applied in very different studies, primarily in Italy, where it was conceived (see previous QBS-ar applica-tion in theESM), but this study is the first example of a systematic forest monitoring across an entire region. Physical–chemical analyses (dry weight, per cent of water, bulk density, texture, pH and organic matter) were carried out on a subsample of plots representative of the network (Table 1) to investigate the effect of such factors on microarthropods biodiversity.
Statistical analysis
Data were analysed using a combination of univariate and multivariate techniques. Statistical analyses were performed using the PAST program, ver. 1.34 (Hammer et al. 2001).
In order to identify community gradients, a princi-pal component analysis (PCA) (Davis 1986; Harper 1999) was carried out on a rectangular matrix (samples plot×taxa) of EMI data. A bootstrap resampling tech-nique with 1,000 replicates was employed to evaluate the number of informative axes (Jackson1993). The significance of eigenvector coefficients was evaluated by determining whether their 95 % confidence limits— extracted from bootstrap analysis—overlapped zero. Eigenvectors were then considered informative if at least two variables were significant on that axis. Before carrying out the analysis, we removed the taxa Acari and Collembola, which were present in all samples and represented by the maximum EMI value (20). In order to eliminate redundant data, PCA was performed on a matrix of EMI data excluding taxa, as Dermaptera and Blattaria, with frequency of <5 %, and taxa, as Thysanoptera, Hemiptera, Psocoptera and Diptera (adults), con-tributing less than 2 % to QBS-ar value.
To verify differences of soil quality and of micro-arthropod community structure among disturbed/
undisturbed areas, dry season, types of forest manage-ment, forest composition and localities, a Kruskal– Wallis test (K-W; Zar 1996) and a non-parametric MANOVA (Anderson2001) was carried out on QBS-ar index values and on the EMI data matrix respectively. The K-W statistic is corrected for ties. The Non-Para-metric MANOVA (NPMANOVA) is based on a Bray– Curtis distance applied on EMI data matrix. When dif-ferences in community structure were significant (p< 0.05), a post hoc test was used to compare two by two the different group of samples; the significance level of this comparison was corrected according to Bonferroni (1935,1936). The taxa contributing most to dissimilar-ity among group of samples were checked using the similarity percentage procedure SIMPER (cut off, ≈70 %, Clarke1993) adopting the Bray–Curtis measure. Results
Microarthropod communities
A total of 26 microarthropod groups belonging to the Chelicerata and Mandibolata subphyla were recov-ered. The Chelicerata subphylum was represented by: Araneae, Pseudoscorpiones, Palpigrada, Opiliones and Acari. The Mandibolata subphylum included Isopoda (1 taxon) and Tracheata (20 taxa). The Acari and the Collembola were gathered in every sampling plot with an EMI value equal to 20. Chilopoda, Hymenoptera and Coleoptera (larvae and adults) showed a frequen-cy in the samples plots of >90 %. Araneae, Diplopoda, Symphyla, Pauropoda, Protura, Diplura and Diptera larvae were present in more than 50 % of forest plots investigated. Palpigrada, Isoptera, Embioptera, Dermaptera and Blattaria were uncommon (<10 % of sampling plots).
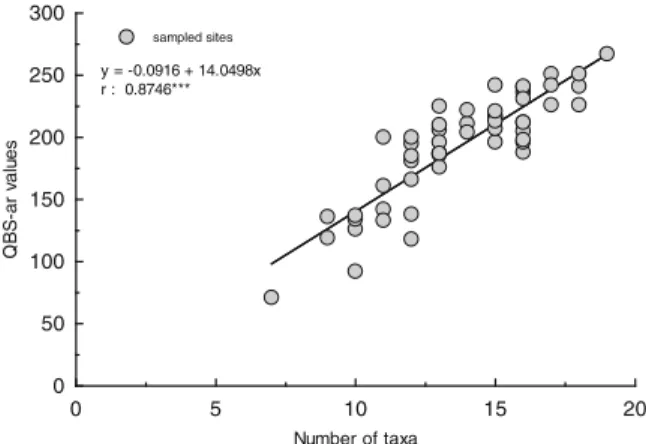
In 56 % of the forest plots investigated, the number of eco-morphological taxa collected ranged from 10 to 15. It was higher than 15 in about a third of sampling plots and lower than 10 in the 13 % of sampling plots. A positive relationship exists (r00.87, p<0.001, n0 55) between QBS-ar values and the number of taxo-nomic groups gathered in each sampling plot (Fig.3).
The highest number of taxa (19), linked to the maximum QBS-ar value (267), was observed in the Canale Monterano Turkey oak (24 Oct 2007) while the lowest number of taxa (7) related to the minimum QBS-ar (71) was detected in San Giorgio umbrella
pine (04 Jun 2008). The distribution of QBS-ar values among samples is shown in Fig.4. The soil samples characterised by QBS-ar >200 came from the least disturbed woodlands. Soil samples with a QBS-ar between 150 and 200 were gathered mainly in decid-uous stands. Then the 90 % of the soil plots where QBS-ar varied from 100 to 150 were collected from umbrella pine and Tolfa Turkey oak stands. Finally, the samples linked to lower values of QBS-ar (<100) came exclusively from the coastal umbrella pine stands.
The relationship between physical and chemical properties of soils and biodiversity of microarthropod has been investigated on a subset of plots, representa-tive of the different types of composition and forest management considering also soil compaction. Soil analyses revealed a significant inverse relationship (r0−0.69, p<0.01) between soil bulk density and
QBS-ar (Fig.5). It is well known that one of the most important effects of compaction is to increase the bulk density (Han et al. 2009; see squares in Fig. 5). Correlation analyses revealed that the taxa more vul-nerable to soil compaction were Coleoptera (adults), Protura, Pseudoscorpiones, Chilopoda and Symphyla. QBS-ar values are also directly correlated with coarse sand and skeleton (data not shown).
PCA results
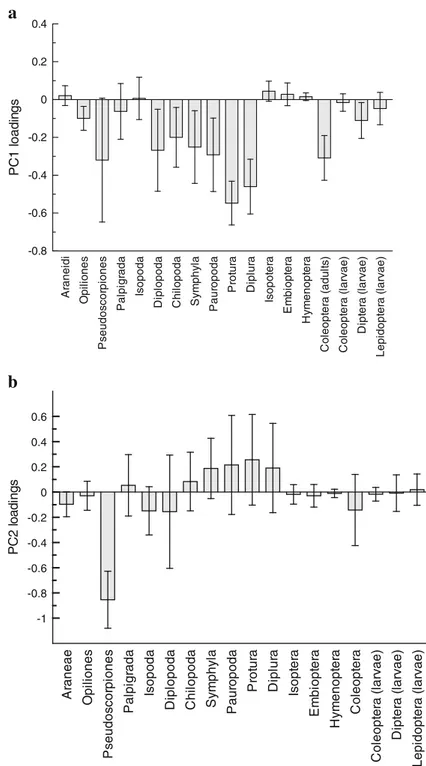
On the whole, the first two components accounted for 46.1 % of total variance (Fig. 6). PC1 (31 % of the variance) shows a significant inverse correlation with QBS-ar (Fig.7); it may be interpreted as a forest soil quality gradient. The sample plots related to the max-imum soil quality were grouped by negative PC1 scores. They belong to the different types of deciduous forest and include the unique plot related to the ever-green holm oak. The taxa contributing significantly to the biological gradient were: Protura, Diplura, Cole-optera, Pauropoda, Diplopoda, Symphyla, Chilopoda, Diptera (larvae) and Opiliones (Fig.8a). On the oppo-site side of PC1, the sample plots linked to low diver-sity of soil microarthropods are more scattered. These sample plots are related to forest plots affected by disturbance due to soil compaction (see below). PC2 (15 % of variance) is related to the central role of Pseudoscorpiones (Fig.8b) while PC3 (12 % of vari-ance) are related to the presence of Diplopoda (data not shown). Due to the relation to only one variable, caution must be used in interpreting these axes.
Performing the PCA without the disturbed plots re-duced the variance of PC1 (24.2 %) being linked to only few taxa of microarthropods (Pseudoscorpiones,
0 5 10 15 20 0 50 100 150 200 250 300 Number of taxa QB S -a r v a lu e s sampled sites y = -0.0916 + 14.0498x r : 0.8746***
Fig. 3 Relationship between number of eco morphological taxa and QBS-ar values
Fig. 4 Distribution of QBS-ar values
y = -149.33x + 313.27 R² = 0.4769 0 50 100 150 200 250 300 0.40 0.60 0.80 1.00 1.20 1.40 QB S -a r
Soil bulk density (Mg*m-3)
Fig. 5 Inverse linear relationship (r = 0.69; p < 0.01) between bulk density and QBS-ar. Soil samples with clear signs of compaction are indicated by squares
Opiliones and Coleoptera). Interestingly, PC1 scores are still related to QBS-ar values as a soil quality indicator (r00.72; p<0.05) that suggested a gradient in biodiver-sity between more“natural” and more “disturbed” for-ests. Since this axis is linked to the presence of Pseudoscorpiones, this taxon deserves particular atten-tion for biomonitoring because it may be at the top of the trophic chain. PC2 (18.5 % of total variance) is related to the presence of Protura in the soil.
QBS-ar as an index of compaction disturbance on forest soils
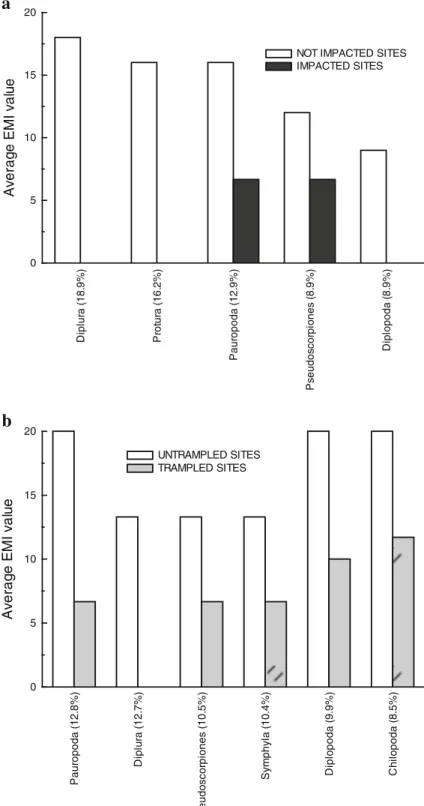
A significant variation of QBS-ar was observed be-tween undisturbed forest plots and plots disturbed by tractors (p<0.001), recreation or grazing (p<0.001). The statistical analysis on EMI data also revealed a change in biotic soil quality among disturbed/undis-turbed sampling plots (Table2). On plots impacted by tractors or not impacted, taxa that contributed most to dissimilarity between plots were Pauropoda followed by Diplopoda, Diplura, Protura, Pseudoscorpiones and Chilopoda, respectively (average dissimilarity 30.2; Fig. 9a). Where there are impacts due to recreation, seven taxa (Diplura, Symphyla, Protura, Coleoptera, Pauropoda, Diplopoda and Pseudoscorpiones) appear to be the best indicators of lack of disturbance (aver-age dissimilarity, 39.9 %; Fig.9b). Protura is the only taxon always absent in disturbed areas.
In order to deepen the effect of compaction on soil biota and to eliminate noise due to forest composition, the disturbance within the same forest type was ana-lysed in two specific cases: umbrella pine and Turkey oak stands. The results show that in the Turkey oak of Tolfa, a decline of QBS-ar was recorded in soil
-20 -10 0 10 20 30 40 -20 -10 0 10 20 PC1 (31% of variance) P C 2 ( 1 5. 1% of v a ri anc e )
Old-growth beech forest Chestnut coppice High beech forest Turkey oak stored coppice
Turkey oak high forest
Turkey oak coppice Turkey and downy oak coppice Holm oak forest
Umbrella pine TRACTOR TRANSIT TRAMPLING SEA EFFECT
Fig. 6 PCA for the plots investigated. Symbols refer to forest types and to the most significant impacts on soil
-20 -10 0 10 20 30 40 0 50 100 150 200 250 300 PC1 scores QB S -a r v a lu e s QBS-ar samples f(x)=-2.78+191.7x r=-0.94***
Fig. 7 Relationship between PC1 coordinates and QBS-ar values
samples affected by tractors used for the wood har-vesting (Table2). According to the NPMANOVA test, the microarthropod community showed a clear differ-ence between soil plots disturbed by tractors and un-disturbed plots confirming the general results. The average dissimilarity was 28.9 % and Diplura, Protura and Diplopoda were absent from disturbed plots,
while Pauropoda and Pseudoscorpiones decreased in frequency (Fig. 10a). In the umbrella pine cenosis (Orbetello, San Giorgio, Tarquinia Lido), soil compac-tion produced by recreacompac-tion showed significant differ-ences in QBS-ar between compacted and non-compacted plots (Table 2). However, NPMANOVA indicated no statistically detectable differences in the
A ranei di O p il io n e s P s eudos c or pi ones P a lp ig rada Is o p o d a D ipl op oda C h il op oda Sy m p h y la P a ur opoda Prot ur a Di p lu ra Is o p o te ra Em b io p te ra Hy m e n o p te ra C o le opt er a ( adu lt s ) C o le opt er a ( lar v a e ) D ipt er a ( lar v ae) Lepi dopt e ra ( lar v a e) -0.8 -0.6 -0.4 -0.2 0 0.2 0.4 P C 1 l o ad in gs Ar a n e a e O p il io n e s P s eudos c or pi ones Pa lp ig ra d a Is o p o d a D ipl opod a C h il opod a Sy m p h y la P aur opoda Pro tu ra D ipl ur a Is opt er a Em b io p te ra H y m e nopt er a C o leopt e ra C o le opt e ra ( lar v ae) D ipt er a ( lar v a e) Lepi dopt er a ( lar v a e) -1 -0.8 -0.6 -0.4 -0.2 0 0.2 0.4 0.6 PC2 l o a d in g s
a
b
Fig. 8 PC1 (a) and PC2 (b)factor loadings. The line represents the 95 % boot-strap confidence interval of coefficient loadings
composition/functionality of microarthropod commu-nities. Yet a considerable average dissimilarity (34.0 %) between disturbed and undisturbed plots was registered using the SIMPER procedure. The dif-ference recorded was mainly due to the absence of Diplura, in the disturbed sample plots, and Pauropoda, Psuedoscorpiones, Symphyla, Diplopoda and Chilopoda, occurring less frequently (Fig. 10b).
In umbrella pine stands, an analysis of the effect of the sea on soil habitat was carried out by comparing disturbed forest areas close to the sea with undisturbed plots far from the sea. QBS-ar was significantly lower on two of the forest plots located near the coast where marine aerosol effects are stronger: San Giorgio and Orbetello. No significant varia-tions of microarthropod communities were evident using NPMANOVA analysis. The average dissim-ilarity (SIMPER) between the forest plots close to the sea and forest plots farther from the sea was 40.9 %. The taxa primarily contributing to this dissimilarity was Diplopoda which were absent from plots close to the sea (data not shown).
In Soriano nel Cimino (Mt. Cimino) beech forest, where only one sampling plot is distinctly altered by tractors, the data suggest that QBS-ar is lower. In this case as well, the soil site disturbed by vehicle has shown a simplification of microarthropod community due to the absence of the Chilopoda and the Pauropoda.
QBS-ar community patterns in stands with no compaction
The study of the relationship between forest structure/ composition and soil biological quality, described by QBS-ar/EMI data, was carried out after removing the
sample plots disturbed by compaction (tractor transit and recreational use).
Seasonal variation (spring vs. late summer) in QBS-ar and microQBS-arthropod communities, were investigated because summer drought is the key climatic factor that affects beech and oak productivity in Mediterranean environment (Di Filippo et al. 2010; Piovesan et al. 2008). However, in woodlands dominated by Turkey oak and beech, differences in QBS-ar between spring and summer were not significant (Table3). The analysis of EMI data showed a similar result. Therefore, QBS-ar does not seem to be influenced by dry summers in deciduous Mediterranean forest.
Forest management
QBS-ar does not vary significantly between structural stages (Table3). Moreover, it is not influenced by the presence of natural gaps, and finally it does not differ between sampled plots affected by recent coppice practices.
In contrast, the analysis of variation in EMI groups among the different structural stages revealed changes in microarthropod community structure. Excluding the umbrella pine data from the two different statistical tests (K-W test and NPMANOVA), enhanced the NPMANOVA test. So the microarthropod community changed significantly, while the QBS-ar values did not show significant differences among various types of forest structure.
A more detailed analysis was carried out for Turkey oak stands considering the different struc-tural conditions in the various forest areas studied. Similar to the results found on the total data, QBS-ar did not change significantly between vari-ous types of management (high forest, stored Table 2 QBS-ar (mean±standard deviation), K-W test results (on QBS-ar values) and NPMANOVA test results (on EMI data)
Forest type Type of impact QBS-ar K-W test NPMANOVA
Not trampling Trampling
All stands Tractor 207.6±28.4 (n043) 137.7±17.4 (n04) Hc: 10.02*** F: 8.20***
Turkey oak (Tolfa) Tractor 196.4±37.1 (n010) 130±9.6 (n03) Hc: 5.63* F: 6.24**
All stands Recreational use 207.6±28.4 (n043) 118.7±28.3 (n07) Hc: 17.02*** F: 20.08***
Umbrella pine Recreational use 201.3±9.2 (n03) 116.3±30.2 (n06) Hc: 5.45* F: 1.68 ns
K-W test Kruskal–Wallis test, ns not significant *p<0.05; **p<0.01; ***p<0.001
coppice and coppice). Analysing EMI data of Tur-key oak stands, no significant differences were noted among the soil biota of the three types of forest management.
Additionally, the effect of a natural forest gap was evaluated specifically for Mt. Cimino old-growth beech forest. No significant variations of QBS-ar and soil community among closed stand/natural gap emerged.
P a ur opoda ( 1 3. 5% ) D ipl opoda ( 13% ) D ipl ur a ( 1 2. 9% ) P rot ur a ( 11. 7% ) P s eudos c or pi ones ( 9 .9 % ) C h il opoda ( 9 .6 % ) 0 5 10 15 20 A v erag e E M I v a lu e
NOT IMPACTED SITES IMPACTED SITES D ipl ur a ( 1 1. 4% ) S y m p hy la ( 1 1. 1% ) P rot ur a ( 1 0. 9% ) C o le o p te ra (9 .6 % ) P a ur opoda ( 8 .9 % ) D ipl opod a ( 8 .5 % ) P s eudos c or pi ones ( 8 % ) 0 5 10 15 20 A v erag e E M I v a lu e UNTRAMPLED SITES TRAMPLED SITES
a
b
Fig. 9 Average EMI valueof taxonomic groups with major contribution to dis-similarity for plots impacted by tractors (a) and tourist trampling (b) (SIMPER
procedure; cut off,≈70 %,
In old growth beech forests, soil quality was not ad-versely influenced by gaps originating from large tree-falls allowing sunlight to fall directly on the soil.
Finally, QBS-ar and microarthropod communities did not vary between closed stands and/recently cop-piced stands of chestnut and Turkey oak.
D ipl ur a ( 1 8. 9% ) P rot ur a ( 1 6. 2% ) P aur opoda ( 1 2. 9% ) P s eudos c or pi ones ( 8 .9 % ) D ipl opoda ( 8 .9 % ) 0 5 10 15 20 A v erag e E M I v a lu e
NOT IMPACTED SITES IMPACTED SITES P a ur opoda ( 1 2. 8% ) Di p lu ra ( 1 2 .7 % ) P s eudo s co rp io nes ( 1 0. 5% ) S y m p hy la ( 10. 4% ) D ipl o p oda ( 9 .9 % ) Ch ilo p o d a ( 8 .5 % ) 0 5 10 15 20 Av e ra g e EM I v a lu e UNTRAMPLED SITES TRAMPLED SITES
b
a
Fig. 10 Average EMI valueof the taxonomic group with major contribution to dissimilarity between Turkey oak plots impacted/ not impacted by tractors (a) and umbrella pine plots impacted/not impacted by trampling (b) (SIMPER
T able 3 QBS-ar (mean ± standard deviation), K-W test results (on QBS-ar values), NPMANOV A test results (on EMI data), and post hoc test results for NPMANOV A te st Forest type QBS-ar K-W test NPMANOV A Season Spring Late Summer Beech (M. te Cimino) 217.7 ± 10.2 (n 0 3) 196.7 ± 16.7 (n 0 3) H: 2.4 ns F: 1.82 ns T urkey oak (T olfa) 202.7 ± 4 5 (n 0 4) 193.2 ± 44.7 (n 0 4) H: 0.19 ns F: 1.82 ns Forest management High forest Gap high forest Coppice Stored coppice All stands 200.1 ± 18.3 (n 0 13) 196.5 ± 13.4 (n 0 2) 228.2 ± 33.3 (n 0 6) 221.7 ± 26.4 (n 0 7) H: 5.2 ns F: 2.6* W ithout umbrella pine stand 200.6 ± 20.7 (n 0 10) 196.5 ± 13.4 (n 0 2) 228.2 ± 33.3 (n 0 6) 221.7 ± 26.4 (n 0 7) H: 5.1 ns F: 2.9** T urkey oak 191.5 ± 36.1 (n 0 2) – 226.6 ± 36.9 (n 0 5) 219.7 ± 20.7 (n 0 4) H: 1.4 ns F: 1.2 ns Natural forest cycle Closed stand Natural gap Beech 202.9 ± 18.4 (n 0 8) 196.5 ± 13.4 (n 0 2) H: 0.15 ns F: 2.23 ns Forest management Closed stand Recently coppiced Chestnut 224.3 ± 37.9 (n 0 3) 212.7 ± 1 2 (n 0 3) H: 0.43 ns F: 0.94 ns T urkey oak (T olfa-Monterano) 217.7 ± 31.4 (n 0 1 1 ) 200 ± 32.7 (n 0 13) H 1.34 ns F: 0.85 ns T urkey oak (T olfa) 219.7 ± 20.7 (n 0 4) 180.8 ± 38.7 (n 0 6) H: 3.32 ns F: 0.8 ns T urkey oak (Monterano) 235 ± 42.3 (n 0 3) 216.4 ± 14.4 (n 0 7) H: 0.65 ns F: 0.91 ns Composition Beech Chestnut T urkey oak Umbrella pine All stands 201.6 ± 1 7 (n 0 10) 218.5 ± 25.8 (n 0 6) 208.1 ± 32.7 (n 0 24) 201.3 ± 9.2 (n 0 3) H: 1.84 ns F: 2.92** Post hoc test: BE/UP* and T O/UP* Site ef fect within forest type M.te Cimino V ico lake Beech 210.2 ± 14.4 (n 0 6) 181 ± 7.1 (n 0 2) H: 4.39* F: 4.93* T olfa Canale Monterano V etralla T arquinia T urkey oak 196.4 ± 37.1 (n 0 10) 222 ± 24.8 (n 0 10) 191.5 ± 36.1 (n 0 2) 214 ± 36.8 (n 0 2) H: 3.24 ns F: 1.92 ns Factors analysed: season, forest cycle and management, composition and sampling locality . The analyses were performed after removing the heavy imp acted (tractor/car transit, trampling and sea ef fect) plots K-W test Kruskal –W allis test, ns not significant, BE Beech, TO T urkey oak, UP umbrella pine * p < 0.05; ** p < 0.01; *** p < 0.001
Forest composition
The average, QBS-ar value for each forest type was >200, and the chestnut shows the higher average value (Table 3). However, no variations of QBS-ar among beech, chestnut, Turkey oak and umbrella pine stands emerged. A clear change of microarthropods community structure between the four forest cenosis was observed using EMI data. The subsequent pairwise comparisons between the various cenosis indicated that soil biota of umbrella pine was significantly different from those of Turkey oak and beech. Seven taxa contributed most to the average dissimilarity between the three deciduous forest habitats and umbrella pine according to the SIM-PER procedure (Fig. 11). Protura and Opiliones were always absent in umbrella pine stands while Isopoda and Diplopoda increased in abundance.
Site effect
Finally, a detailed study on variation of the biological soil quality among different sample plots was conducted for beech and Turkey oak stands. Significant differences of QBS-ar and microarthropod community structure were noticed between the two sample areas of Mt. Cimino and Ronciglione (Vico lake) (Table3). The analysis of the contribution of individual taxa showed that Diplura,
Protura, Pseudoscorpiones and Isopoda were responsible of 70 % of the total dissimilarity (Fig. 12), suggesting that in the past the Vico stand suffered an impact. No change of QBS-ar was noticed between Turkey oak stands dominated by Q. cerris on different sampling areas. NPMANOVA test revealed no significant differ-ences in soil community structure, too. Yet some changes of soil biota community structure were revealed by SIM-PER procedure which indicated seven taxa that contrib-uted most to the average dissimilarity among the four forest plots (Fig.13). In particular, Protura was always absent in the Tarquinia Turkey oak stand; this could be linked to the proximity to the coastline. Moreover, as for umbrella pine stand, Tarquinia Turkey oak stands are characterised for the highest frequency of Diplopoda. Palpigrada, a rare order in Italian soils, occur sporadical-ly in Canale Monterano and Tolfa Turkey oak and they could be considered an indicator of stable areas.
Discussion
High biological soil quality in Mediterranean forest ecosystems
The soil of the various forest types of Central Italy is characterised by high biological activity on plots
P s e u d o sco rp io n e s ( 1 5%) P rot ur a ( 1 2. 6% ) C o le opt e ra ( 10. 2% ) D ipl opod a ( 9 .6 % ) D ipl ur a ( 9 .6 % ) Is o p o d a (7 .1 % ) Op il io n e s (5 .5 % ) 0 5 10 15 20 A v erag e E M I v a lu e BEECH CESTNUT TURKEY OAK UMBRELLA PINE
Fig. 11 Average EMI value of the taxonomic group with major contribution to dis-similarity between the habi-tat sampled (SIMPER
procedure; cut off,≈70 %).
The analyses were per-formed after removing the heavily impacted plots (tractor/car transit, trampling and sea effect)
undisturbed by soil compaction, as the QBS-ar index reaches values of >200. Comparing soil of different vegetation communities, the QBS-ar index reaches
values clearly higher than those observed in cultivated fields (generally, <150; Tabaglio et al.2008,2009), in lowland meadows (average QBS-ar values range from
Diplura (29.6%) Protura (17.1%) Pseudoscorpiones (12.3%) Isopoda (8.5%) 0 5 10 15 20
Average EMI value
CIMINO VICO
Fig. 12 Average EMI value of the taxonomic group with major contribution to dis-similarity between Mt. Cimino and Vico lake beech forest (SIMPER procedure;
cut off,≈70 %). The
analy-ses were performed after re-moving the heavily impacted plots (tractor/car transit, trampling, sea effect)
Pseudoscorpiones (13.5%)
Protura (13%)
Diplopoda (12.6%) Coleoptera (10.2%) Pauropoda (8.2%)
Isopoda (7.5%) Palpigrada (6.9%) 0 5 10 15 20
Average EMI value
TOLFA VETRALLA MONTERANO TARQUINIA
Fig. 13 Average EMI value of the taxonomic group with major contribution to dis-similarity between Tolfa, Vetralla, Canale Monterano and Tarquinia Turkey oak plots (SIMPER procedure;
cut off,≈70 %). The
analy-ses were performed after re-moving the heavily impacted plots (tractor/car transit, trampling and sea effect)
70 to 200; Gardi et al.2002; Menta et al.2008,2011), in managed chestnut woodland (157–107; Paparatti and Peroni, personal communication), in vaccinietum (Empetro-Vaccinietum gaultherioidis) and alpine fields (Anthoxantho-Brachypodietum genuensis), (QBS-ar average values are equal to 135 and 190, respectively; Leoni2008) and in degraded areas, such as covered dumps (QBS-ar value was lower than 80; Menta et al.2008). A previous study (Callaham et al. 2006) indicated a clear gradient of decreasing diversity of macroinvertebrate soil communities from hardwood stands to pine stands followed by pastures and culti-vated fields. Our results confirm that hardwood soils are characterised by the highest biodiversity level and by a well-structured and mature microarthropod com-munity, typical of stable ecosystems.
Another study revealed high QBS-ar values of a neighbouring plain oak forest in Latium (Central Italy) (Podrini et al. 2006). The Mediterranean ecology of Latium, where the warm-temperate evergreen forest meets the deciduous biome, should enhance the bio-diversity status of the soil, too. Moreover, Central Italy was a refuge area during Quaternary glaciations and for this reason forest ecosystems are characterised by a high diversity of flora and fauna (Ricci Lucchi2008). Indeed in a northern Italy beech forest, growing in a protected area (Guadine Pradaccio) the QBS-ar value was 172 (Menta 2008), probably because beech ex-panded in more recent times.
QBS-ar and forest composition/management
This study reveals no significant differences in the QBS-ar index values between several compositional/ structural stages of deciduous hardwood forest in Cen-tral Italy (e.g. beech vs. oak vs. chestnut; coppice vs. secondary old-growth stands). In fact, canopy open-ings and silvicultural management (e.g. coppicing) do not seem to affect the QBS-ar index.
QBS-ar values in undisturbed umbrella pine plots, originating from reforestation activities (80–35 years; Bellarosa et al.1996) are similar to those of centuries-old ancient woodlands. In these young forest stands, the composition of the microarthropod community most likely results from species living in the pre-existing vegetational habitat (grassland or cultivated field), col-onisation of new species from nearby forests, and the subsequent interaction between these species. These soil animal communities are often impoverished and
affected both by physical soil properties (granulometry) and by those derived from land-use (pH, stratification, quality and quantity of organic matter and porosity) (Huhta and Raty2005). The poor potential for dispersal of many species inhabiting the soil is a key element restricting potential habitat colonisation. Experiments on microarthropod dispersal (Ojala and Huhta 2001) revealed that most collembolan have a potential capacity for colonisation over the distance of 30 m within 30 years since reforestation. Therefore, the reforested stands are characterised by a lower diversity, biomass and density of soil animal communities than the native forest stands. In particular, a simplified microarthropod community lived in the umbrella pine stands studied here. It differs from the other forest stands because of the absence of Protura, a taxon characterised by high adaptation to soil life, and by the absence of Opiliones. However, on undisturbed soil plots, the QBS-ar is com-parable with that of deciduous forest due to the contri-bution of Isopoda and Diplopoda which compensate partly the decrease in Diplura and Coleoptera (adults). Despite of the abovementioned limitations, on the whole, soil animal communities could be able to recover in few decades. In contrast, in the umbrella pine nearest to the coast, a general impoverishment of the soil com-munity is attributed to unfavourable environmental fac-tors (e.g. sand soil) and stress (e.g. sea aerosol), but this requires further study.
It was quite surprising that the secondary old-growth beech forest has QBS-ar values similar to those of managed forests. However it should be noted that these forests sustained anthropogenic impacts from several ancient cultures (Villanoviana, Etruschi and Romans) who used forests to collect wood and food resources. In addition, this old-growth forest was utilised in the 1,800 s as parkland forests, for gathering resources. High forests are often pleasant places that make them particularly attractive for recreation and consequently attract heavier tourist impacts (soil com-paction) compared with coppice stands which are usu-ally frequented only by hunters and mushroom harvesters. The high soil biodiversity of coppice, even after the final rotation cut, could be linked to the maintenance of root structure and to the diffuse organ-ic detritus on the ground after the cutting. It is well known that root apparatus, in particular ectomycorrhi-zae, feed many arthropods. However, it must be emphasised that the QBS-ar index investigates micro-arthropod communities on the basis of morphological
characteristics so that community changes at lower taxonomical levels (e.g. genus and species) cannot be distinguished. In addition, QBS-ar does not consider changes in population density.
In Central Italy silvicultural practices and composi-tion of deciduous forests do not seem to have any important effect on microarthropods community ture. The absence of a change in soil community struc-ture could be linked to the litter layer that in these hardwood stands is thick enough to maintain a high organic matter level and a favourable microclimate in every season. Soil mesofauna seem to recover quickly after disturbances such as tree cutting (Bird et al.2000) indicating a good level of ecosystem integrity (commu-nity resilience). The same aspect also emerged in con-ventional tillage condition where soil arthropod abundance was significantly higher in autumn com-pared with summer (Neave and Fox1998). The authors suggested that, given sufficient time without soil distur-bance, soil arthropod numbers are able to recover within the growing season. These results confirms the previous studies conducted on a temperate cool rain forest in west Canada where there were no significant differences in population density of arthropods between undisturbed forests on harvested plots and unharvested patches (Addison 2007). Additionally, in another recent study, regarding a beech forest, the hypothesis of Ponge et al. (1998), which predicts community changes during for-est rotations, was refuted from a functional view point (Hedde et al.2007). However several studies consider-ing the effects of silvicultural practices on soil fauna found important impacts on soil forest fertility/produc-tivity and in the terrestrial food chain (Moore et al. 2002). It is generally accepted that removal of trees by clear cutting, or other methods, has a significant effect on the invertebrate fauna of the forest floor (Heliovaara and Vaisanen1984; Hoekstra et al.1995). The effects on arthropod communities are complex and difficult to analyse since various taxonomic groups are affected and they react to impacts differently (Bird et al.2000; Hill et al. 1975; Huhta et al. 1967; Lasebikan 1975; Vlug and Borden 1973). The separate analyses of the different impacts are a useful way to find clear patterns in such a complex system.
QBS-ar and the dry season
The results show that QBS-ar does not vary signifi-cantly with seasons (rainy season, spring; dry season,
summer) in deciduous stands. Similarly no structural variation of microarthropod communities emerge. Studies on the Chilopoda community structure indi-cated that its changes through the year are very small (Grgič and Kos 2005). On the other hand, it is well known that in Mediterranean ecosystems, invertebrate abundance follows seasonal cycles with a peak during winter and a decline in summer (Touloumis and Stamou 2009). Since QBS-ar is based on qualitative data of soil fauna, in deciduous forest the index seems to be not affected by seasonal variations (summer drought) making it a good soil quality indicator. How-ever, further research is necessary in ecosystems af-fected by persistently dry summers (e.g. macchia and Mediterranean pine forests) to confirm that seasonality is not a significant influence on the index. In the same way, the effect of temperature on QBS-ar should be analysed in a separate case study (Aspetti et al.2010). Particularly, in forest ecosystems stable micro-environmental conditions exist throughout the year so that the microarthropod community (expressed by EMI form presence), under a thick litter layer, is less affected by seasonal changes. On the contrary, in cultivated fields, soil microarthropod communities (Neave and Fox 1998) are strongly affected by sea-sonality, as measured by QBS-ar values (Tabaglio et al.2009).
QBS-ar and forest soil compaction
PCA analysis showed a clear soil quality gradient from the coastal reforestation stands, disturbed by recreational use, to the less-disturbed deciduous stands. The index seems to be very efficient in linking variation in arthropod communities in response to the impacts of soil compaction, also measured in terms of soil bulk density. Compaction modifies a variety of physical and chemical properties in the soil (pore space, organic matter, temperature and moisture) pro-ducing a considerable loss of biological forms best adapted to soil life. The PCA analysis revealed that nine functional groups reacted negatively to soil impacts (e.g. compaction). In particular, Protura, Sym-phyla and Pauropoda are taxonomic groups typical of stable environments (Bedano et al. 2006) linked to undisturbed soil (for their ecology, seeESM). Further-more, recent studies on the effects of harvesting on soil (Addison 2007) reveal that Symphyla, Diplura and Diplopoda are the most sensitive groups not
occurring in disturbed areas. In particular, Myriapoda has been shown to be absent on degraded soils (Menta et al.2008) and sporadically present at low density in cultivated fields (Tabaglio et al.2009). It is possible to hypothesise that the same groups could be studied in greater depth in order to create more discriminating indices of naturalness.
Conclusions
A more complete census of soil microarthropod com-munities is needed for biodiversity conservation. Soil-quality monitoring is often inaccessible to land man-agers because the measurement systems are too com-plex, too expensive or both (Herrick2000), despite its utility as an indicator of environmentally friendly use of natural resources. This study has contributed to the development of efficient and low-cost biological indi-ces of soil quality (Bongers 1990,1999; Cortet et al. 2000; van Straalen 1998, 2004) that are based on microarthropod communities.
Since forest ecosystem are characterised by high values of QBS-ar (>200), values of <150 should be considered indicative of important regressive impacts (i.e. unsustainable resource use). In forest ecosystem management, QBS-ar could be an efficient index for evaluating the impacts of forest harvesting on soil (i.e. soil compaction due to logging). At the same time, QBS-ar can be a valuable tool in ecosystem restoration programs to monitor the development of soil functions and biodiversity and to prevent the negative effects of soil compaction when mechanisation is used (e.g. in Europe many LIFE projects include mechanised oper-ations). Furthermore, this index could be implemented in environmental management programs of urban for-estry and protected areas in relation to recreational use to prevent the negative effects of trampling. More in gen-eral, QBS-ar is a candidate index for continuous bio-monitoring of soil communities to describe patterns and processes in the microarthropod biodiversity across the landscape. A deeper knowledge of soil biodiversity in response to landscape use will provide guidance in effective management planning for sustainable renew-able resource use and nature conservation.
Acknowledgements Funding was provided, in part, by
re-search project PRAL Regione Lazio n. 2003/75. We thank Scott Mensing for English editorial revisions.
References
Addison, J. (2007). Green tree retention: a tool to maintain ecosystem health and function in second-growth coastal forests. In D. W. Langor (Ed.), Arthropods of Canadian forest (p. 25). Ottawa: Natural Resources Canada, Canadi-an Forest Service.
Anderson, M. J. (2001). A new method for non-parametric multivariate analysis of variance. Austral Ecology, 26,
32–46.
Aspetti, G. P., Boccelli, R., Ampollini, D., Del Re, A. A. M., & Capri, E. (2010). Assessment of soil-quality index based on microarthropods in corn cultivation in Northern Italy.
Eco-logical Indicators, 10(2), 129–135.
Bardgett, R. D. (2002). Causes and consequences of animal
diversity in soil. Zoology, 105, 367–374.
Bedano, J. C., Cantú, M. P., & Doucet, M. E. (2006). Soil Spring-tails (Hexapoda: Collembola), symphylans and pauropods (Arthropoda: Myriapoda) under different management sys-tems in agroecosyssys-tems of the subhumid Pampa (Argentina). European Journal of Soil Biology, 42(2), 107–119. Bellarosa, R., Codipietro, P., Piovesan, G., & Schirone, B.
(1996). Degradation, rehabilitation and sustainable man-agement of a dunal ecosystem in Central Italy. Land
Deg-radation & Development, 7(4), 297–311.
Bird, S., Robert, N. C., & Crossley, D. A. (2000). Impacts of silvicultural practices on soil and litter arthropod diversity in a Texas pine plantation. Forest Ecology and
Manage-ment, 131, 65–80.
Bonferroni, C. E. (1935). Il calcolo delle assicurazioni su gruppi di teste. In Studi in onore del Professore Salvatore Ortu
Carboni (pp. 13–60). Rome, Italy: Bardi
Bonferroni, C. E. (1936). Teoria statistica delle classi e calcolo
delle probabilità. Pubblicazioni dell’Istituto Superiore di
Scienze Economiche e Commerciali di Firenze, 8, 3–62. Bongers, T. (1990). The Maturity Index: an ecological measure
of environmental disturbance based on nematode species composition. Oecologia, 83, 14–19.
Bongers, T. (1999). The Maturity Index, the evolution of nem-atode life history traits, adaptive radiation and cp-scaling.
Plant and Soil, 212, 13–22.
Buger, J. A., & Zedaker, S. M. (1993). Drainage effects on plant diversity and productivity in loblolly pine (Pinus taeda L.) plantations on wet flats. Forest Ecology and Management,
61, 109–126.
Callaham, M. A., Richter, D. D., Coleman, D. C., & Hofmockel, M. (2006). Long-term land-use effects on soil invertebrate communities in Southern Piedmont soils, USA. European
Journal of Soil Biology, 42, 150–156.
Cassagne, N., Bal-Serin, M. C., Gers, C., & Gauquelin, T. (2004). Changes in humus properties and collembolan communities following the replanting of beech forests with spruce. Pedobiologia, 48, 267–276.
Clarke, K. R. (1993). Non-parametric multivariate analysis of changes in community structure. Australian Journal of Ecology, 18, 117–143.
Cortet, J., Gomot-De Vauflery, A., Poinsot-Balaguer, N., Gomot, L., Texier, C., & Cluzeu, D. (2000). The use of invertebrate soil fauna in monitoring pollutant effects.
Davis, J. C. (1986). Statistics and data analysis in geology. New York: Wiley.
Deleporte, S. (1981). Peuplement en Diptères Sciaridae d’une litière de chêne. Revue d’Ecologie et de Biologie du Sol,
18, 231–242.
Di Filippo, A., Alessandrini, A., Biondi, F., Blasi, S., Portoghesi, L., & Piovesan, G. (2010). Climate change and oak decline: dendroecology and stand productivity of a Turkey oak (Quer-cus cerris L.) old stored coppice in Central Italy. Annals of Forest Science, 67, 706.
Doblas-Miranda, E., Wardle, D. A., Peltzer, D. A., & Yeates, G. W. (2007). Changes in the community structure and diversity of soil invertebrate across the Franz Josef Glacier
chronose-quence. Soil Biology and Biochemistry, 40, 1069–1081.
Doran, J. W., & Parkin, T. B. (1994). Defining and assessing soil
quality. SSSA Special Publication, 35, 3–21.
Gardi, C., Tomaselli, M., Parisi, V., Petraglia, A., & Santini, C. (2002). Soil quality indicators and biodiversity in northern Italian permanent grasslands. European Journal of Soil Biology, 38, 103–110.
Gardi, C., Menta, C., & Leoni, A. (2008). Evaluation of envi-ronmental impact of agricultural management practices using soil microarthropods. Fresenius Environmental
Bul-letin, 17(8b), 1165–1169.
Grgič, T., & Kos, I. (2005). Influence of forest phase on
centi-pede diversity in managed beech forests in Slovenia.
Bio-diversity and Conservation, 14, 1841–1862.
Guinchard, M., & Robert, J.-C. (1991). Approche biocénotique
du système sol par l’étude du peuplement de larve
d’in-sectes (première contribution). Revue d’Ecologie et de
Biologie du Sol, 28, 479–490.
Gupta, S. R., & Malik, V. (1996). Soil ecology and
sustainabil-ity. Tropical Ecology, 37(1), 43–55.
Hammer, Ø., Harper, D. A. T., & Ryan, P. D. (2001). PAST: Palaeontological Statistics software package for education and data analysis. Palaeontologia Electronica, 4(1), 9. Han, S.-K., Han, H.-S., Page-Dumroese, D. S., & Johnson, L. R.
(2009). Soil compaction associated with cut-to-length and whole tree harvesting of coniferous forest. Canadian Jour-nal of Forest Research, 39, 976–989.
Harper, D. A. T. (1999). Numerical palaeobiology. Chichester: Wiley.
Hedde, M., Aubert, M., Bureau, F., Margerie, P., & Decaens, T. (2007). Soil detritivore macro-invertebrate assemblages throughout a managed beech rotation. Annals of Forest
Science, 64, 219–228.
Heliovaara, K., & Vaisanen, R. (1984). Effects of modern
for-estry on northwestern European forest invertebrates—a
synthesis. Acta Forestalia Fennica, 83, 1–96.
Herrick, J. E. (2000). Soil quality: an indicator of sustainable
land management? Applied Soil Ecology, 15, 73–83.
Hill, S. B., Metz, L. J., & Farrier, M. H. (1975). Soil mesofauna and silvicultural practices. In B. Bernier & C. H. Winget (Eds.), Forest soil and forest management (pp. 119–135). Laval: Les Presses de l’Université Laval, France. Hodkinson, I. D., & Jackson, J. K. (2005). Terrestrial and
aquatic invertebrates as bioindicators for environmental monitoring, with particular reference to mountain
ecosys-tems. Environmental Management, 35, 649–666.
Hoekstra, J. M., Bell, R. T., Launer, A. E., & Murphy, D. D. (1995). Soil arthropod abundance in coastal redwood
forest: effect of selective timber harvest. Environmental Entomology, 24, 246–252.
Hogervorst, R. F., Verhoef, H. A., & van Straalen, N. M. (1993). Five year trends in soil arthropod densities in pine forests with various levels of vitality. Biology and Fertility of
Soils, 15, 189–195.
Huhta, V., Karppingen, E., Nurminen, M., & Valpas, A. (1967). Effect of silvicultural practices upon arthropod, annelid and nematode populations in coniferous forest soil. Annales
Zoologici Fennici, 4, 87–143.
Huhta, V., & Räty, M. (2005). Soil animal communities of planted birch stands in central Finland. Silva Fennica, 39,
5–19.
Jabin, M., Mohr, D., Kappes, H., & Topp, W. (2004). Influence of deadwood on density of soil macro-arthropods in a
managed oak–beech forest. Forest Ecology and
Manage-ment, 194, 61–69.
Jackson, D. A. (1993). Stopping rules in principal components analysis: a comparison of heuristical and statistical approaches. Ecology, 74, 2204–2214.
Kaneko, N., & Salamanca, E. (1999). Mixed leaf litter effects on decomposition rates and soil microarthropod communities
in an oak–pine stand in Japan. Ecological Research, 14,
131–138.
Karlen, D. L., Mausbach, M. J., Doran, J. W., Cline, R. G., Harris, R. F., & Schuman, G. E. (1997). Soil quality: a concept, definition, and framework for evaluation. Soil
Science Society of American Journal, 61(1), 4–10.
Lasebikan, B. A. (1975). The effect of clearing on the soil
arthropods of a Nigerian rain forest. Biotropica, 7, 84–89.
Lebrun, P. (1987). Quelques réflexions sur les rôles exercés par
la faune édaphique. Revue d’Ecologie et de Biologie du
Sol, 24, 495–502.
Leoni, A. (2008). Studio della Biodiversità vegetale e del popo-lamento a microartropodi edafici nella riserva naturale “Guadine Pradaccio”. Ph.D. thesis, Università degli Studi di Parma, Parma
Menta, C. (2008). Guida alla conoscenza della Biologia e Ecologia del Suolo—Funzionalità, Degrado, indicatori. (p. 265) Bologna: Gruppo Perdisa Editore. ISBN 978-88-8372-454-1.
Menta, C., Leoni, A., Bardini, M., Gardi, C., & Gatti, F. (2008). Nematode and microarthropod communities: comparative use of soil quality bioindicators in covered dump and
natural soils. Environmental Bioindicators, 3(1), 35–46.
Menta, C., Leoni, A., Gardi, C., & Conti, F. D. (2011). Are grasslands important habitats for soil microarthropod
con-servation? Biodiversity and Conservation, 20(5), 1073–
1087.
Minnesota Forest Resources Council. (1999). Sustaining Min-nesota forest resources: voluntary site-level forest manage-ment guidelines for landowners, loggers, and resources managers (p. 473). St. Paul: Minnesota Forest Resources Council.
Moore, J. D., Ouimet, R., Camiré, C., & Houle, D. (2002). Effects of two silvicultural practices on soil fauna abun-dance in a northern hardwood forest, Québec, Canada. Canadian Journal of Soil Science, 82, 105–113.
Neave, P., & Fox, C. A. (1998). Response of soil invertebrates to reduced tillage systems established on a clay loam soil.
Ojala, R., & Huhta, V. (2001). Dispersal of microarthropods in forest soil. Pedobiologia, 41, 443–450.
Paoletti, M. G., & Hassall, M. (1999). Woodlice (Isopoda: Oniscidea): their potential for assessing sustainability and use as bioindicators. Agriculture, Ecosystems and
Enviro-ment, 74, 157–165.
Paquin, P., & Coderre, D. (1997). Changes in soil macroarthro-pod communities in relation to forest maturation through three successional stages in the Canadian boreal forest.
Oecologia, 112(1), 104–111.
Parisi, V. (2001). La qualità biologica del suolo. Un metodo
basato sui microartropodi. Acta Naturalia de “L’Ateneo
Parmense”, 37(3/4), 105–114.
Parisi, V., Cristina, M., Gardi, C., Jacomini, C., & Mozzanica, E. (2005). Microarthropod communities as a tool to assess soil quality and biodiversity: a new approach in Italy.
Agriculture, Ecosystems and Environment, 105, 323–333.
Piovesan, G., Biondi, F., Di Filippo, A., Alessandrini, A., & Maugeri, M. (2008). Drought-driven growth reduction in old beech (Fagus sylvatica L.) forests of the central Apen-nines, Italy. Global Change Biology, 14, 1265–1281. Podrini A., Di Fabbio, A., Jacomini, C., Dowgiallo, G. (2006).
Relationships between pedological matrix and soil mesofauna in the Natural Reserve of Decima-Malafede (Latium): a new approach and possible applications. S.It.E. Atti XXX. XVI° Congresso della Società Italiana di
Ecologia, Viterbo-Civitavecchia. http://www.ecologia.it/
congressi/XVI/articles/jacomini-267.pdf
Ponge, J. F., André, J., Zackrisson, O., Bernier, N., Nilsson, M.-C., & Gallet, C. (1998). The forest regeneration puzzle.
BioSci-ence, 48, 523–528.
Radea, C., & Arianoutsou, M. (2002). Environmental responses of soil arthropod communities along an altitudinal-climatic gradient of Western Crete in Greece. Journal of
Mediter-ranean Ecology, 3, 37–45.
Ricci Lucchi, M. (2008). Vegetation dynamics during the Last Interglacial-Glacial cycle in the Arno coastal plain (Tuscany, western Italy): location of a new tree refuge. Quaternary Science Reviews, 27, 2456–2466.
Ruf, A., Beck, L., Dreher, P., Hund-Rinke, K., Römbke, J., & Spelda, J. (2003). A biological classification concept for
the assessment of soil quality:“biological soil classification
scheme” (BBSK). Agriculture, Ecosystems and
Environ-ment, 98, 263–271.
Rusek, J. (1985). Soil microstructures—contribution on specific
soil organisms. Quaestiones Entomologicae, 21, 497–514.
Tabaglio, V., Gavazzi, C., & Menta, C. (2008). The influence of no-till, conventional tillage and nitrogen fertilization on physico-chemical and biological indicators after three years of monoculture barley. Italian Journal of Agronomy,
3(4), 233–240.
Tabaglio, V., Gavazzi, C., & Menta, C. (2009). Physico-chemical indicators and microarthropod communities as influenced by no-till, conventional tillage and nitrogen fertilisation after four years of continuous maize. Soil &
Tillage Research, 105(1), 135–142.
Theenhaus, A., & Schaefer, M. (1995). The effects of clear-cutting and liming on the soil macrofauna of a beech forest. Forest Ecology and Management, 77, 35–51.
Touloumis, K., & Stamou, G. P. (2009). A metapopulation a p p r o a c h o f t h e d y n a m i c s o f a r t h r o p o d s f r o m Mediterranean-type ecosystems. Ecological Modelling,
220(8), 1105–1112.
Toutain, F. (1987). Les litières: siège de systèmes interactifs et
moteur de ces interactions. Revue d’Ecologie et de Biologie
du Sol, 24, 231–242.
van Straalen, N. M. (1998). Evaluation of bioindicator systems derived from soil arthropod communities. Applied Soil
Ecology, 9, 429–437.
van Straalen, N. M. (2004). The use of soil invertebrates in ecological survey of contaminated soils. In P. Doelman & H. Eijsackers (Eds.), Vital soil. Amsterdam: Elsevier. Vlug, H., & Borden, J. H. (1973). Acari and Collembola
pop-ulations affected by logging and slash burning in a coastal British Columbia coniferous forest. Environmental Ento-mology, 2, 1016–1023.
Zar, J. H. (1996). Biostatistical analysis (3rd ed.). New York: Prentice-Hall.