Université de Montréal
Towards Using Fluctuations in Internal Quality Metrics
to Find Design Intents
par
Thomas Schweizer
Département d’informatique et de recherche opérationelle Faculté des arts et des sciences
Mémoire présenté à la Faculté des études supérieures et postdoctorales en vue de l’obtention du grade de
Maître ès sciences (M.Sc.) en Informatique Orientation Génie logiciel
avril 2020
c
Université de Montréal
Faculté des études supérieures et postdoctorales Ce mémoire intitulé
Towards Using Fluctuations in Internal Quality Metrics
to Find Design Intents
présenté par
Thomas Schweizer
a été évalué par un jury composé des personnes suivantes : Marc Feeley (président-rapporteur) Michalis Famelis (directeur de recherche) Eugène Syriani (membre du jury) Mémoire accepté le : 2020-01-10
Sommaire
Le contrôle de version est la pierre angulaire des processus de développement de logiciels modernes. Tout en construisant des logiciels de plus en plus complexes, les développeurs doivent comprendre des sous-systèmes de code source qui leur sont peu familier. Alors que la compréhension de la logique d’un code étranger est relativement simple, la compréhension de sa conception et de sa genèse est plus compliquée. Elle n’est souvent possible que par les descriptions des révisions et de la documentation du projet qui sont dispersées et peu fiables – quand elles existent.
Ainsi, les développeurs ont besoin d’une base de référence fiable et pertinente pour com-prendre l’historique des projets logiciels. Dans cette thèse, nous faisons les premiers pas vers la compréhension des motifs de changement dans les historiques de révision. Nous étudions les changements prenant place dans les métriques logicielles durant l’évolution d’un projet.
Au travers de multiples études exploratoires, nous réalisons des expériences quantita-tives et qualitaquantita-tives sur plusieurs jeux de données extraits à partir d’un ensemble de 13 projets. Nous extrayons les changements dans les métriques logicielles de chaque commit et construisons un jeu de donnée annoté manuellement comme vérité de base.
Nous avons identifié plusieurs catégories en analysant ces changements. Un motif en par-ticulier nommé "compromis", dans lequel certaines métriques peuvent s’améliorer au détri-ment d’autres, s’est avéré être un indicateur prometteur de changedétri-ments liés à la conception – dans certains cas, il laisse également entrevoir une intention de conception consciente de la part des auteurs des changements. Pour démontrer les observations de nos études explora-toires, nous construisons un modèle général pour identifier l’application d’un ensemble bien connu de principes de conception dans de nouveaux projets.
Nos résultats suggèrent que les fluctuations de métriques ont le potentiel d’être des indi-cateurs pertinents pour gagner des aperçus macroscopiques sur l’évolution de la conception dans l’historique de développement d’un projet.
Mots-Clés: Maintenance du logiciel, Conception du logiciel, Historique des versions, Mesure du logiciel, Réusinage
Summary
Version control is the backbone of the modern software development workflow. While build-ing more and more complex systems, developers have to understand unfamiliar subsystems of source code. Understanding the logic of unfamiliar code is relatively straightforward. However, understanding its design and its genesis is often only possible through scattered and unreliable commit messages and project documentation – when they exist.
Thus, developers need a reliable and relevant baseline to understand the history of soft-ware projects. In this thesis, we take the first steps towards understanding change patterns in commit histories. We study the changes in software metrics through the evolution of projects.
Through multiple exploratory studies, we conduct quantitative and qualitative experi-ments on several datasets extracted from a pool of 13 projects. We mine the changes in software metrics for each commit of the respective projects and manually build oracles to represent ground truth.
We identified several categories by analyzing these changes. One pattern, in particular, dubbed "tradeoffs", where some metrics may improve at the expense of others, proved to be a promising indicator of design-related changes – in some cases, also hinting at a conscious design intent from the authors of the changes. Demonstrating the findings of our exploratory studies, we build a general model to identify the application of a well-known set of design principles in new projects.
Our overall results suggest that metric fluctuations have the potential to be relevant indi-cators for valuable macroscopic insights about the design evolution in a project’s development history.
Keywords: Software maintenance, Software design, Version history, Software measure-ment, Refactoring
Contents
Sommaire . . . v
Summary . . . vii
List of tables . . . xiii
List of figures . . . xv
Acronyms . . . xvii
Acknowledgements . . . xix
Chapter 1. Introduction . . . 1
1.1. Modern software development . . . 1
1.2. Problem Statement . . . 3
1.3. Research Questions . . . 4
1.4. Approach . . . 4
1.5. Potential future benefits . . . 6
1.6. Contributions . . . 7
1.7. Structure of the thesis . . . 8
1.8. Work attribution. . . 8
Chapter 2. Background . . . 9
2.1. Software Design . . . 9
2.2. SOLID Principles . . . 9
2.3. Version Control Systems . . . 12
2.4. Mining Software Repositories . . . 13
2.5. Metrics . . . 14
2.6. Summary . . . 15
Chapter 3. Data collection . . . 17
3.1. Design . . . 18
3.1.1. Unit of analysis . . . 18
3.1.2. Target population . . . 18
3.1.3. Sampling technique . . . 18
3.2. Project selection . . . 18
3.3. Commit selection (A) . . . 19
3.4. Refactorings (B) . . . 20
3.5. Native dataset (C) . . . 20
3.6. Raw dataset (D) . . . 21
3.7. Fluctuations dataset (E) . . . 21
3.8. Aggregation (F). . . 22
3.9. Summary . . . 22
Chapter 4. Exploratory studies . . . 23
4.1. Exploring JFreeChart . . . 24
4.1.1. Setup . . . 24
4.1.1.1. Project selection . . . 24
4.1.1.2. Objects . . . 24
4.1.2. Computing the dataset. . . 25
4.1.4. Results . . . 27
4.1.4.1. Interesting cases . . . 30
4.2. Exploring Tradeoffs . . . 34
4.2.1. Refined classification . . . 35
4.2.2. Fluctuations in context . . . 38
4.2.2.1. Context 1 – Production vs. Test Code . . . 38
4.2.2.2. Context 2 – Refactoring. . . 39
4.2.2.3. Context 3 – Releases . . . 42
4.2.3. Discussion . . . 45
4.3. Towards Design Intent . . . 46
4.3.1. Setup . . . 46
4.3.2. Results . . . 49
4.4. Threats to validity . . . 50
4.5. Lessons Learned . . . 53
Chapter 5. Predicting SOLID Principles . . . 55
5.1. Building an oracle . . . 55
5.1.1. Protocol . . . 55
5.1.2. Dataset . . . 56
5.2. Approach . . . 59
5.3. Results . . . 60
5.4. Preliminary Evaluation of Usefulness . . . 62
5.4.1. Protocol . . . 62
5.4.2. Results . . . 63
5.5. Threats to validity . . . 64
5.6. Lessons Learned . . . 65
Chapter 6. Related work . . . 67
Chapter 7. Conclusion . . . 71
7.1. Summary . . . 71
7.2. Limitations & Future Work . . . 72
7.2.1. Technical Improvements. . . 72
7.2.2. Methodology Improvements . . . 74
7.2.3. Indicators of design . . . 75
7.2.4. Design Intents and Cross-referencing . . . 75
Bibliography . . . 77 Appendix A. Metric History . . . A-i A.1. Features . . . A-i A.2. Installation . . . A-i A.3. Usage . . . A-ii A.3.1. Running from command line. . . .A-ii A.3.2. Using the API . . . .A-ii A.4. Building. . . .A-ii A.5. Testing . . . .A-ii Appendix B. Codebook . . . B-i B.1. Annotation guidelines . . . B-i B.1.1. Classifier for SOLID principles detection in RCs . . . B-ii B.1.2. Manual characterization of SOLID principles . . . .B-iii B.1.2.1. Single Responsibility Principle (SRP) . . . .B-iii B.1.2.2. Open Closed Principle (OCP) . . . .B-iv B.1.2.3. Liskov’s Substitution Principle (LSP) . . . .B-iv B.1.2.4. Interface Segregation Principle (ISP) . . . B-v
B.1.2.5. Dependency Inversion Principle (DIP) . . . B-v
List of tables
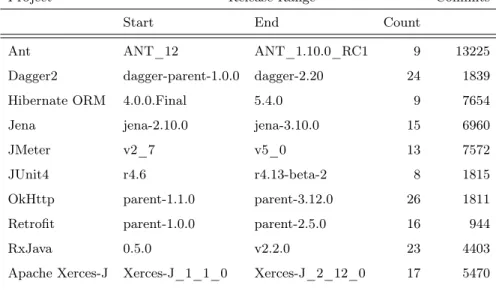
3.1 List of the software projects retained. . . 19
4.1 Summary of the scenarios . . . 26
4.2 Refactoring operations in JFreeChart . . . 28
4.3 Refactoring Commits (RCs) for each Scenario . . . 29
4.4 Implementation tasks and RCs . . . 29
4.5 Metric fluctuations in interesting cases . . . 30
4.6 Ratio of revisions containing a refactoring to total number of revisions . . . 40
4.7 Analyzed minor releases for each project . . . 44
4.8 Distribution of the implementation tasks in the sampled set of RCs. . . 48
5.1 Summary of the collected dataset per project. . . 57
5.2 Average performance of the approach with respective standard deviations. . . 60
5.3 Number of occurrences for recurring metric in the three first levels of the decision trees. . . 61
5.4 Tally of the developers opinions for projects MetricHistory et Q. . . 63
List of figures
1.1 Commits containing design changes are highlighted compared to the rest of the version history. Each commit also details which software artifacts had their design
changed. . . 3
2.1 Illustration of the application of Dependency Inversion Principle (DIP) on a toy example. The colored arrow represents the dependency between a high component (left) and a lower level component (right). Note how the arrow changes direction from layout b) to c). . . 12
3.1 Different datasets mined from the source code of the project . . . 17
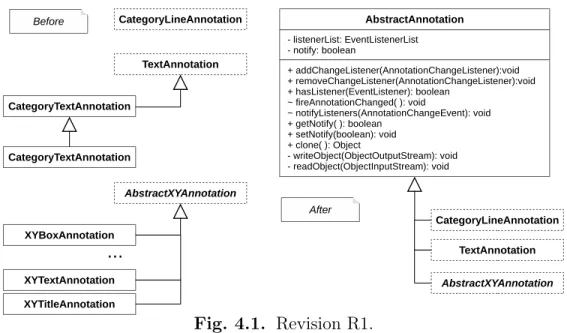
4.1 Revision R1. . . 31
4.2 Metric fluctuations for each project . . . 36
4.3 Distribution of metric fluctuations in production code artifacts, averaged over all projects. The number in parentheses is the standard deviation. . . 36
4.4 Distribution of metric fluctuations in test code artifacts, averaged over all projects. The number in parentheses is the standard deviation. . . 39
4.5 Types of refactoring . . . 40
4.6 Metric fluctuation distributions for RCs averaged for all projects. The number in parentheses is the standard deviation of each average. . . 41
4.7 Distribution of metric fluctuations relative to stages in release cycle, averaged over all projects. . . 42
4.8 Percentage of design decisions in each sample per project. The red line is the average number of detected design decisions across all samples. . . 48
4.9 (a) Slice of the JFreeChart design. (b) The same slice after the introduction of DefaultLogAxisEditor and the compound refactoring that created
DefaultValueAxisEditor.. . . 50 5.1 The distribution of SOLID/NON-SOLID commits for each project. . . 58 5.2 The decision tree model used for the evaluation. . . 63
Acronyms
AUC: Area Under The Curve. 60
AUROC: Area Under the Receiver Operating Characteristics. 60
CBO: Coupling between objects. 14, 23, 25, 35 CSV: Comma Separated Value. 73
DIP: Dependency Inversion Principle. xv, 9, 11, 12 DIT: Depth of inheritance. 14, 15, 23, 25
IDE: Integrated Development Environment. 6 ISP: Interface Segregation Principle. 9–11
LCOM5: Lack of cohesion of methods 5. 14, 15, 23, 25 LSP: Liskov substitution Principle. 9, 10
NLP: Natural Language Processing. 75
OCP: Open Closed Principle. 9, 10
OOP: Oriented Object Programming. 6, 9, 10, 15
RC: Refactoring Commit. xiii, xv, 5, 20, 23–30, 34, 39–42, 46–50, 52, 53, 55–57, 59, 60, 62, 64, 71, 72, B-iii
ROC: Receiver Operating Characteristics. 60 RQ: Research Question. 4, 8, 53
SRP: Single Responsability Principle. 9, 10
VCS: Version Control System. 2, 3, 7, 12–15, 19, 20, 56, 72, 73 WMC: Weighted methods per class. 14, 15, 23, 25
Acknowledgements
Thank you to my family and my significant other for their support and advice. They were always ready to put things in perspective and help me. I’m very grateful to have them.
I sincerely thanks Doctor Vassilis Zafeiris and Professor Marios Fokaefs for their collabo-ration and mentoring in this research project. Their experience and insights were invaluable in shaping my work and developing my academic collaboration skills.
I also want to thank the DIRO and ESP for their support through my graduate studies. As an international student, I felt very welcomed and accepted in the university’s community. Finally, I want to express an enormous thank you to Michalis Famelis for being an out-standing research advisor, mentor, and person. I’m immensely grateful I had the opportu-nity to work with him for my Master’s degree. He introduced me to the world of research, and I wouldn’t have had it any other way.
Chapter 1
Introduction
Software development is a complex activity. It requires developers to take into account dif-ferent perspectives and often switch contexts that are costly to interrupt [57]. Since the inception of the field, concerted efforts from research, industry, and hobbyists have been made to improve the development experience by seeking to ease out pains and enable de-velopers to make less mistakes, be more productive, be automatically warned about bugs, improve organization, communicate more efficiently, and ensure that existing features do not deteriorate. Innovations such as automated testing and linting have significantly contributed to not only improve program quality, but also decrease some of the load borne by develop-ers by automating these menial tasks. This arrangement can reap benefits throughout the entire lifecycle of applications: developing is facilitated, enabling developers to create better products for the user and for themselves when they do maintenance down the line. Auto-mated testing ensures that the features of an application do not deteriorate when changes are made to the source code and notify developers when they introduce breaking changes. It is typically implemented with a systematic approach, where developers specify the expected behaviors for each component or subsystem. Automated linting enforce coding conventions and by reformatting the source code accordingly, guaranteeing a common code base between developers that is easier to read.
1.1. Modern software development
Nowadays, the software development workflow has evolved to be more agile where a strong emphasis on the creation of working implementation increments is placed in opposition to earlier software development workflows, such as the waterfall model, favoring a detailed
up-front design. These models are seldom used nowadays for a reason: their monolithic structures were not able to scale in terms of turnaround and complexity.
On the one hand, this allows flexibility and rapid development cycles, leaving patches, corrections, and enhancements to be applied post-release. On the other hand, this practice tends to accumulate technical debt [42] and requires a lot of maintenance effort to continue development, leading to a deterioration in non-functional requirements such as design quality (e.g., maintainability, extendibility, understandability).
Although still an integral part of software development with recognized value, careful and detailed design is often neglected in these iterative workflows and is usually postponed for a later time, often after the system has been released. Given the rapidity of development cycles, this inevitably leads to design erosion [82], where assumptions held originally by designers are no longer valid, and design evaporation [66], where knowledge about design is lost.
These methodologies have recognized this shortcoming, and they recommend the exten-sive use of refactoring [63] – typically small, local changes that improve design quality with-out affecting the system’s observable behavior – which can be characterized as post-release changes (i.e., maintenance) to the system’s structure. They aim to prepare the source code for future extensions and functional enhancements, a process known as "preventive mainte-nance" [12]. However, even if the design can be corrected, refactoring activities may not be explicitly recorded, and changes in design are not always reflected in the available documen-tation at hand. This can significantly reduce the developers’ awareness and knowledge of the system, which in turn can hinder several tasks, including onboarding of new developers and communication between stakeholders.
These contemporary software development practices are enabled by the adoption of Ver-sion Control Systems (VCSs). These systems archive code artifacts and integrate themselves into a vast range of development workflows. Their position as a core element of contempo-rary software development processes is not only due to their low barrier of entry and ease of use. Indeed, their main advantage lies somewhere else. They enable developers to look at and interact with the development history of a project. On top of gaining insights about
Thus, we aim to find a solution that enables developers to quickly get informed about the design history of the source code that is relevant to their current task. We want to focus on acquiring design information disseminated through the evolution of the code. Current alternatives are lackluster because they are either based on reading documentation, which is often not up to date and thus not a reliable source of information, or they are requiring developers to sift through heaps of code changes for multiple files, which is error-prone and very time-consuming. We sketch the concept in Fig. 1.1 where specific commits relevant to design are highlighted from the other changes registered in the version history.
1.3. Research Questions
We define the goal, purpose, quality focus, perspective, and context of our study according to the guidelines defined by Wohlin et al. [85]. The goal of our study is to analyze metric fluctuations brought by commits for the purpose of evaluating the relationship between refactoring, fluctuation of internal quality metrics, and design intent. The quality focus is on the effectiveness of employing refactoring and metric fluctuation data for the identification of commits that involve SOLID design principles which are crucial for shaping system design. Study results are interpreted from the perspective of researchers with interest in the area of software design and development processes as well as programming practitioners. The results are of interest to developers that need to understand the design of a project through studying important milestones in its evolution and by software architects seeking to review design decisions in committed code in order to confirm their architectural conformance. The context of this study comprises change and issue management repositories of a set of open source projects.
We articulate a series of empirical studies with the following Research Questions (RQs): (1) How does refactoring impact internal quality metrics and design?
(2) Can we classify the changes in internal quality metrics?
(3) What is the effect of environmental conditions to metric fluctuations?
1.4. Approach
"Design" is a notion intuitively understood by humans and developers alike. However, the concept englobes several layers and components in the context of software development. While our end goal is to provide information about design changes in general, we have to scope out a reasonable target for this exploratory research. Thus, we choose to use design principles as the embodiment of design changes. Design principles are sets of well-established guidelines used by developers to guide them in the practice of agile design [55]. They help identifying and removing design smells that impact the flexibility, reusability and maintainability of software systems.
To achieve this, we first need an intuition about what can characterize these changes in design. We know that refactoring is used to change non-functional aspects of software to facilitate future extensions and reverse design erosion and that we can measure source code to approximate internal qualities of a software [41].
Thus, we begin by exploring commits containing refactorings, which we call RCs. Refac-toring has been extensively studied for its impact on design quality [1, 74], and influence on developer habits with respect to its application on software systems [80, 70]. Such stud-ies have focused primarily on the identification of refactorings and refactoring opportunitstud-ies and on analyzing their impact on design, in terms of the presence of code smells [29, 79] or the fluctuation of code metrics [53]. The resulting consensus is that refactoring impacts the design of a system in a significant way. This relationship is not incidental: developers purposefully use refactoring to express specific design intentions [70] and use recommender systems to identify the most suitable refactorings to best suit their intents [7]. Refactoring activity can carry various kinds of design intent, including but not limited to: removal of code smells, resolution of technical debt, the introduction of design patterns, and application of design principles.
We propose to use fluctuations in metrics brought by the code changes from one commit to another to classify different kinds of refactoring activity. We assume that when a RC affects multiple metrics, improving some while deteriorating others, we have evidence of a developer intentionally changing the design (design intent) by making specific tradeoffs.
If this assumption holds, we have a good prior to use fluctuations in metrics and their tradeoffs as indicators of design related changes. From there, we have a sound rationale
to make an experiment where we try to predict the presence of the application of design principles in commits using metric fluctuations.
To test the assumption, we conduct an initial study on JFreeChart, a library for displaying graphical charts in applications [26], using a qualitative analysis. We look at the correlation between a selection of internal quality metrics and the design changes introduced in RCs. Furthermore, we dive deeper into the effect of internal quality metrics changes on different development contexts in a quantitative analysis and we also refine our comprehension of the relation between refactoring and design changes, specifically changes susceptible to embody a design decision, in a third preliminary study. Once the hypothesis is tested, we train a general model on a dataset of annotated commits using supervised learning and evaluate the capacity of the model to recognize the application of the SOLID design principles, a set of design principles commonly used in Oriented Object Programming (OOP), in commits from new projects (projects that were never seen during training).
Our approach is based on existing theories such as internal quality metric measure-ment [20] and quality characteristic appreciation [6], and we follow the open source principle of considering the code as the most authoritative source of design information [24]. We use a mixed-method approach, consisting of several exploratory case-driven archive analysis, and comparative explorations. We envision our work as complementary to other approaches for extracting tacit and contextual design knowledge such as from discussions [83], and commit messages [18].
1.5. Potential future benefits
In this section, we present the multiple hypothetical benefits of our proposal.
Our proposal could provide developers with an approach that enables them to filter out code changes that are not relevant to design. They would be able to quickly see the relevant last commits affecting the design and understand why it was changed, e.g., a response to the introduction of a new feature or a bug fix. This comprehension allows them to contribute relevant code changes that make use of the existing design efficiently. Moreover, when applied to an Integrated Development Environment (IDE), we could imagine a dedicated pane that would provide developers an overview of the moments in time when the design changed for the software artifact (e.g., a file, a class, a model) they are currently editing, helping the
developer in his exploration and comprehension of the artifact, and allowing him to quickly go back in time or get more information if he interacts with one of the moments in time displayed.
This approach could also be applied to the code reviewing process where developers are assigned changes made by other developers to review [52]. This practice is a staple in major software companies [52]. It allows to catch bugs early and fosters a shared knowledge of the system among its developers. By integrating our approach into the review process, we could detect when a set of changes is susceptible to contain design changes and warn the developers that an increased attention should be given for these code changes. Reviewers would be able to see the modifications to the design and conduct sanity checks to make sure that changing the design is the best solution. Moreover, this application provides a good opportunity to include a feedback mechanism that would help our system to improve its predictions as reviewers use it.
Another benefit would take place during the onboarding process where new developers get acquainted with the software systems. Our approach would help them identify key moments in the construction of the software, informing them about the motivations behind the present architecture and state of software which they wouldn’t have otherwise with their minimal experience.
Ultimately, we want to generate a descriptive, history-based meta data for each code artifact that could be used by developer and other stakeholders to synthesize documentation, and to empirically assess software and software projects and make informed decision. With this research, we take the first steps towards this direction.
1.6. Contributions
We make the following contributions:
(1) A systematic methodology to mine internal quality metric fluctuations from VCS. (2) An open source toolchain that implements it, called MetricHistory [78].
(3) A deep qualitative analysis of the revisions containing refactorings in one open source project, JFreeChart.
(4) A quantitative study of the metric fluctuations in 13 open source projects. (5) A scheme for classifying metric fluctuations.
(6) A public data repository of historical internal quality metric fluctuations.
(7) A manually annotated dataset composed of 928 commits identifying the presence of SOLID principles.
(8) A procedure to build and train a classifier to detect SOLID principles in version histories and its empirical validation.
(9) A general model that can identify the application of the SOLID principles in commits. (10) The outline of an approach for filtering a project’s revision history to a set of revisions
that have a high likelihood to carry design intent.
1.7. Structure of the thesis
The thesis is organized as follows. Chapter 2 explains the core background concepts. In Chapter 3 we illustrate the overall design of the studies as well as the processes used to gather the various data used throughout our research. Then, in Chapter 4 and Chapter 5 we describe the studies performed to test our assumption and answer the RQs. We present the related work in Chapter 6 and summarize our findings and discuss future work in Chapter 7.
1.8. Work attribution
The research presented in this thesis is an international study project with Prof. Michalis Famelis, Prof. Marios Fokaefs and Dr. Vassilis Zafeiris. Particularly, Dr. Zafeiris collabo-rated with me in building the annotated datasets (Section 4.1, 4.3, 5.1), distributing mining workload across different computers (Chapter 3), analyzing the effect of releases on metric tradeoffs (Section 4.2.2.3).
Chapter 2
Background
2.1. Software Design
Software design is the process following the requirements collection and preceding the implementation of a system or its components [33]. The purpose of this activity is to create a structure of the program, similarly to an architect drawing the plans for a new building, that satisfies the requirements established previously. However, the designer also has to balance other considerations such as extensibility, modularity, and maintainability that will affect the software’s quality in the long term. Balancing the expectations of multiples stakeholders is difficult and it is impossible to satisfy everybody. To mitigate the risks and focus on the right design areas, developers use design principles such as SOLID principles in OOP and design patterns as heuristics to guide them [9, 55].
2.2. SOLID Principles
The SOLID principles are a set of well known design principles in the oriented object community. It is composed of five principles: Single Responsability Principle (SRP), Open Closed Principle (OCP), Liskov substitution Principle (LSP), Interface Segregation Principle (ISP), DIP [54]. The SOLID principles are meant to guide the practice of agile design by helping to identify and remove design smells that impact the flexibility, reusability and maintainability of system design. In theory, the implementation of decisions based on SOLID principles is performed with manual or automated refactorings.
SRP specifies that a software artifact such as a class, method or package should only have one responsibility, or in other words, only one reason to change. This principle encourages
the separation of concerns which contributes to increasing the cohesion of artifacts and decreasing their coupling with other elements. For example, if a class handles the creation and logging in of users, an application of SRP could lead to split the class in two. One class would now have the responsibility of creating users and the other one would have the responsibility of logging them into the system. This way, if the creation procedure changes, the class handling logins will be left untouched, reducing the chance to induce bugs and facilitating the work of developer.
OCP, credited to Bertrand Meyer [58], specifies that software artifacts should be open for extension but closed for modification. The idea is to reuse existing components by extending them to new needs rather than modifying them directly. The advantage of this concept is to avoid problems stemming from modifying artifacts that are used by multiple components inside a system. If you modify the original artifact it will change the behaviors of the dependents in unforeseeable ways which often lead to regression problems and backward incompatibilities which are hard to solve. By extending the artifact’s features, you do not touch the original behavior. A very popular example is the use of polymorphism in object oriented languages such as Java. The developers can change the behavior of a base class by implementing a subclass. For example, you can extend a class representing a collection of heterogeneous elements through a subclass to implement the concept of a mathematical set. The newly created subclass is still representing a collection but it is now enforcing particular semantics.
LSP is a concept introduced by Barbara Liskov [50]. In the context of type theory in OOP, it specifies, that for a type T and a subtype S, the objects of type T can be replaced by objects of type S without changing the behavior of the systems where T was expected. This principle can be applied to several situations in practice such as mixed instances cohesion problems [64]. This problem arises when a class’s feature is provided in at least a couple of implementations in its instances. The consequence is that the instances will have some attributes or methods that are undefined or have unexpected secondary effects. By applying LSP, the class will be transformed into a base class T and each implementation is sent to a subtype S, ensuring a consistent behaviour for the feature provided by the class.
ISP specifies that is it better to have multiple interfaces, each dedicated to one aspect of a feature or concept, rather than one big interface between two clients. This principle
also promotes a separation of concerns and aims to improve cohesion. As an example, we will model a modern printer. Modern printers have multiple capabilities such as scanning, printing, and sometimes faxing. It can be tempting to create one interface regrouping all these functionalities as an "All in one Printer " and implementing our "Modern Printer " after it. Now, you reuse the interface to implement a simple machine that only prints. It leaves you with two features from the interface your "Simple Printer " can’t provide and you have to code work-arounds to handle these impossible cases. By using ISP, you can handle this situation elegantly by separating the All in one Printer interface in three: "Printer ", "Scanner ", "Fax " and adapting Modern Printer and Simple Printer in consequence. The former will implement all three interfaces while the latter will only need to implement printer. DIP encourages developers to build components in such a way that they depend on abstractions rather than implementations. More specifically, high level components should not depend on lower level components. The consequence entails that abstractions will not depend on details, guaranteeing the generalizability, but details depend on abstractions, therefore inverting the traditional dependency relationship where the main component of a system would depend on detailed components. Developers usually implement this principle by adding a layer of abstraction between dependencies. For example, in a system where the class Printer depends on a class "Paper Tray" as shown in Fig. 2.1 a), we would abstract Paper Tray behind an interface such as "Paper Supplier ". This way, the higher level com-ponent, Printer, would only about Paper Supplier and not the lower level component Paper Tray as illustrated in Fig 2.1 b). When the components are grouped in different modules, it is possible to push the principle even further by reorganizing the location of the abstraction. In our example, Printer is in a module "machine" and Paper Tray, as well as Paper Supplier are in a module "supplies". This is quite a natural way to group elements as they belong the same concept. However, this layout introduces a dependency between the machine and supplies because Printer depends on Paper Supplier, which contradict DIP as we can con-sider that the former still represents a higher level than the former. We solve this problem by moving the Paper Supplier interface to the module machine as shown in Fig. 2.1 c). Now dependencies are fully inversed as the lower level component, Paper Tray, depends on a the higher level concept, Paper Supplier as it is now close to the class Printer and also its only dependency.
VXSSOLHV PDFKLQH
VXSSOLHV PDFKLQH
3ULQWHU 3DSHU 7UD\
3ULQWHU 3DSHU 6XSSOLHU
3DSHU 7UD\
3ULQWHU
3DSHU 6XSSOLHU 3DSHU 7UD\
E D
F
Fig. 2.1. Illustration of the application of DIP on a toy example. The colored arrow repre-sents the dependency between a high component (left) and a lower level component (right). Note how the arrow changes direction from layout b) to c).
2.3. Version Control Systems
VCS are software systems that record changes to a set of files over time in an automated fashion. Originally, most developers would copy and date the files they wanted to "save" into another folder on their computer. However, this technique doesn’t scale well and is not practical when collaborating with other developers. VCS solves these issues by providing developers an easy way to store changes and share their code with other colleagues that can also propose changes into a ledger, commonly referred to as the "changelog", where all changes are recorded. Developers also gain the capacity to go back to any change they made and branch out from there, building an alternate version of the software.
Moreover, a software project under version control is referred to as a "repository". A new entry to the changelog, in the form of a set of changes in the source files, is called a "commit" or a "revision" depending on the terminology used by each VCS. A "tangled " commit denotes instances where multiple unrelated sets of changes are cohabiting in the same commit, although the changes could be partitioned in different commits [32, 72]. On the opposite, clean or tangle-free commits, have only one set of auto-contained, cohesive changes.
Some VCSs provide distributed versioning, enabling developers to commit changes locally on their system and then share their changes to a remote repository accessible by others. Examples of known and popular VCSs include Git [16], Subversion [21], and Mercurial [51].
2.4. Mining Software Repositories
Mining of Software Repositories is a method of archival research where researchers look at the evolution of the artifacts in the project through time [15]. The adoption of Open Source and VCS enables researchers in software engineering to study the evolution of a software project in terms of specifications, source code, social interactions between developers, and bugs from its inception to present days. To study these, they use the process of mining, which is the systematic extraction of information relevant to the subject of study in the version history of a project [39]. For example, it is common to examine the changes in files or the VCS meta-data. Recently, the community has done substantial work on software defects and studying the dynamics of Open Source collaboration [19].
Historically, this technique is based on early ideas of Ball et al. [5], where they make the argument that VCSs contains a lot of useful contextual information by exploring the evolution of class relationships through time. Shortly after, an approach was implemented by leveraging the changes in between versions characterized by software releases with ad-hoc toolchains to detect logical coupling [25]. Then, later studies introduced experiments using a smaller granularity of versions such as commit to commit. The early work of Zimmerman et al. is an example where they leveraged VCS information to detect files commonly changed together and propose recommendations [87]. More recently, initiatives such as GitHubTor-rent [28] democratized this practice by offering convenient facilities for researchers to select and retrieve massive amounts of VCS meta-data from version control systems.
Compared to them, we focus our efforts on extracting software metrics and their fluctu-ations instead of analyzing the VCS meta-data or file-based changes. Another difference is that our approach works at scale with the combination of our versatile tool and its integra-tion to a distributed computing system with Akka, a framework to build powerful reactive, concurrent and distributed applications more easily [47].
However, software repository mining is not an approach suitable for every type of study. Especially when working with public repositories, which are known to be often personal projects, or sometimes are not even related to software development but used as a data stor-age service. Moreover, even legitimate software projects can be problematic since their devel-opment workflows are sometimes coupled with private tools such as bug trackers or project management systems. These tools contain valuable information about the development and history of a project, but they are often inaccessible to repository miners. Thus, when mining software repositories, researchers have to be careful about the provenance and the relevance of the repositories, and their data with respect to the objective of their research[40, 17].
2.5. Metrics
We compute the metrics to measure the changes in the projects using SourceMeter, a static analyzer that supports a wide variety of metrics and granularities (e.g., method, class, package) [20]. For this study, we focus on class metrics. SourceMeter offers 52 metrics for classes, distributed in 6 categories: cohesion metrics (1), complexity metrics (3), coupling metrics (5), documentation metrics (8), inheritance metrics (5), size metrics (30) with the respective number of metrics for each category. The detailed documentation for each metric and how it’s calculated is available on SourceMeter’s publisher website [3].
In Chapter 4, we use a subset consisting of four metrics: Coupling between objects (CBO) to measure coupling, Depth of inheritance (DIT) for inheritance complexity, Lack of cohesion of methods 5 (LCOM5) for cohesion, and Weighted methods per class (WMC) for method complexity. These metrics were selected in a process explained in the aforementioned chapter.
CBO measures coupling between objects by counting the number of classes a class is de-pending on. A high count indicates that the class is linked to many others which can cause maintainability problems such as a brittle reliability when the dependencies change often.
DIT measures inheritance complexity by counting recursively the number of subclasses a class has. In other words, it measures the length of the path to the deepest ancestor. The deeper the inheritance tree runs, the harder it is to modify or reuse the elements of the hierarchy because they become very specialized and depend on their parents for function-alities. LCOM5 measures class cohesiveness by counting the number of methods linked to the same attribute or abstract method as OOP practices advise that a class should only have one responsibility. If multiple methods do not share the same attributes or abstract methods, it creates groups of methods that are indicators of a fragmented class. The higher the lack of cohesion is, the lowest the responsibility of the class is crisply defined, often resulting in brittle implementations of features that do not actually belong together. Finally WMC, measures the complexity, in terms of independent control flow path, for a class. It is calculated by summing up the McCabe’s Cyclomatic Complexity [56] for each method and the init block of a class. The higher the number, the harder it is to understand, and thus verify and maintain, the class and its methods because of the number of different control flow paths available.
2.6. Summary
In this section, we introduced the core concepts we rely on in our research. Software design represents the end phenomenon we are trying to capture and recover. However, the notion of software design, while well-defined, can be somewhat abstract in practice. Thus, we use the SOLID design principles as a concrete and measurable manifestation of software design concerns. In addition, we rely on VCSs as the framework that allow us to retrieve the evolution information of a software project as its history of change is recorded through it in the form of commits. Our study is guided by the principles and methodologies developed for research in the area of Mining Software Repositories. Finally, we introduce the metrics we use to characterize the source code changes happening between versions.
Chapter 3
Data collection
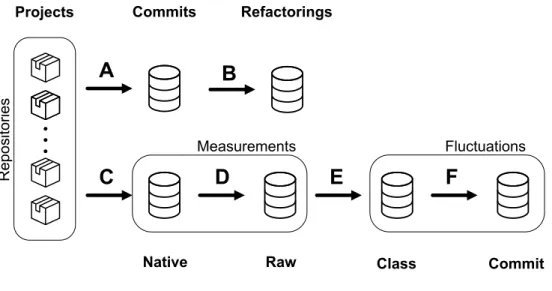
In this chapter, we present our overall study design. We describe our processes and the different datasets created. We specify the scope, the population and its sampling, and the data collection techniques. Our approach consists of six steps: A) Commit selection, B) Refactoring identification, C) Mining metrics D) Converting metrics’ format, E) Computing changes, and F) Aggregating metrics. We detail them in the following sections. Fig. 3.1 provides an overview of our approach and datasets.
3.1. Design
3.1.1. Unit of analysis
Our unit of analysis is the commit or revision. In version control systems, a revision represents the list of differences for the files that changed in the project from a previous – also known as parent – version to the next version. Revisions are groups of incremental changes between a pair of versions, each revision represents an atomic unit of work, usually containing a cohesive set of changes although it is not always the case in practice [2]. We can think of the list of revisions of a project as its evolutionary history; each revision embodies a version of the software.
3.1.2. Target population
We aim to understand the patterns of metric fluctuations in software projects written in Java under version control. The target population of our study is therefore the set of all revisions present in the version histories of such projects. The version history contains the incremental changes applied to the project until its latest state of development as explained in the previous paragraph.
3.1.3. Sampling technique
We selected revisions from the version history of a sample of 13 popular open-source Java projects. The selection was conducted using a mix of convenience, maximum variation, and critical sampling based on a blend of several attributes such as projects’ popularity amongst developers, usage as research subjects, size, number of contributors, platform, development style, and type (e.g., library, desktop application). Each project has a website and a public repository of source code under an arbitrary version control system – The type of the VCS was not a criterion.
3.2. Project selection
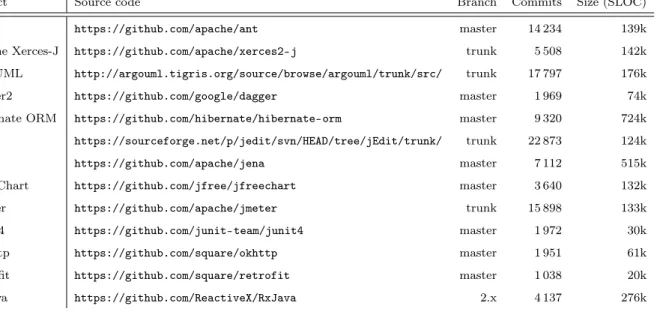
We selected 13 popular open-source Java projects. The projects are listed in Tab. 3.1 with the branch, source code location, number of commits mined and size. The projects also came with optional issue trackers, mailing lists, forums, or changelogs (i.e., files maintained by developers to keep track of changes happening in commits). For projects that use Subversion
Tab. 3.1. List of the software projects retained.
Project Source code Branch Commits Size (SLOC) Ant https://github.com/apache/ant master 14 234 139k Apache Xerces-J https://github.com/apache/xerces2-j trunk 5 508 142k ArgoUML http://argouml.tigris.org/source/browse/argouml/trunk/src/ trunk 17 797 176k Dagger2 https://github.com/google/dagger master 1 969 74k Hibernate ORM https://github.com/hibernate/hibernate-orm master 9 320 724k jEdit https://sourceforge.net/p/jedit/svn/HEAD/tree/jEdit/trunk/ trunk 22 873 124k Jena https://github.com/apache/jena master 7 112 515k JFreeChart https://github.com/jfree/jfreechart master 3 640 132k JMeter https://github.com/apache/jmeter trunk 15 898 133k JUnit4 https://github.com/junit-team/junit4 master 1 972 30k OkHttp https://github.com/square/okhttp master 1 951 61k Retrofit https://github.com/square/retrofit master 1 038 20k RxJava https://github.com/ReactiveX/RxJava 2.x 4 137 276k
(jEdit, ArgoUML) as their VCS, we first migrated their version history to Git using GitHub Importer [27].
3.3. Commit selection (A)
After downloading the projects onto disk, we extracted the commits from the default branch of each of the 13 projects until 2018-12-31 (included). A branch represents an inde-pendent line of development [11]. We focus on the default branch because it is often this rendition of the development that will be released to the public. It represents the mature code changes of a project. From this set, we exclude commits that are the results of a merge operation. In VCS, “merging” means to integrate all the changes from a “source” branch to a “destination” branch in a single commit. The resulting commit is generally hard to read for humans and presents little interest for analysis as the individual changes can be found on the source branch.
We used the following command to obtain the list of commits to be analyzed for each project (where <branch> is the name of the default branch):
git log < branch > -- pretty ="% H " -- no - merges -- until ="2018 -12 -31"
Overall, the 13 projects represent a cumulative 107 449 versions of projects spanning 20 years of software development history.
3.4. Refactorings (B)
As explained in the introduction, our study is interested in the refactoring activity of de-velopers. To isolate the revisions containing refactorings, we used RMiner [81], a specialized tool that can detect refactorings automatically in the history of a project with high recall and precision compared to other similar tools, such as RefDiff [69]. We ignore refactorings related to tests because we are not studying the role of tests in a software’s design. The refactoring detection yields a list of revisions containing at least one refactoring. Henceforth, we refer to these revisions as RC. Each of these RC is also accompanied by a detailed list of the refactorings it contains.
3.5. Native dataset (C)
We used SourceMeter [20] to calculate the software metrics for individual revisions. We automated the execution of SourceMeter to run in batch multiple commits of a project with our command line tool MetricHistory [78].
Calculating the metrics for thousands of revisions is a computationally intensive task, especially for large projects (e.g. jEdit, Hibernate ORM). It can be seen as the equivalent of calculating the metrics for 107 449 projects. To accommodate this process, we built a distributed computation system based on the Akka toolkit and runtime [47]. Each compu-tation node invokes MetricHistory tasks to calculate the metrics for individual revisions of a project. Job assignment is performed by a scheduler node that also collects and stores the results in a data repository.
MetricHistory is an extensible tool designed to collect and process software measurements across multiple versions of a code base. The measurement itself is modular and executed by a third party analyzer, in the case of this study we use SourceMeter. The core design principles of MetricHistory is to integrate into any toolchain using its command line interface or Java API. It also aims to be easily customizable by its modular architecture. For example, adding a new analyzer or supporting another VCS only requires to implement an interface. MetricHistory is also operationally modular to accommodate the explorative workflows of researchers. The results of each step mentioned in this chapter can be saved or recomputed at any moment so one can resume from any point in their workflow and interchange data between steps. In the case of the aforementioned distributed setting, each worker goes
through all the steps at once for one commit only. However, if you have a computer powerful enough or a smaller number of projects, it also support to calculate all the measurements for one step for all commits in batch manner and save the results for a later use, or analysis through a custom toolchain. A detailed description of MetricHistory’s features, installation, and usage is presented in Appendix A.
3.6. Raw dataset (D)
Since MetricHistory can make use of different analyzers – each with their own output format – we make a distinction between the format of the metrics used to calculate the fluctuations and the output format of our analysis tool. Supporting this transient step make our toolkit modular, allowing future use of, not only different analyzers, but also pre-compiled measurements from other researchers and studies.
Using MetricHistory again, we convert the class measurements into a common basic "RAW" format. This scalable file format identifies the measurements for a given artifact through multiple versions. This dataset contains the metrics generated by SourceMeter for each class (identified by its canonical name i.e. com.example.F ooBar) for each version obtained in step A. You will find below the 5 first lines of typical raw file. Only three metrics are shown for readability.
commit;class;LOC;CBO;DIT
9b23cc2184438f93923c972c45b7caeb43d77d24;org.animals.CowRenamed;19;2;1 9b23cc2184438f93923c972c45b7caeb43d77d24;org.animals.Dog;13;1;2
9b23cc2184438f93923c972c45b7caeb43d77d24;org.animals.Labrador;124;0;1 9b23cc2184438f93923c972c45b7caeb43d77d24;org.animals.Poodle;24;5;1
For projects with a large number of commits to analyze, we can separate the results by commit. In other words, we create one file for each commit instead of writing all the results into a single file for all commits and classes.
3.7. Fluctuations dataset (E)
Using the transformed data acquired in D, we use MetricHistory to compute the change of metric for each class from each commit in A. For example, if class Foo’s LOC metric is measured as 3 in commit 1 and is measured at 5 in commit 2, the change of metric LOC
for Foo in version 2 is of 5 − 3 = +2. Commit 1 is the set of code changes directly before commit 2, also referred as the "parent" commit.
3.8. Aggregation (F)
The last step converts the metric fluctuations for each class (class fluctuations) into metric fluctuations describing the changes in a commit (commit fluctuation). We aggregate the fluctuations of each metric across every changed class into one value per metric using a naïve summation. For example, if commit 2 has classes Foo and Bar that have changed with the metric fluctuations for metric LOC as +20 and +30 respectively. Then the metric fluctuation at the commit level will be 20 + 30 = +50.
We note two crucial details. First, we only retain the metric fluctuations from classes that have changed; we ignore classes that were added or deleted in order to capture design changes inside classes and not inside a package or group of components. Second, we count the number of metrics that are affected by a change during the aggregation process. This prevents metrics changes to disappear at the commit level (the sum is 0) when metric fluctuations at the class level are cancelling each other.
3.9. Summary
In this Chapter, we presented our pipeline and the datasets collected. Once the projects are identified, the first steps are to determine the commits to include for each project (A) and then find the commits in this selection that contain refactorings (B). Then, using MetricHis-tory, we extract the metrics at each commit for all projects to create the native dataset (C). After that, we use MetricHistory to transform the native dataset in the raw dataset that contains the metrics for each class across all commits (D). At that time, we create the fluctuation dataset that contains the metric fluctuations for each class for all commits (E). Finally, we aggregate the class fluctuations with a summation operator to create the metric fluctuations to represent individual commits (F).
Chapter 4
Exploratory studies
In this section, we are interested to lay the basis of knowledge regarding metric fluctuations and determine if our hypothesis presented in Chapter 1 is sound. We hypothesized that when a RC affects multiple metrics, improving some while deteriorating others, we have evidence of a developer intentionally changing the design (design intent) by making specific tradeoffs. Specifically, we explore the concept of metric fluctuations and their relation to development activities in the context of design. We conduct three experiments from the datasets created through the approach presented in Chapter 3.
The first experiment is a qualitative study on a subset of commits of JFreeChart where we classify revisions into four categories based on the pattern of the metric fluctuations. We focus on RCs because they are likely to contain intentional structural changes from developers. We then manually analyze each commit to understand its changes and their relation to the categories. In the second experiment, we conduct a quantitative study where we analyze all the commits of the 13 projects under different lenses to test the generalizability of metric fluctuations. Finally, in a third experiment, we look at the capacity of metric fluctuations to act as indicators for design related changes, specifically design intent, in a sample of commits. In the subsequent explorations, to detect and characterize changes in the software’s de-sign, we measure its internal quality properties using multiple metrics. We focus our analysis on four metrics on the interval scale: CBO to measure coupling, DIT for inheritance complex-ity, LCOM5 for cohesion, and WMC for method complexity. We focus on this small set of metrics as they are considered some of the most representative for their particular properties and good indicators of design quality [53, 74]. In addition, to locate intentional changes, we scope our exploration using refactorings as they are embodying conscious changes made by
developers [70]. Finally, when coupled with our aforementioned hypothesis, it means that commits containing tradeoffs expressed by metric fluctuations have a strong likelihood to be indicators of the implementation of design decisions made by the developers.
By characterizing the metric fluctuations across the history of development, we aim to provide a baseline for understanding changes to identify development activities, and facilitate the detection of specific change patterns that can be relevant as documentation to developers or other stakeholders.
4.1. Exploring JFreeChart
In this section, we present an exploratory study to estimate RCs’ contributions to design quality through the use of internal quality metrics. We studied the development history and refactoring activity of JFreeChart1, a well-studied [1, 86] software project in order to answer RQ1.
4.1.1. Setup
4.1.1.1. Project selection
We selected the open-source project JFreeChart. It provides a chart library written in Java which enables developers to integrate professional-looking charts in their programs. This project has been studied extensively by the refactoring community [1, 86]. Its medium size (∼600 classes) and history (over 10 years old) is ideal. It is big enough to be relevant in quantitative analysis, while being small enough to allow manual and qualitative analysis. Its size may also support relatively strong conclusions and help to guide our future studies. The project has been used by a variety of applications from different domains over the years and is still actively developed2.
4.1.1.2. Objects
The JFreeChart project is composed of two source code repositories, two bug trackers, mailing lists, a forum, and a website:
Repositories
1http:/www.jfree.org/jfreechart/
• https://sourceforge.net/p/jfreechart • https://github.com/jfree/jfreechart Bug trackers
• https://sourceforge.net/p/jfreechart/bugs • https://github.com/jfree/jfreechart/issues
Mailing lists: : https://sourceforge.net/p/jfreechart/mailman Forum: : http://www.jfree.org/forum/index.phps
Website: : http://www.jfree.org/jfreechart/
This project has a particularity: The development started on SourceForge and was then imported to GitHub. However, the content of the bug tracker was not imported to GitHub at once; they gradually stopped using the one provided by SourceForge and moved gradually to the one provided by GitHub. As a result, the source code and the issue repositories are split between the two platforms.
Thus, we selected all the revisions available on the GitHub repository before 2018-05-01. This selection contains 3 646 revisions covering over 10 years of development in a mature project. Each revision is characterized by its source code, comments, commit message, and updates to the changelog (this artifact is edited by the developers to detail the modifications to the source code for every revision; it is stored in the same repository as the source code).
4.1.2. Computing the dataset
Using the procedure described in Chapter 3, we calculated the metric fluctuations at the commit level for all commits in the GitHub repository before 2018-05-01 for the metrics CBO, DIT, LCOM5, and WMC. These quadruples are further used to proxy the direction of change in internal design quality. The focus is on the direction of change that constitutes a trend, rather than on change magnitude. To better understand such trends, we defined four intuitive scenarios to classify the patterns of activity for a RC, given the metric changes. These scenarios are described in the next paragraphs and summarized in Tab. 4.1.
Scenario 1: RCs with no change in metrics. An example of this scenario is a revision where a refactoring was found to have been applied, but no change in any of the selected metrics was found. This is the case for refactorings like renames. Based on the metrics we have selected,
Tab. 4.1. Summary of the scenarios Scenario Definition
1 No metric changes 2 One metric changes
3 At least two metrics change, and the changes are in the same direction (all improve or all worsen) 4 At least two metrics change, and the changes are in mixed directions (some improve and some worsen)
Scenario 1 instances are not normally expected to represent important design decisions, but rather pure functionality addition or understandability enhancements.
Scenario 2: RCs with a change in a single metric. In this scenario, we include RCs that affect a single metric, positively or negatively. Especially, in the case of positive impact, these instances could correspond to targeted changes to specifically improve the particular metric. While this shows clear intent, the intent is not necessarily related to design decisions. Scenario 3: RCs where all metrics change monotonically towards improving or declining direction. This scenario includes RCs where more than one metric was impacted. A special inclusion condition is that all the affected metrics should have changed towards the same direction, either all positively or all negatively. Similar to Scenario 2, RCs in this scenario show clear intent. However, due to the scale of change and the impact on metrics, the intent is more inclined to be closer to a design decision.
Scenario 4: RCs where multiple metrics change in different directions. Scenario 4 is the same as Scenario 3 in terms of multiple metrics being affected, with the important difference that not all metrics change towards the same direction. One popular example is the metrics for cohesion and coupling, which in many cases change at the same time, but in opposite directions, especially during remodularization tasks [74]. In our view, these instances are the most interesting ones, as they indicate conflicting goals.
In the context of our work, we call instances of Scenario 4, "design tradeoffs". Indeed, we established earlier that changes in internal quality metrics in opposite directions translate to tradeoffs in internal quality, which are likely to capture design tradeoffs.. In practice, a design tradeoff is a situation where a change, i.e., a refactoring action, would result in a controversial impact to design quality; while some dimensions are improved, others may deteriorate. In this situation, the developer will have to make a decision as to which metrics and quality aspects are more important than others (given the current requirements) and
eventually settle for specific tradeoffs. This is why we consider instances in Scenario 4 to be closely related to design decisions. It is also possible that design decisions also appear in instances of Scenario 3, where there is no tradeoffs but a clear direction of changes measured. 4.1.3. Manual Evaluation
We manually analyzed each RC to identify the design intent behind applied refactor-ings. We based our analysis on code and comment inspection, commit messages, and the changelog of refactored classes. Specifically, we studied the developers’ design intent from two perspectives:
(1) The involvement of design decisions in the refactoring process, i.e., whether the de-veloper applied the identified refactorings as part of introducing new design decisions or enforcing design decisions that were established in previous revisions.
(2) The type of implementation task the developer was engaged in, while changing code structure through refactoring, i.e., whether any design decisions were enforced as part of (a) refactoring low quality code, (b) implementing new features, or (c) fixing bugs. The detection of design decisions in RCs is a rather challenging task since it requires understanding not only the changed code parts, but the overall design of affected classes. Moreover, determining whether a set of refactorings enforce a past design decision, requires tracing back to previous revisions of refactored code. A successful strategy to improve this process was to begin the analysis with the oldest refactoring and then go forward in time: This helps the reviewer to understand the evolution of the design. Additionally, the developers of JFreeChart scrupulously maintain a changelog of their source code changes at the project and file level, giving us insights about their intents.
In order to reduce the subjectivity of this process, the evaluation was performed inde-pendently by two of the authors and it was followed by a strict conflict resolution procedure. The inter-rater agreement between their assessments was initially moderate, indicated by a value of 0.49 for Cohen’s Kappa [14, 43].
4.1.4. Results
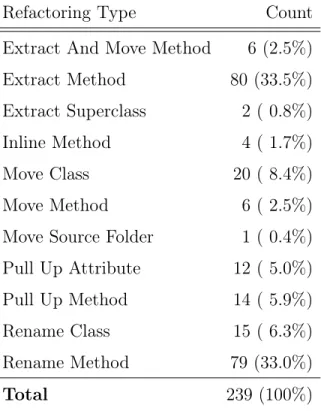
We have automatically analyzed 3 646 commits in the version history of JFreeChart with an extended version of RMiner [81]. The tool identified 247 refactoring operations in the production code that were distributed across 68 revisions. The automatically identified
Tab. 4.2. Refactoring operations in JFreeChart
Refactoring Type Count
Extract And Move Method 6 (2.5%)
Extract Method 80 (33.5%)
Extract Superclass 2 ( 0.8%)
Inline Method 4 ( 1.7%)
Move Class 20 ( 8.4%)
Move Method 6 ( 2.5%)
Move Source Folder 1 ( 0.4%)
Pull Up Attribute 12 ( 5.0%)
Pull Up Method 14 ( 5.9%)
Rename Class 15 ( 6.3%)
Rename Method 79 (33.0%)
Total 239 (100%)
refactorings were manually validated and eight of them (7 cases of Extract Method, 1 case of Rename Method) were rejected as false positives. The refactoring revisions containing them did not include any true positives and were also rejected from further analysis (4 revisions). Tab. 4.2 presents the distribution of true positives to different refactoring types in the 64 remaining RCs. The 64 RCs were further processed in order to measure the differences of internal metrics for all changed classes, as explained in Section 4.1.2.
We then automatically classified each RC to one of the four scenarios introduced in Section 4.1.2. We show the classification in Tab. 4.3. Noticeably, a large part of RCs (29.7%) do not involve changes to internal metrics (Scenario 1). Source code changes in these revisions are due to rename and move class refactoring operations. RCs with a single changed metric (Scenario 2), amount for 35.9% of total revisions. These revisions involve mainly extract method refactorings that affect the WMC metric. Revisions classified to Scenario 3 make up 25% of the total. In them, developers applied a more extensive set of refactoring operations, such as Move Attribute/Method, Extract Superclass, and Move Class. Such refactorings have a combined effect on internal metrics, either improving or deteriorating all of them. Finally, we found that in 9.4% of RCs multiple metrics are changed towards
Tab. 4.3. RCs for each Scenario Scenario Revisions (%) 1 19 (29.7%) 2 23 (35.9%) 3 16 (25.0%) 4 6 ( 9.4%)
Tab. 4.4. Implementation tasks and RCs
Task type Revisions (%)
Refactoring 30 (46.9%)
Feature Implementation 29 (45.3%)
Bug Fix 5 ( 7.8%)
different directions. Such revisions usually involve design tradeoffs, i.e., improvement of a design property of one or more classes at the expense of deteriorating another. For instance, a Move Method refactoring may improve the cohesion of the origin class at the expense of increasing the coupling of the destination class.
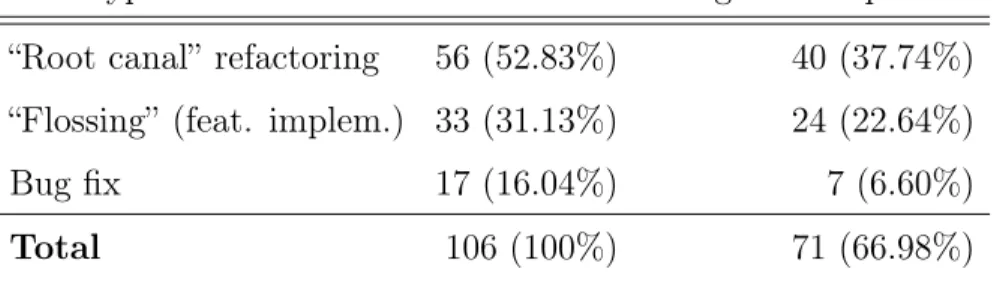
We summarize the types of implementation tasks that developers were involved in RCs in Tab. 4.4. We determined the type of implementation task through inspection of code differences combined with analysis of commit logs, and embedded change logs of refactored classes. In several cases, commit and change logs included references to issue tracking iden-tifiers. Revisions with a pure refactoring purpose (termed “root canal” by [61]) correspond to 46.9% of total revisions. Most of these revisions (20 out of 30) involved only renaming operations, while the rest applied Extract/Inline/Move Method refactorings. Simple refactorings (Extract/Move Method) are also applied within revisions that focus on fix-ing bugs. The most complex and, also, interestfix-ing cases of refactorfix-ings are part of revisions that focus on new feature implementation tasks (termed “flossing” by [61]). These revisions correspond to 45.3% of the total and involve moving state and behavior among classes, as well as, superclass extraction in class hierarchies. We discuss the most interesting of these cases that are also characterized by design tradeoffs in Section 4.1.4.1.
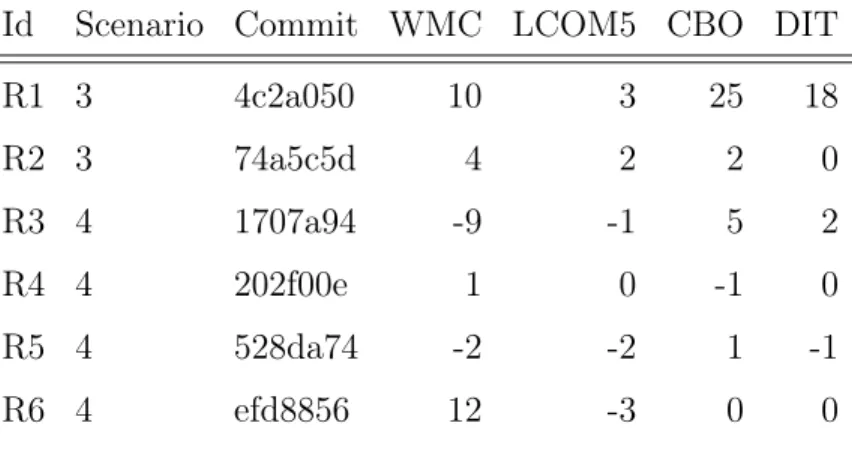
Tab. 4.5. Metric fluctuations in interesting cases
Id Scenario Commit WMC LCOM5 CBO DIT
R1 3 4c2a050 10 3 25 18 R2 3 74a5c5d 4 2 2 0 R3 4 1707a94 -9 -1 5 2 R4 4 202f00e 1 0 -1 0 R5 4 528da74 -2 -2 1 -1 R6 4 efd8856 12 -3 0 0 4.1.4.1. Interesting cases
Our manual evaluation of revisions revealed several design decisions related to the refac-torings that we detected. In this section, we select and explain interesting design decisions identified in RCs from Scenarios 3-4. Moreover, we discuss the effect on internal metrics of the refactorings applied in each revision. We summarize these revisions in Tab. 4.5. Each revision is given a number, which we use in the rest of the text for identification. Further, for each one, in Columns 2–7, we list under what scenario it was classified, its abbreviated Git Commit ID and the aggregate metric differences. For each revision, we display its key take-away in a boxed sentence.
The first two revisions were classified in Scenario 3 and include some interesting design decisions. The remaining four revisions were classified in Scenario 4. One of these revisions, R3, involves one of the most complex refactorings in the revision history of JFreeChart. Revision R1. In this revision, an Extract Superclass refactoring unifies under a com-mon parent, the TextAnnotation and AbstractXYAnnotation class hierarchies, as well as the individual class CategoryLineAnnotation. This way, a larger class hierarchy is formed having the extracted superclass AbstractAnnotation as root. The refactoring was motivated by the need to add an event notification mechanism to plot annotation classes3. The devel-opers decided to add this feature to all plot annotation classes through its implementation in a common superclass (AbstractAnnotation). The implementation comprises appropriate state variables and methods for adding/removing listeners and firing change events. The