Université de Montréal
Worldwide variations in sex ratio of cancer incidence:
temporal and geographic patterns
Par
Syed Ahsan Raza
Département de médecine sociale et préventive École de santé publique
Thèse présentée à la Faculté des Études Supérieures en vue de l’obtention du grade de PhD en Santé Publique,
Option Épidémiologie
April, 2017
i
Résumé
Contexte: Les comparaisons internationales de taux d’incidence du cancer sont des sources importantes d’éléments pouvant aider à générer des hypothèses en lien à l’étiologie du cancer. Les estimations de la variation géographique de l’incidence de cancer peuvent être compromises par des artefacts tels que l’inexactitude et le manque de données complètes portant sur l’incidence du cancer, parmi plusieurs autres. Ces artefacts associés aux taux d’incidence pourront mener à des erreurs au niveau de l’interprétation et de la comparaison des tendances à travers les registres de cancers. Le ratio des sexes (défini comme le rapport du taux d’incidence de cancer masculin divisé par le taux d'incidence féminin) est une mesure qui pourra être moins susceptible d’avoir des ambiguïtés d’interprétation suite à de tels artefacts, dans la mesure où la mesure des cas de cancer est similaire chez les hommes et les femmes.
Objectifs: L'objectif principal de cette étude sera donc de conclure quand aux causes qui pourront générer la variabilité dans le ratio des sexes pour des types de cancers spécifiques, à travers temps et lieu, en générant des hypothèses. L’objectif secondaire sera d’explorer la mesure dans laquelle les inégalités de genre entre les pays peuvent fournir des indices sur la qualité des registres de cancer pour les types de cancer sélectionnés, à l'aide du rapport des sexes.
Méthodes: L’incidence du cancer dans cinq continents (CI-5), une base de données de registres populationnels de cancer obtenue du Centre international de recherche sur le cancer (CIRC) de l’Organisation mondiale de la santé (OMS), a été utilisée afin d'accéder aux données d’incidence de 30 différents cancers durant 3 périodes de temps (c'est-à-dire 1974-77, 1988-92 et 2003-07) provenant de 1974-77, 142 et 281 registres sur le cancer. Des méthodes
ii
descriptives ont été utilisées, soit des modèles à effets mixtes, pour l’étude des tendances temporelles et des variations géographiques au niveau du ratio des sexes. Afin d’explorer le biais en lien au genre, les ratios des sexes pour les cancers du poumon, de la vessie, de l’œsophage et du larynx ont été mis en concordance avec deux indices statistiques, à savoir l’Indice d’inégalité des genres de l’ONU et les estimations mondiales de prévalence du tabagisme de l’OMS.
Résultats: Les résultats obtenus à l'aide de modèles à effets mixtes utilisant un nombre égal (soit 76) registres de cancer de longue durée pour chaque année entre 1983 et 2007, après avoir ajusté le ratio des des sexes pour la variation géographique, ont démontré que le cancer du poumon avait le plus haut ratio des sexes en moyenne lors de la première année
(«baseline») (soit 9.9), suivi de l’œsophage (7.8), la vessie (5.1), le foie (3.8), le pancréas (2.1), le rein (1.9), la leucémie (1.8), le lymphome non hodgkinien (1.8), le cerveau (1.6), le rectum et l’anus (1.5), le côlon (1.2), les yeux (1.2), le mélanome de la peau (0.9), la vésicule biliaire (0.6) et la thyroïde (0.5). Dans les registres de pays ayant une faible inégalité entre les sexes et une prévalence de tabagisme similaire chez les femmes et les hommes (la Suède, la Norvège et le Danemark), le ratio des sexes pour le cancer du poumon était relativement bas (1.2, 1.3 et 1.6). D'un autre côté l’Espagne, tout en ayant une prévalence similaire de tabagisme chez les hommes et les femmes, montrait un ratio des sexes inhabituellement haut pour le poumon (7.1) ainsi que pour d’autres cancers associés au tabagisme (vessie: 14.9, œsophage: 10.7, larynx: 28.2). Les résultats de cette étude tendent à mettre en relief plusieurs types de cancer, notamment celui des reins pour lequel les facteurs de risques connus seront peu susceptibles de pouvoir expliquer pleinement le ratio masculin-féminin de presque 2:1, uniformément stable à travers le temps et les régions.
iii
Conclusions: Les facteurs de risque établis dans la littérature dont la prévalence varie dans les deux sexes au niveau mondial, ne semblent pas pouvoir expliquer la stabilité du ratios des sexes pour le cancer du rein au cours des trois décennies. Suite à cette observation, nous avons émis l'hypothèse de certains facteurs endogènes, tels que la génétique ou la variance génétique, pouvant être en mesure d’expliquer la stabilité du ratio des sexes pour ce cancer. Un autre type de cancer, le myélome multiple, s'est lui aussi avéré stable à travers le temps et l’espace (le rôle de la vitamine D a été postulé). Notre étude nous a permis d'identifier des lacunes au niveau de la compréhension des causes de cancer au sein des populations.
Mots clés: Cancer; Registres; Incidence; Régression; Modèles d'effets mixtes; Surveillance; Autocorrélations spatiales
iv
Summary
Context: International comparisons of cancer incidence rates are important sources of evidence for generating hypotheses about cancer etiology. The estimates of geographic variation in cancer incidence can be compromised by artifacts such as imperfect accuracy and completeness of available cancer incidence data among several others. The artifacts associated with incidence rates, can be potentially misleading when interpreting and comparing trends across cancer registries. The Sex Ratio (defined as the male-to-female cancer incidence rate) is one measure that can be less susceptible to ambiguity of
interpretations by these artifacts, provided that the ascertainment of cancer cases is similar in males and females.
Objectives: Hence, the main aim of this study is to infer as to potential causes that drive sex ratio variability (i.e., the ratio of male to female incidence rates), of type specific cancers across time and geography, generating hypotheses. The secondary aim is to explore the extent to which country-level gender inequalities can provide clues on quality of cancer registries for selected cancer types through sex ratios.
Methods: Cancer Incidence in Five Continents (CI-5), a database of population-based cancer registries obtained from International Agency for Research on Cancer (IARC), was used to access incidence data on 30 different cancers in 3 time-periods (i.e., 1974-77; 1988-92 and 2003-07) from 77, 142 and 281 cancer registries. Descriptive methods were used with recourse to mixed-effect regression methods for studying temporal trends and geographic variations in sex ratios. To explore gender bias, sex ratios for cancers of lung, bladder, esophagus, and larynx were tallied with two statistics namely UN’s Gender Inequality Index and WHO’s global tobacco prevalence estimates.
v
Results: In the mixed-effect regression analysis using equal number of 76 long-standing cancer registries in each year from 1983 to 2007, and after adjusting for geographic variation in sex ratio, lung cancer had the highest sex ratio on average in the baseline year (i.e., 9.9), followed by esophagus (7.8), bladder (5.1), liver (3.8), pancreas (2.1), kidney (1.9) leukemia (1.8), non-Hodgkin’s lymphoma (1.8), brain (1.6), rectum and anus (1.5), colon (1.2), eye (1.2), melanoma of skin (0.9), gallbladder (0.6), and thyroid (0.5). In registries belonging to countries, with low gender inequality and similar smoking prevalence in men and women (Sweden, Norway and Denmark), the sex ratio for lung cancer was relatively very low (1.2, 1.3 and 1.6). Whereas Spain with similar prevalence of smoking in men and women, showed an unusually high sex ratio for lung (7.1) as well as for other smoking associated cancers (bladder: 14.9; esophagus: 10.7; and larynx: 28.2). The results of our study also highlight several cancer types, in particular, kidney for which acknowledged and well-known risk factors are unlikely to fully explain the consistently stable male-female ratio of almost 2:1 across time and regions.
Conclusions: The well-established risk factors in literature whose prevalence varies
worldwide in both sexes, does not seem to decipher the curiously stable sex ratios in cancer of kidney maintained over three decades. This observation has made us to tentatively hypothesize that some endogenous factor such as a gene or gene variant might be able to explain the stable sex ratio of this cancer. Another cancer type, multiple myeloma is also consistently stable across time and place, and where the role of vitamin D has previously been postulated. The study points towards gaps in our understanding of causes of cancer risk in populations.
vi
Key words: Cancer; Sex Ratios; Worldwide; Registries; Incidence; Regression; Mixed Effect Models; Surveillance; Spatial Autocorrelations
vii
Table of contents
Résumé ... i
Summary ... iv
List of Figures ... xiii
List of Tables ... xv
List of Abbreviations ... xviii
Acknowledgements ... xx
Statement of financial support ... xxiii
Chapter 1 Introduction ... 1
1.1 Statement of problem: inferences from comparisons of cancer incidence trends ... 1
1.2 Possible solution: analyses of Sex Ratio (SR) variability of cancer incidence ... 6
1.3 Use of gender inequality index to explore gender-bias in cancer registration ... 9
1.4 Outline of subsequent chapters ... 11
Chapter 2 Background Review on measures of cancer burden ... 14
2.1 Cancer incidence ... 16
2.1.1 Definition ... 16
2.1.2 Sources of data and quality ... 16
2.1.3 Factors affecting assessments of incidence over time ... 17
2.1.4 Geographic variations in incidence rates ... 20
viii
2.1.4.2 Spatial variability ... 24
2.2 Cancer mortality: ... 26
2.2.1 Definition ... 26
2.2.2 Sources of data and quality ... 26
2.3 Other measures of cancer burden ... 28
2.4 Incidence versus mortality ... 29
2.5 Review of methods to analyze cancer trends ... 31
2.5.1 Exploratory analyses through graphical depictions ... 32
2.5.1.1 Choice of rate: age-standardized or age-stratum-specific ... 32
2.5.1.2 Choice of scale: arithmetic or log-transformed ... 34
2.5.2 Role of statistical models to quantify temporal change ... 37
2.5.3 Other modeling techniques ... 38
Chapter 3 Background review on cancer registration ... 40
3.1 Historical context of cancer registration ... 40
3.2 Cancer Incidence in Five Continents (CI-5 & CI-5Plus) ... 44
3.3 Hospital-based versus Population-based cancer registries ... 45
Chapter 4 Cancer case-ascertainment in cancer registries ... 48
4.1 Overview of cancer case-ascertainment ... 48
4.2 Key issues in cancer case-ascertainment ... 49
ix
4.3.1 Comparison of completeness indices in literature ... 56
4.4 Completeness of cancer case-ascertainment by sex: Is there a gender-bias? ... 59
Chapter 5 Sex Ratio: a distinct approach in light of imperfect ascertainment ... 65
5.1 Literature review ... 65
5.1.1 Sex ratio: incidence of multiple sclerosis ... 65
5.1.2 Sex ratio: incidence of Parkinson’s disease ... 70
5.1.3 Sex ratio: incidence of rheumatic diseases ... 71
5.1.4 Sex ratio: incidence of infectious diseases ... 72
5.1.5 Sex ratio: mortality of cardiovascular diseases ... 74
5.2 Sex ratio: a guide to interpret cancer incidence trends and hypotheses ... 76
5.2.1 Exogenous and endogenous causes of cancer ... 77
Chapter 6 Rationale and Objective ... 80
6.1 Rationale... 80
6.2 Objectives ... 81
Chapter 7 Methodology ... 83
7.1 Overview of design ... 83
7.2 Data sources ... 85
7.3 Computation of incidence rates ... 88
7.4 Sex Ratio definition and computation ... 89
x
7.5.1 Data extraction ... 90
7.5.2 Estimating in three time periods (1973-77; 1988-92; 2003-07) ... 91
7.5.3 SRm: definition and computation ... 91
7.5.4 SRv: definition and computation ... 92
7.5.5 Log transformation of SRm and SRv... 94
7.5.6 Generating SRm × SRv Tables ... 94
7.7 Estimating time trends and geographic variability in Sex Ratios ... 95
7.7.1 Data extraction ... 95
7.7.2 Data setup... 96
7.7.3 Description of regression models in different data scenarios ... 97
7.7.3.1 Setting up mixed-effects models ... 98
7.7.3.2 Choice of mixed-effects models’ type ... 100
7.7.3.3 Assessing the fit and comparisons of models ... 101
7.7.3.4 Incorporating gender inequality in the analyses ... 103
7.8 Estimating spatial auto-correlations of SR ... 104
7.8.1 Analyzing spatial autocorrelation: Moran’s Index. ... 104
7.8.2 Steps in computing Moran’s Index. ... 105
Chapter 8 Results ... 111
8.1 Incidence rates and SR worldwide ... 112
xi
8.3 Time trends and intra- & inter- regional variability of SR ... 134
8.4 Cancers by gender inequality and smoking patterns ... 144
8.4 Spatial autocorrelations: Global Moran Indices ... 150
Chapter 9 Discussion ... 157
9.1 General observations on sex ratios of cancer incidence and existing literature ... 159
9.2 Point of view - overview of associations: established or not? ... 163
9.2.1 Temporal trends and geographic variations ... 164
9.2.2 Notes on intra- and inter- regional variability... 168
9.2.3 Notes on spatial variability ... 169
9.3 Tentative hypotheses and questions based on observations and trends ... 170
9.5 Theoretical implications of observations ... 176
9.6 Differential case-ascertainment: potential of gender-bias ... 179
9.7 Strengths and weaknesses ... 182
9.8 Conclusion ... 185
9.9 Contribution to knowledge ... 188
References ... 189
Appendices ... 226
SPSS syntaxes for mixed effect regression models ... 282
Cote Scientifique – Fonds de la recherche en santé du Québec ... 291
xii Presentations of thesis work
1. 2017 Annual Meeting of American College of Epidemiology (ACE) September 24-26, 2017
New Orleans, Louisiana, United States.
Poster Presentation: Worldwide sex ratio variations in cancer incidence Best Poster Award with cash prize
Abstract published in Annals of Epidemiology
2. 2017 Global Health Conference of American Academy of Family Physicians (AAFP), October 4-6, 2017
Houston, Texas, United States.
Poster Presentation: Exploring the global impact of gender biases in cancer registration on reported gender disparities in cancer incidence
3. 11th International Symposium on Geospatial Health, International Society of Geospatial Health (GnosisGIS)
November 3-5, 2017
Baltimore, Maryland, United States.
Oral Presentation: Using geospatial distribution of age-adjusted gender disparities in cancer incidence to explore etiologic hypotheses
xiii
List of Figures
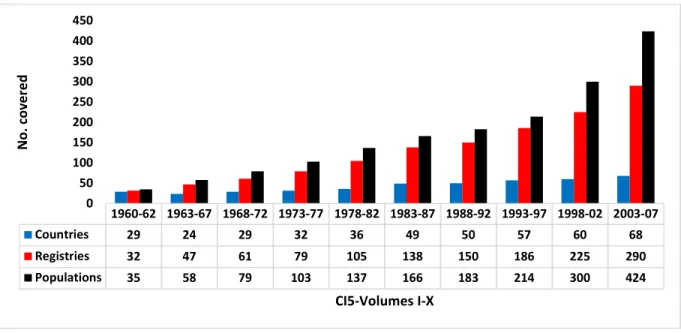
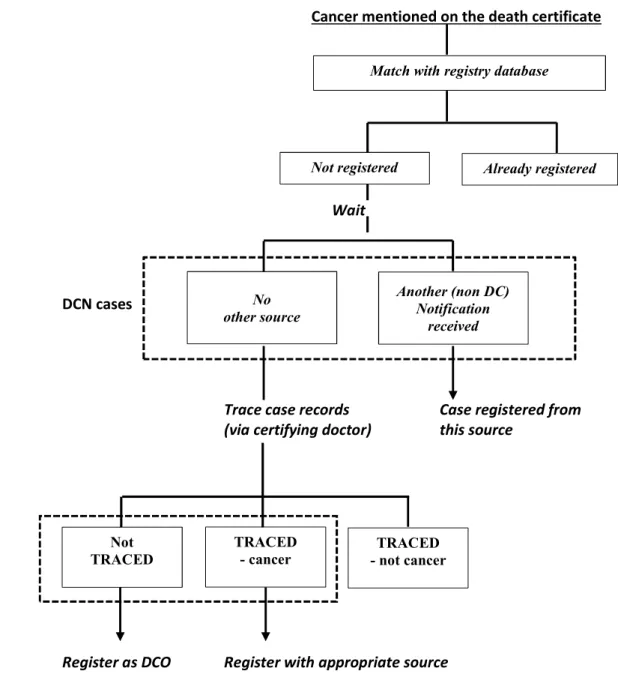
Figure 2-1: Age standardized incidence rates of lung cancer in women (15-85+ years) in five countries from 1953-2003 on arithmetic on left and log scale on right (source WHO- IARC). ... 36 Figure 3-1: Coverage of cancer registries in ten volumes of CI-5 ... 44 Figure 4-1: The use of death certificates to identify new cases of cancer... 53 Figure 4-2: Surveys results on proportion of cancer registries within each region of Europe using
different methods of estimating completeness. (a) Schmidtmann and Blettner, 2006 (b) Zanetti et al in 2015. ... 58 Figure 7-1: Timeline of 113 long standing cancer registries and year they started operating in CI5Plus database. ... 87 Figure 7-2: Levels of magnitude and variances of SR (SRm×SRv). ... 95 Figure 7-3: Levels of sex ratio magnitude (SRm) and variance (SRv) stratified according to levels of magnitude of cancer incidence (a) low: Im1 (b) medium: Im2 (c) high: Im3 ... 95 Figure 7-4: A flowchart of steps in computation of Moran’s I: data preparation, parameter estimation, and spatial autocorrelation analysis. ... 107 Figure 8-1: Cancers with the highest incidence rates in 1973-77 (> 4.5 / 105 person-years) and changes in incidence rates over time in 1988-92 and 2003-07, by sex. ... 116 Figure 8-2: Cancers with medium-level incidence rates in 1973-77 (2.0 - 4.5 / 105 person-years) and changes in incidence rates over time in 1988-92 and 2003-07, by sex ... 117 Figure 8-3: Cancers with low incidence rates in 1973-77 (< 3 / 105 person-years) and changes in
incidence rates over time in 1988-92 and 2003-07, by sex ... 118 Figure 8-4: Magnitude of the sex ratios (SRm) of 30 cancer types plotted against their variances (SRv) on log scale for period 1973-1977 ... 127 Figure 8-5: Magnitude of sex ratios (SRm) of 30 cancer types plotted against their variances (SRv) on log scale for period 1988-1992. ... 129 Figure 8-6: Magnitude of the sex ratios (SRm) of 30 cancer types plotted against their variances (SRv) on log scale for period 2003-07. ... 131 Figure 8-7: Laryngeal cancer: sex ratio magnitude (mean predicted value) plotted against calendar year from 1983-2007 depicting inter-registry-regional (τ 12) and intra-registry-regional (δ2) variations of sex ratios. ... 142 Figure 8-8: Sex ratios average trajectories based on random intercept and random slopes models for registries with low and high gender inequality between 1983 and 2007; GI:gender inequality ... 150
xiv
Figure 8-9: Spatial correlations- Moran’s Index for Sex Ratios of cancer incidences in Europe and Asia. .. ... 155 Figure 9-1: Sex ratios of incidence for selected cancers with stable and varying patterns by year in 76 worldwide cancer registries. ... 172
xv
List of Tables
Table 1-1: Hypothetical scenario of ascertainment of cancer cases is in cancer registries. ... 7 Table 3-1: Numbers of registries submitted and number and proportion finally included in Cancer
Incidence in Five Continents Volume X, by continent. ... 45 Table 4-1: Capture-recapture method using two sources of information of cancer case ascertainment. ... 55 Table 4-2: Completeness of cancer case-ascertainment for all ages in males and females using standard methods of ascertainment. ... 62 Table 7-1: Magnitude of the mean incident SR (𝑆𝑅𝑚𝑖𝑘) and the variance of the incident SR (𝑆𝑅𝑣𝑖𝑘) for 30 cancer types across cancer registries in a selected CI5 volume (CI5-X: 2003-07*). ... 93 Table 7-2: An example of pair wise spatial distance matrix in kilometers from 10 selected areas in Asia. .. ... 108 Table 8-1: Total number of cancer registries N and incidence rates I in periods 1973-77, 1988-93, and 2003-07 for 30 types of cancers for both sexes. ... 114 Table 8-2: The sex ratio magnitude (SRm) of 30 types of cancers worldwide in 1973-77, 1988-93, and 2003-07. ... 120 Table 8-3: Incidence rates of 30 cancers in males and females, the sex ratio magnitude (SRm), and registries with the highest and lowest SRm in 1973-77. ... 121 Table 8-4: Incidence rates of 30 cancers in males and females, the sex ratio magnitude (SRm), and registries with the highest and lowest SRm in 1988-92. ... 122 Table 8-5: Incidence rates of 30 cancers in males and females, the sex ratio magnitude (SRm), and registries with the highest and lowest SRm in 2003-07. ... 123 Table 8-6: Cancer types categorized according to three levels (low, medium & high) of the sex ratio magnitude (SRm) and variances (SRv) in 77 registries in 1973-1977 on log scale. ... 127 Table 8-7: Cancer sites stratified according to low, medium and high levels of incidences rates, sex ratio magnitude (SRm) and variances (SRv) in 77 registries in 1973-1977 on log scale. ... 128 Table 8-8: Cancer types categorized according to three levels (low, medium & high) of sex ratio
magnitude (SRm) and variances (SRv) in 142 registries in 1988-1992 on log scale. ... 129 Table 8-9: Cancer sites stratified according to low, medium and high levels of incidence rates, sex ratio magnitude (SRm) and variances (SRv) in 142 registries in 1988-1992 on log scale. ... 130 Table 8-10:Cancer types categorized according to three levels (low, medium & high) of sex ratio
magnitude (SRm) and variances (SRv) in 281 registries in 2003-2007 on log scale. ... 131 Table 8-11: Cancer sites stratified according to low, medium and high levels of incidence rates, sex ratio magnitude (SRm) and variances (SRv) in 281 registries in 2003-2007 on log scale. ... 132
xvi
Table 8-12: Results of regression models (Random-intercepts & Random-slopes) of 21 types of cancers for registry-regions in 1953-2007 (Scenario A: ranging from 3 to 113 registries in different years)* ... 136 Table 8-13: Results of regression models (Random-intercepts & Random-slopes) of 21 types of cancers for registry-regions in 1983-2007 (Scenario B: 76 - 113 registries in each year).* ... 137 Table 8-14: Results of regression models (Random-intercepts & Random-slopes) of 21 types of cancers for registry-regions in 1983-2007 (Scenario C: 76 registries in each year).* ... 138 Table 8-15: Sex ratios of lung, bladder, esophageal and laryngeal cancers with country level prevalence estimates of smoking tobacco. ... 145 Table 8-16: Predicted average sex ratio changes between 1983 and 2007 in cancer registries from 32 countries defined according to two levels of gender inequality ... 149 Table 8-17: Moran’s I values with ranking of spatial clustering for sex ratios of 28 cancers in Europe . 152 Table 8-18: Moran’s I values with ranking of spatial clustering for sex ratios of 28 cancers in Asia. .... 153 Table 9-1: Comparisons of sex ratio analysis of incidence and mortality with different studies for some of the cancer types ... 161
xvii List of Appendices
Appendix 1: Example of computations of CIR & ASIR for melanoma in Denmark in males, 1998-2002. ... ... 226 Appendix 2: Description of interpretation of Fixed-Effect Models a and b, and Random-Intercept Model c. ... 227 Appendix 3: An example of calculations of distances from the latitude and longitude ... 230 Appendix 4: Cancer types with their overall sex ratio magnitude (SRm) and variance (SRv) along with populations with highest and lowest SRm for incidence period of (a) 1973-1977, 1988-92, and 2003-07 .... ... 231 Appendix 5: Magnitude of sex ratios (log transformed versions) of 30 cancer types plotted against their variances in (a) 1973-1977, (b) 1988-92, and (c) 2003-07. ... 242 Appendix 6: Regression models in three scenarios (A, B & C) with varying number of
registry-populations (N) for 21 types of cancers (A 6-a to A 6-u): fixed-effects models (a and b); mixed effects model with random intercepts (c); and mixed effects model with random intercepts and slopes (d). ... 245 Appendix 7: Plots of worldwide SR magnitude (mean predicted values) form 1983-2007 for 11 types of cancers (A 7-a to A 7-h) ... 267 Appendix 8: SPSS syntax for categories of sex ratio magnitude (SRm), sex ratio variation (SRv) and Incidence (Im) ... 279
xviii
List of Abbreviations
ASIR Age-standardized Incidence Rate CI-5 Cancer Incidence in Five Continents DCO % Proportion of Death Certificate Only cases GII Gender Inequality Index
IACR International Association of Cancer Registries IARC International Agency for Research on Cancer ICD-O International Classification of Disease - Oncology
Im Magnitude of Incidence
M:I Mortality to Incidence Ratio
MV % Proportion of cancer cases morphologically verified
RI Random Intercept Model
RI & RS Random Intercept & Random Slope Model
SR Sex Ratio
SRm Magnitude of Sex Ratio SRv Variance of Sex ratio
UICC Union for International Cancer Control (Formerly International Union against Cancer)
UN United Nations
xix
Dedicated to
To my father, who saw it all happen as a physician of more
than five decades, the menace of tuberculosis, never turned his
patients down no matter how poor they were, and most of all
never let his family down!
xx
Acknowledgements
“I took the one less traveled by”
Robert frost’s narrative poem well illustrates my life as the one who desires to pursue life with passion and positive energy. What a life it has been on the road less travelled. Despite staying positive in life, sometimes, somewhere, you come across road blocks that makes you re-think your decisions. But pursuing PhD was never one of those decisions that I had to rethink. It was the decision that I made long time ago when I noticed that there are no qualified Epidemiologists in my native country, Pakistan. The decision to take off my white coat and stethoscope, for something that involved playing with numbers and making sense out of them was never something that I planned…. When I heard and read about the ancient folklore of “Three Princes of Serendip”, I realized that Epidemiology was indeed a
serendipitous finding!
All the hardships that I faced and sacrifices that I made for these three letters P…H….D, are ingrained in these pages. From my childhood in Tripoli, medical school in Karachi, cancer research training in Lyon, leading to my doctoral studies in Montreal, and now a fellowship in Houston, I have met so many people that have made these hardships way less enduring. The cities and the people I met in those cities made me who I am today. Anwar Siddiqui in Karachi, Bilal Avan in London, Silvia Franceschi and Gary Clifford in Lyon, Ramzan Tahir and Jack Siemiatycki in Montreal are among the few names that I have closely worked with and have learned a lot from them. !
To my family in Karachi, words are not enough to express my love for them. My parents Zahid Raza and Yasmin Khan, who only saw me once during this whole process of doctoral
xxi
studies in Montreal are my idea of not only picture-perfect married couple but the ones who stand by all kinds of life-long hardships through all kinds of hail and storm. From my father, I inherited extra-ordinary amount of patience, and from my mother an extra-ordinary
amount of silent inquisitiveness and doing good to others without claiming any credit. My brother Nauman who learned to instill the love of Parasitology among his students has a heart of pure gold, and my sister Sarah for doing an amazing job of raising two beautiful kids, Abdullah and Nasrullah who were just five and three when I left Karachi for Montreal in 2010. Sometimes, in my dreams, I can still hear them shout “Mamoo (uncle in urdu)” outside my room, to let them come inside so they can listen to World Cup cricket song by a band called “The Strings”…..Hai Koi Hum Jaisaa? (Is there anyone like us?).
My thesis would not have reached to this stage, had it not been the staunch support of my wife Farrah and my in-laws in Houston. She surpassed even me in having the amount of patience that I always take pride in. Although she kept telling me many times that I can complete writing my thesis in Houston, and I stubbornly kept telling her that I need to be near the source of where everything is happening i.e., in Montreal. Little did she know that I found a little coffee shop in some obscure corner of Montreal’s downtown where I would go and pounce my head around those abstract concepts in thesis that kept me awake at night.
I would like to express my sincere gratitude to Prof. Jack Siemiatycki, my doctoral advisor for the support of my Ph.D study in his research group, for his patience, guidance, and knowledge of Epidemiology. Also to Mireille Schnitzer for looking over my statistical analysis in the thesis. To Professors Maria Victoria Zunzunegui and Jennifer O’Loughlin for making me welcome in my first few months in the university. Beatrice Lauzon, my PhD colleague and office mate at CRCHUM who never hesitated in helping me out in anything
xxii
and everything. No doubt it was an added advantage in sharing office with her all these years…. translating my emails and documents to French! Thank you for everything Bea!...
To my lifelong mentor and closest friend Bilal Avan, I have come a long way with him. I have shared so many things in life with him (besides our scientific publications). He is the only person who is available all the time when I call him, whether he is in jungles of Africa or in some village in India, he would make sure to always call me. One time he had to walk a long distance in Somalia just to call me and advise me about my project. He is truly an amazing person. I am looking forward to see his son Daniel grow up into an amazing person like his dad.
My younger compatriot and partner in crime Ramzan Tahir, who hosted me in his apartment for long bouts of my visits to Montreal. Like a typical gentleman from Pakistan, he would not let me sleep on sofa at his place but will reserve it for himself. What are the odds that this young man from Sargodha happens to be a PhD in Biostatistics? No doubt, he knows all the ins and outs of my thesis. Our everyday meeting at lunch time and discussion on my thesis kept me motivated. His Punjabi jokes kept me high during bouts of depression in Montreal winter. This thesis would never have reached its final phase without him.
Finally, many thanks to Sally Campbell for her amazing capacity to retrieve papers as far back as 1871, and that too from the basement of McGill university’s gym, and Lesley Richardson for listening to all my complains. And to Javier Pintos, Igor Karp, Anita
Koushik, and Jerome Lavoie for all their theories during happy hours in La Reservoir! And to patience and encouragement shown by Drs. Roger Zoorob and Jason Salemi at Baylor College of Medicine, in Houston, to allow me to finish this thesis. Cheers to you all!
xxiii
Statement of financial support
The acknowledgement would be incomplete without the mention of several sources of funding for my doctoral studies at Université de Montréal. In my first year of the program, I was supported by funding from Guzzo Chair in Environmental Cancer Research as well as Bourse d’Excellence du PhD en Santé Publique, Université de Montréal. I also received a supplementary award for doctoral students from the Centre de Recherché du Centre Hospitalier de l'Université de Montréal – CR-CHUM.
I was also supported for three years by a competitive Doctoral Research Scholarship from the Fonds de recherche Santé Québec - FRQS, Government of Québec, Canada.
1
Chapter 1
Introduction
1.1 Statement of problem: inferences from comparisons of cancer incidence trends Cancer is a leading cause of death in many developed countries and is set to become a major cause of not only mortality but also morbidity in every region of world regardless of the country’s level of resources (1, 2). Drawing on the principle of epidemiological transition related to aging, changing lifestyles and economic factors, there will be a dramatic world-wide increase in the number of cancers in the next few decades (1). It has been predicted that the numbers of incident cases worldwide will increase from 12.7 million cases in 2008 to 20.3 million cancer cases by 2030 (3). Such a transition most prominently reflects an upsurge in non-communicable diseases, of which cancer is the largest component. These changing patterns of cancer occurrence are also contingent on changes in regional distributions of known and unknown risk factors. The global burden of cancer and extent of its transition can be best described by studying differences in incidence and mortality rates in different
regions. Comparisons of region-specific incidence and mortality rates of cancer aid in planning and prioritizing cancer control resources as well as facilitate monitoring and public health surveillance. Population-based studies on geographic and temporal trends of cancer are crucial in the implementation and evaluation of strategies aimed at all three levels of primary, secondary, and tertiary prevention (1, 4).
In epidemiological research, inferences based on geographic comparisons and temporal investigations of cancer incidence and mortality are complex because of some limitations and errors (4, 5). Previously, Bray and colleagues studied geographical and temporal trends of cancer in the context of epidemiological and preventive research and outlined complexities that obscured interpretation at the level of data collection, analysis and reporting results
(6-2
9). Investigators who intend to interpret incidence and mortality trends must therefore be aware of the characteristics of sources of both measures of cancer burden e.g., available incidence and mortality databases. They must be aware that certain artifacts in addition to specific interventions of interest or changes in the population prevalence of etiological factors may have impacted the trends (10). These artifacts associated with incidence rates potentially affect interpretation of trends (10, 11). These include 1) misclassification of a cancer case as a resident or non-resident; 2) duplicate registrations; 3) incorrect definition of an incident case of cancer; 4) a failure to identify or diagnose true cancer cases; 5) poor specification of diagnosis; 6) improvements in diagnostic procedures and 7) difficulties in estimating populations at the national or sub-national level, 8) and more importantly incomplete or imperfect cancer case ascertainment that may or may not be cancer type-specific or maybe the result of resources assigned to the cancer registries. On the other hand, mortality data is prone to erroneous death certification and changes in coding practices over time. If mortality trends are used as a proxy for incidence rates, further bias is introduced for cancers where prognosis has improved with time, given that case fatality would not be constant (12, 13).
The increasing availability of incidence data from cancer registries has been a major driving force in demonstrating thevalidity of range of analytical techniques. These include 1) graphical inspections of cancer rates that emphasize variations according to age and calendar time; 2) statistical models that augment visual graphical approaches in cancer rates; and 3) sophisticated methodological approaches such as age-period-cohort modelling that highlight generation-specific analyses (6, 10, 14, 15). In addition to the development of analytical methodologies by researchers, many cancer registries made efforts in standardizing
3
registration procedures that were helpful in establishing the quality and comparability of cancer incidence data (16, 17). However much of these standardization efforts have remained concentrated to registries that are well funded and where registration is part of government policy. Here, it should also be borne in mind that the history of registration in both Asia and Europe is, in fact, a history of highly motivated individuals who persuade those around them to help establish a registry. In majority of cases, it is only in very late stages that registration becomes a government concern (18). Due in large part to the efforts of the International Association for Cancer Registries (IACR) and the support of the International Agency for Research on Cancer (IARC), there are many cancer registries in Asia now generating incidence data, although the indices of quality still remain highly variable (18). One of the most important quality concern (i.e., completeness of cancer case ascertainment) is discussed in detail in Chapter 4. In Europe, cancer registries may cover national populations (e.g. Sweden, Denmark and Norway) or certain regions within a country (e.g. Italy, Spain, France, and Germany). The founding of European registries has also been a rather selective process, dependent on official policy to support and fund such activities, or through individual initiatives by research orientated clinicians and pathologists (19). As a result, European cancer registries also differ enormously with respect to the size of the population covered, the number of years of complete data available since the start of the registry, as well as, in the case of local regional registries, their representativeness of the national profile of cancer burden and risk patterns (4). Despite the limitations, cancer registries throughout history have provided useful information on the cancer burden, and have played a role in generating hypotheses about cancer etiology (20-22). The historical perspective of cancer registration and evolution of cancer registries in generating incidence data is provided in Chapter 3.
4
Currently, there are about 600 cancer registries operating around the world and majority (85%) are part of IACR but only those that fulfil certain quality criteria of completeness as assessed by IACR’s technical staff, are then selected to be included in Cancer Incidence in Five Continents (CI-5), a joint collaborative effort of both IACR and IARC. For the last five decades, CI-5 has been the most authoritative reference on the incidence of cancer
worldwide. CI-5 represents a compilation of participating cancer registries that meet certain quality criteria of accuracy and completeness (23-25). It has now been published in ten consecutive volumes since the 1960s, at approximately 5-year intervals. In the introduction to the first volume of the CI-5, Sir Richard Doll discussed the role of comparisons of cancer incidence between different regions and over time, in developing knowledge about the causes of cancer (26). They concluded that among statistics available for studying cancer, “the most valuable data are, undoubtedly, the rates obtained by recording the occurrence of every case of cancer over a specified period.” This remains the basic function of any population-based cancer registry, which in the words of Jensen & Storm is defined as one that “records all new cases of cancer in a defined population (most frequently a geographical area/region)” (21, 27). Therefore, by recording every cancer case, the main goal of a registry is to provide incidence data that accurately represents the true incidence rate of cancer in the region. In practice, how closely these observed rates reflect true incidence rates, can be influenced by certain quality issues specific to the registration process in the region in which registry is situated.
The effectiveness of registries relies profoundly on the quality control procedures, which can be broken down into three components: comparability, validity, and completeness of the incidence data (16, 17). Comparability refers to the standardization of practices concerning
5
the classification and coding of new cases, and to the definition of incidence, such as rules for coding multiple primaries and incidental diagnoses. Validity or accuracy refers to the proportion of cases in the registry with a given characteristic that truly have that attribute, and depends on the precision of source documents and the level of expertise in abstracting, coding, and recording. Finally, completeness is the extent to which all the incident cancers occurring in a target population are included in the registry database (16, 17, 28).
There are numerous techniques used to evaluate registry completeness, the details of which are discussed later in Chapter 4. Ascertainment of cancer cases and their
completeness in a registry, play an extremely important role in ensuring that the observed incidence rates are in fact true rates or at least close to them. However, not all registries can provide 100% true incidence rates, and there are not many straightforward methods that can provide accurate assessment of the extent in which all eligible cancer cases are ensured to be registered. Moreover there are cancer registries that use different case-ascertainment
methods, and their completeness depends largely on the availability of local resources. Specifically, more sophisticated methods are used in registries that are well funded and less sophisticated methods are used in registries from low resource regions, and this in turn could increase the gap in completeness of data between cancer registries.
Other artifacts in interpreting incidence trends over time from cancer registries have been addressed by Saxem (29), Esteve (11), Muir (30), Swerdlow (31), and very recently by Bray (10). The required conditions that ensure truly valid comparisons of cancer trends, as
described by Muir et al (30) [quoted by Bray (10)], are worth repeating unedited: 1) the definition and content of the cancer site being studied have not changed; 2) The criteria of malignancy have not changed; 3) the likelihood that a cancer will (ever) be diagnosed has not
6
changed; 4) the progress of cancer from inception to diagnosis is not modified by early detection or screening programmes; 5) ascertainment of incident cases and deaths has been equally efficient throughout the period of study; 6) indexing in the International
Classification of Diseases (ICD) has not changed; 7) accuracy and specificity of coding is consistent over time; 8) statistics are available at the level of detail required. The authors note, few, if any, databases would meet all of the above criteria.
In the next section, we introduce a possible solution [i.e., Sex-Ratio (SR)], that can circumvent some of the problems that exists in interpretations of incidence trends and their comparisons across different geographic areas. These are then discussed in detail along with literature review in Chapter 5.
1.2 Possible solution: analyses of Sex Ratio (SR) variability of cancer incidence
The Sex Ratio (SR) (i.e., the male-to-female cancer incidence rate or vice versa) is one measure that can be useful to deal with the issue of artifacts and imperfect cancer case-ascertainment of different cancer registries across the world. Recently, the proposed “Sex-Ratio Methodology” has opened new perspectives in disease epidemiology, specifically where the etiology remains undetermined or where new hypotheses are warranted, and old hypotheses can be confirmed (32-34) . In fact, SR is a robust epidemiological marker and its variability can be used for comparing data collected from different countries and regions, and where confounding effects exerted by different factors can be supposedly minimized by carrying out this novel analytical technique (33, 35, 36). The SR has also been recently used in cancer epidemiology using country-specific or worldwide cancer registries to speculate on causes of cancers (37-39).
7
SR can be a useful analytical tool for exploring etiology of cancers and comparisons across worldwide cancer registries, provided that the completeness (or the incompleteness) of ascertainment of cancer cases, in registries that are compared, is similar in males and
females. The key issues in cancer case ascertainment, different methods of evaluations, and completeness by sex are described in Chapter 4.
Table 1-1 shows two hypothetical scenarios in five hypothetical cancer registries: (a) when ascertainment of cancer cases differs by sex, and (b) when ascertainment is similar by sex.
Table 1-1: Hypothetical scenario of ascertainment of cancer cases is in cancer registries. (a) when ascertainment of cancer cases differs by sex
Registry Incidence (Males) Incidence (Females) Sex Ratio M/F
Observed True Observed True Observed True
A 10 20 5 10 2 2
B 5 5 3 3 1.7 1.7
C 20 30 10 10 2 3
D 5 20 5 10 1 2
E 20 20 10 15 2 1.3
(b) when ascertainment of cancer cases is similar by sex
Registry Incidence (Males) Incidence (Females) Sex Ratio M/F
Observed True Observed True Observed True
A 10 20 5 10 2 2
B 5 5 3 3 1.7 1.7
C 20 30 6.7 10 3 3
D 5 20 2.5 10 2 2
E 20 20 15 15 1.3 1.3
By examining the observed and true incidence rates in males and females in Table 1-1 (a) and by computing SR, one can note that the observed SR differ from the true SR if the
8
ascertainment is good in females, but not in males (Registry C); if there is
under-ascertainment in both males and females that is worse in males (Registry D); and if the case ascertainment is good in males, but not in females (Registry E). In Table 1-1 (b), males and females are equally prone to the issues of imperfect case ascertainment (i.e., case
ascertainment is equally good or bad for both males and females). In this scenario the observed SR can be a valid estimator of the true SR.
Tables 1-1 hence highlights that comparison of incidence rates across registries is a function of both the true variability in incidence rates, and the relative completeness of case ascertainment across registries. Therefore, it can be useful to examine not only international variability in incidence, but also the international variability in SR, which comprises
comparison that can be less susceptible to bias from incomplete ascertainment than the variability in incidence.
Much like a hypothetical scenario in Table 1-1 (b), if we assume that in CI5 based cancer registries (unlike many of IACR’s non-CI5 registries), ascertainment, to be similar in males and females, and as evidenced in several sources (24, 25, 40, 41), some advantages can be envisaged when using SR compared to using absolute differences in incidence rates. It can arguably be a less-biased statistic which is less likely to be affected, in general, by
geographical variability in diagnostic techniques, preventive strategies, tumor definitions, coding practices, and other artifacts mentioned in preceding section (37, 42). Unlike reported incidence rates, the reported SR will also be robust to these artifacts when it is used to
compare international variations of cancers across registries, and that could also possibly use different methods of ascertainment (these methods are detailed in Chapter 4). Moreover, SR variation in cancer incidence as estimated from registries with presumably similar
9
ascertainment in males and females can be used as a distinct approach to understanding causes of variations, and making useful inferences regarding etiology.
1.3 Use of gender inequality index to explore gender-bias in cancer registration The assumption that the completeness of cancer case ascertainment is similar in males and females in CI-5 based cancer registries is explored in this dissertation through United Nation’s Gender Inequality Index or (GII) on selected cancer types (specifically by tallying SR of cancers such as lung, bladder, esophagus, and larynx along with country-specific smoking prevalence). Since this assumption of male-female similarity, can be critiqued based on the possible existence of gender-bias (i.e., differential disparities in health seeking actions such as access to health care, diagnostic services, and treatment of cancers that might not be equal in both genders) (43, 44), a well-recognized multidimensional indicator such as gender inequality index can be used in the context of exploring gender-bias in cancer registries.
The measurement of gender inequality has received increasing attention over the past few years (45, 46) and has been explored in epidemiological studies (47, 48). The Gender
Inequality Index has been designed to capture gender inequality through relatively new functional form to summarize multidimensional information into a real number that can be used to compare countries’ performance in this domain over time. The Gender Inequality Index reflects gender-based disadvantage in three dimensions namely: reproductive health, empowerment and the labor market, for 160 countries. It shows the loss in potential human development due to inequality between male and female achievements in these three dimensions. It ranges from 0, where women and men fare equally, to 1, where one gender fares as poorly as possible in all measured dimensions (49). As of 2015 data, the lowest
10
gender inequality country is Switzerland (GII: 0.04) and the highest gender inequality of 0.77 is found in Yemen (49).
According to Permanyer, the interest in measuring gender inequalities has some
instrumental motivations (45, 46). The existence of gender inequalities is related, sometimes in a complex and intertwined way, to socio-economic aspects (hence the term gender) which can be very relevant from the policy making point of view. This is explained through an example of the links between gender and fertility levels in a country. There is empirical and theoretical evidence suggesting that in the countries where gender relations are more
egalitarian, the fertility levels tend to be lower (50, 51). Another reason why there is a great interest in measuring gender inequalities is its presumed link with countries’ economic growth. Some policy based working papers have tested empirically whether high gender inequality levels in a given country affect its economic growth. Klasen (52) and Dollar and Gatti (53) have suggested that the higher the gender equality, the higher the growth rate.
These arguments as implied by Permnayer (45) allude that there are not only good enough reasons for using valid methods of computing gender inequality in multidimensional contexts, but also, that it could be applied in a way to stimulate inquiries in unexplored domains, to raise more attention to gender inequality and its reduction. This dissertation research uses gender inequality index to highlight potential gender-bias, if existing, in the domain of cancer registration, specifically in CI5 based cancer registries.
In summary, the principal focus of this thesis is to present SR variability through the estimation of geographic and temporal variation in the magnitude of SR of cancer incidence for different types of cancer. The underlying premise is that geographic and temporal variability in the SR are less susceptible to bias than geographic and temporal variability in
11
estimated incidence rates, and that these can therefore provide a window to researchers in understanding the risk factors that might explain not only geographic and temporal variability in the SR but even geographic and temporal variability in incidence of cancers. This analysis is also further extended in exploring whether there is any pattern for a cancer type when the SR is geographically clustered, and whether any inference can be made from this pattern. Furthermore, the assumption that the completeness of cancer case ascertainment is similar in males and females is also further explored in this dissertation through United Nation’s Gender Inequality Index or (GII). This type of analysis can also provide clues on quality of cancer registries in CI-5, and can inform the public health debate surrounding the contextual problem of gender-bias in cancer registration.
1.4 Outline of subsequent chapters
Following on from this introductory chapter, Chapter 2 introduces two important measures of cancer burden namely incidence and mortality. Some factors that complicate assessments of incidence and mortality of certain cancer types are discussed. The relative merits of both measures are highlighted and then rationalized for thesis as to why incidence is preferred for the current analysis. The usefulness and limitations of both are appraised in depth in terms of generating and testing etiologic hypotheses and providing information for resource planning. We then describe geographic variations in cancer incidence and the usefulness of these rates in comparing different populations. Chapter 2 ends with the section on review of methods to analyze cancer trends e.g., 1) exploratory analyses through graphical presentations (that includes utility of age-standardization as well as available scales such as arithmetic or log-transformations to plot these rates over time); 2) quantification of temporal
12
changes through traditional models and modification of those models; and 3) a final brief note on the use of more sophisticated models.
After discussing the relative merits of incidence and the mortality for trend analysis, and justifying the advantages of incidence in Chapter 2, we then introduce the historical context of worldwide cancer registration in Chapter 3. A flurry of research activities arrived with the advent of cancer registries. Therefore, the purpose of this chapter is to apprise the reader the importance of cancer registries, the role of several individuals and organizations, and the types of existing registries in generating the incidence data.
Chapter 4 provides an overview of completeness of cancer case-ascertainment, one of the important artifact hindering valid interpretations of comparisons of incidence trends across worldwide cancer registries. This chapter highlights the different methods used to assess the completeness, and then comparisons of completeness indices of these methods in different cancer registries are reviewed. The chapter rounds off with observations on completeness of cancer case ascertainment by sex (i.e., similarity or lack thereof in males and females) with the acknowledgement of contextual obstacle in cancer registration i.e., gender-bias.
In chapter 5, literature review is carried out regarding utility of sex-ratio methodology in different diseases. Previous studies using sex ratios in incidence or mortality of different diseases such as multiple sclerosis, Parkinson’s disease, rheumatoid diseases, infectious diseases, and cardiovascular diseases as a tool to generate hypotheses are highlighted in addition to cancer. The purpose of this chapter is to illustrate that sex ratios of incidence and/or mortality have been successfully used in other diseases and that the variability of SR can be a used as a guide to interpret trends and help investigators to generate hypotheses regarding cancer etiology.
13
Chapter 6 presents rationale and objectives of the study. Chapter 7 presents the
methodology used to carryout analysis on sex ratio variability, first in three-time periods, and then followed by analysis on long standing cancer registries. Details on mixed-effects
regression modelling, spatial analysis, and analysis on gender inequality are also presented. Chapter 8, presents results such as descriptive statistics, regression models and the
interpretations, spatial autocorrelations through Moran’s Index in two continents, and also predicted average sex ratio changes in cancer registries according to low and high gender inequality countries in four types of smoking related cancers.
Finally, in Chapter 9, we discuss the results, and highlights the value of inductive form of inferences based on observations and trends, and present tentative hypotheses and raise few questions based on observations and trends. In this chapter we also theorize the observations based on self-point of view, which is again an important part of inductive reasoning. We discuss the role of possible gender bias in cancer registration and recognize strengths and weaknesses of the study. The thesis ends with some concluding remarks and
acknowledgement on the important gaps that exists in understanding causes of cancers.
14
Chapter 2
Background Review on measures of cancer burden
The text in chapter 2 that follows discusses two most important measures of cancer burden i.e., incidence and mortality, and their complementary and contrasting nature. These two statistics in which cancer burden is expressed are both useful in the investigation of cancer etiology (54-59) as well as for understanding cancer disparities or inequalities in different parts of the world (60).
In planning and evaluation of public health strategies, temporal investigations of cancers have important implications, yet they are complex phenomenon to study because of
limitations associated with them (as pointed out in Chapter 1). Investigations of the changing temporal patterns of cancer incidence and mortality are considered standard epidemiological tools in public health surveillance. Long standing data from cancer registries and vital sources enables quantification of incidence and mortality rates over time and may provide clues as to the underlying determinants (7, 8). Changing rates over time is ‘supporting
evidence’ to inferences regarding causality if the temporal patterns make sense, and provided that sufficient time lag is there, to the (known or unknown) distribution and prevalence of one or several risk factors. These analyses of incidence and mortality trends may generate or establish novel hypotheses or provide confirmatory evidence of existing ones.
Ecological studies based on geographic variation of cancer incidence and/or mortality rates have made important contributions to exposure-cancer hypotheses (55). For example, the hypothesis on ultraviolet-B -Vitamin D and cancer was first proposed based on the map of colon cancer mortality rates in the US which portrayed that the mortality rates were correlated with annual sunlight doses (61). The investigators proposed that because Vitamin D production was the most important physiological effect of sunlight in humans, it suggested
15
mechanism linking sunlight to a reduced risk of cancer. In the ensuing years, the hypothesis was extended to other types of cancers across a wide range of geographic regions (59, 62-68).
The international pattern of cancer incidence and mortality can point to regions of the world where research efforts may be particularly worthwhile e.g., comparisons of human papilloma virus infection in Denmark and Greenland with a five-fold difference in cervical cancer incidence led to preventive efforts in those countries in next decades (21, 69). International comparison of cancer occurrence therefore provides clues to etiology, and the demonstration of variation in incidence (and mortality) has made an important contribution to the recognition of the environmental origin of many cancer types (70-72). Statistics by age and sex show widely different patterns and variations between cancer types. In their textbook on cancer registration and principles, Jensen et al., writes that such basic features of
measures of cancer burden may not always be easily understood and explained, but they should provoke the curiosity and are useful in the generation of etiological hypotheses (21).
Therefore, in many instances, it has been shown that efforts to reduce the global cancer burden, its causes, and disparities can be initiated with an understanding of geographic patterns in cancer incidence and mortality. The next sections present definitions of cancer incidence and mortality, and why incidence can be a better measure of cancer burden than mortality in terms of understanding cancer causes.
16 2.1 Cancer incidence
2.1.1 Definition
Cancer incidence is defined as the number of new cancer cases occurring in a defined population within a specified period of time. The number of new cancer cases is commonly expressed as a rate per 100,000 persons per year that approximates the average risk of developing a cancer, and is used for comparisons between populations (73).
Age-standardized incidence rates (ASIR) are used for comparison purposes between populations that have different age structures. The term rate is often used interchangeably with the risk of developing a cancer, but, strictly speaking, risk is a proportion and describes the
accumulation of the effect of rates over a given period of time e.g. the cumulative risk (40). Incidence is determined by exposure to etiologic factors and individual susceptibility and may be further affected by screening practices, health care access, and quality of care (73).
2.1.2 Sources of data and quality
Cancer incidence data are product of population-based cancer registries, whose main function is to collect and classify information on all new cases of cancer in a defined population, and provide statistics for assessing the impact of cancer in the population (21, 74). The recording of individuals with cancer followed several failed attempts at producing good quality cancer morbidity statistics. Cancer surveys in Europe in the first decade of twentieth century resulted in poor participation rates, while analyses of several metropolitan areas in the U.S. in 1937-38, 1947-48 and 1969-71 were eventually considered to be not of much use (75). However innovations in methodologies from pilot studies in the 1930s brought about a more successful system that reported cases by name, eliminating multiple
17
registrations and allowing the follow-up of individual patients (75). Background on the inception of cancer registration and its utility in surveillance is provided in Chapter 3.
Cancer registries are effectively utilized in incidence-trend studies provided that the quality control measures are well placed. The purpose of these registries is also to produce timely information on the incidence, and as such, play a pivotal role in public health and epidemiological research. One of the most important quality issue is the completeness of cancer case ascertainment which is the extent to which all the incident cancers occurring in a target population are included in the registry database. There are numerous techniques used to evaluate registry completeness (17), including: 1) methods that evaluate the data sources themselves (number of sources/notifications per case, percentage of cases histologically and morphologically verified (%MV), and methods based on death certificates); 2) methods that involve independent case ascertainment (rescreening of cases, capture-recapture methods, the mortality:incidence (M:I) ratio); and 3) historic data methods (stability of incidence over time, comparison of incidence in different populations, age-specific incidence curves). Some of these methods that are broadly classified as quantitative and semi-quantitative are
critically reviewed in Chapter 4.
2.1.3 Factors affecting assessments of incidence over time
Concerning the issues of detectable artifacts (e.g., instances where specific artifacts for a specific cancer type can be recognized), Bray (6, 10) highlighted several seminal papers by Saxen (29, 76) and Muir (30) in his discussion on factors that complicate assessments of certain cancer types over time. These researchers have listed some of the factors as follows:
18
a) International Classification of Disease (ICD):
Changes in classification and codes of ICD has brought about the possibility of
artefactual changes in time trends. Changes in the content of the ICD in consecutive revisions have had considerable effects on the evaluation of time trends; in particular with cancers of the lung and liver. The demand for a better delivery of detail in classification at the level of subsite in each successive volume of ICD has led to an awareness of lack of comparability.
b) Definition of malignancy:
The definition of the tumor can change over time since there has been an increasing likelihood of observing evidence of malignancy in tissue samples through improving
technology by pathologists. For example, the increase in cancers of the thyroid may, at least in part, be due to an increasing tendency to interpret papillary change as malignant. Registry practices regarding the coding of invasiveness of bladder tumors have also shifted
accordingly (6).
c) Latent carcinoma:
There is also an increasing likelihood of incidental diagnoses of tumors that may not have progressed to invasion. The ICD does not make any provision for such cancers, and
interpretation of cancer incidence over time should, therefore, take a particularly cautious approach. For example, latent carcinomas of a particular type that are coded as malignant are influenced by some intervention or opportunistic screening. A classic example can be
prostate coded as malignant which can be influenced by trans-urethral resection of prostate and prostate- specific-antigen.
19 d) Effects of screening programs
Stage of progression at which cancer or pre-cancerous lesions are detected are modified by screening programs. Slow-growing tumors are therefore more likely to be diagnosed than under normal conditions. For example, in the case of breast screening programs, the classical model involves a temporary, artificial, increase in the observed incidence as a result of the early diagnosis of malignancies that would have eventually become clinically manifested in time.
e) Changes in medical practice
Changes in the trends regarding presentation of patients for diagnosis, the availability of medical services and the ability of the doctor to make diagnoses can influence the likelihood of a cancer being diagnosed, as well as the accuracy of the recorded information. Examples include an increasingly aggressive investigation of illness in the elderly, e.g. for brain tumors, there is an inclination towards greater specialization in the field, increasing use of treatment guidelines, and specialist referrals.
f) Population denominators
In the definition for incidence rate, the denominator is the person-time usually taken from population estimates. These people should be at risk of having a neoplasm, however this assumption is not met in some cases. An important example is the need for adjustment for prevalence of hysterectomy in the female population in the study of uterine cancer trends e.g., Luoto et al., used information on hysterectomy to derive uteri-at risk and cervices-at-risk populations to correct gynaecological cancer rates in Finland (77). The premise of their study was that an increasing proportion of women in some European countries have
20
certain gynecological cancers, particularly endometrial cancer. This is the case where an adjustment to the person-time would be desirable. Unadjusted trends may not provide a more accurate temporal description that does not account for the prevalence of a condition (in this case, hysterectomy) in the population.
g) Registration practices
With time, improvement in the completeness of registration may also produce artefactual changes in the incidence trends. Registries may differ in their operational rules regarding the inclusion of cancer types where there is difficulty in distinguishing between malignant, benign and unspecified tumors. The major problems are seen in tumors of the brain and bladder, although trends in melanoma of the skin and thyroid may also be affected by this artifact. Trends in bladder cancer incidence are very difficult to interpret without precise information on how registries have dealt with papillomas over time. It has been shown that, on the exclusion of papillomas of the bladder, much of the variation in bladder cancer incidence rates in the Scandinavian countries was removed (29, 76). Overall, changes in registration practises over time are more likely to affect comparisons between registries, rather than trends in a single registry (10, 30).
2.1.4 Geographic variations in incidence rates
In 2012, there were an estimated 14 million new cancer cases worldwide, with 45% of these cases seen in Asia, 26.0% in Europe, 14.5% in North America, 7.1% in Central/South America, 6.0% in Africa, and 1.0% in Oceania (73). Cancers of the lung, stomach, colon and rectum, liver, and esophagus have the highest incidence worldwide (55, 73).
Cancer incidence varies considerably across geographic regions, and this variation is generally more pronounced between less- and more-developed regions (74). As discussed in
21
the preceeding sections of this chapter, the variability is cancer-specific; that is, for some types of cancer, region A may have higher rates than region B, while for other types, region B may have higher rates than region A. This variability could be due to true differences in incidence resulting from inter-regional variability in cancer risk factors, and/or it can be due to artifacts. International comparisons of cancer incidence have been fundamental in the development of hypotheses regarding cancer etiology (3, 67, 72) which are typically addressed in analytical studies. As well as providing hypotheses for investigation, inter-regional comparisons of cancer incidence also provide information to identify which populations to study to address specific hypotheses (19).
There are numerous examples illustrating that geographic comparisons of cancer
incidence give rise to hypotheses that were eventually instrumental in establishing cancer risk factors. (3, 67, 72, 75-77). Lemrow et al. and Wiggins et al. analyzed cancer incidence rates in the USA and found that incidence rates varied among Native Alaskan populations and Native populations in other parts of North America, and also that they often differed from rates among non-Hispanic whites (78-80). The study hypothesized the effects of behavioral causes such as obesity, tobacco use, and physical inactivity. Epidemiological studies have been carried out to confirm the association of these factors along with infectious agents and genetic factors in cancers (78)(81-85). Micheli et al. reported large differences in the prevalence of certain cancers in the USA (86) and in countries included in the European registry (87). Richer areas in Europe had higher prevalence rates, suggesting that incidence varied with economic development.
In China, investigators noted a very high incidence of esophageal cancer in a small city in the northeast of the country and in towns located around the city (88). Speculation about
22
environmental and dietary factors were underpinnings of findings that ensued with theories on temperature of the food, scraping of the esophageal lining due to eating dried corn husks, eating moldy bread, and the quality of the soil in the region. Investigators in a subsequent case-control study also noted a novel serological association with the human papilloma virus and the risk of esophageal cancer while working on previous theories (89). This was
followed by several studies carried out in other regions in China and worldwide (90-92).
Studies comparing incidence rates of cancers have historically provided significant leads about environmental, nutritional and behavioral causes. The often cited estimate that 80% of the cancer burden worldwide is due to environmental factors is derived from observed geographical variation in cancer rates (67). Comparisons of incidence rates have also been useful in migrant studies of relocated ethnic populations, with rates that dominate in the country of origin as well as in the host countries (93-95). These studies have been useful in understanding the relative importance of genetic and environmental factors in cancer etiology.
Comparisons of incidence rates worldwide serves as the background for creating
international and national strategies for cancer prevention and control. High cancer incidence rates affect national economies, social development programs, and national public health system of individual countries. The information on incidence trends is useful in making plans for health promotion and serves as a guide for future scientific research. Therefore, obtaining complete and accurate information on cancer incidence is crucial (78).
As detailed earlier, the cancer incidence rate is a preferred measure for uncovering differences in the geographic occurrence of cancer. Unfortunately, in many regions,