Any correspondence concerning this service should be sent to the repository administrator:
[email protected]
This is an author-deposited version published in:
http://oatao.univ-toulouse.fr/
Eprints ID: 13706
To cite this version:
Munoz Cuartas, Victor and Vales, Benjamin and Perrin, Marianne and Pastor,
Marie-Laetitia and Welemane, Hélène and Cantarel, Arthur and Karama,
Moussa
Coupling infrared thermography and acoustic emission for damage
study in CFRP composites
. (2014) In: The 12th International Conference on
Quantitative InfraRed Thermography - QIRT 2014, 7 July 2014 - 11 July 2014
(Bordeaux, France).
Open Archive Toulouse Archive Ouverte (OATAO)
OATAO is an open access repository that collects the work of Toulouse researchers and
makes it freely available over the web where possible.
Coupling infrared thermography and acoustic emission for damage study in CFRP
composites
by V. Munoz *, B. Vales*, M. Perrin**, M.L. Pastor**, H. Welemane*, A. Cantarel** and M. Karama* * Univ. Toulouse, INP-ENIT, LGP, 47 avenue d’Azereix, F-65016 Tarbes, France, [email protected],
[email protected], [email protected], [email protected]
**Univ. Toulouse, IUT Tarbes, ICA, 1 rue Lautréamont F-65016 Tarbes, France, [email protected], [email protected], [email protected]
Abstract
Improvement of the design and reliability of aeronautical composite structures requires an identification and characterization of their damage evolution. By providing surface thermal fields, infrared thermography has allowed considerable progress in the detection of degradation phenomena. On the other hand, acoustic emission is employed to record the transient waves resulting from released energy during a damage process. This study intends to combine simultaneously these nondestructive methods to investigate the damage behaviour of carbon-fibre composites under tensile load. Experimental results show some correlations between thermal and acoustic events induced by the load according to the damage development.
1. Introduction
The use of composites in the aerospace industry has increased dramatically since the 1970s. The primary benefits of composite structures are the reduction of weight and the simplification of assembly. Composite materials such as carbon fibre-reinforced composites are very used for many structural applications [1]. When they are in service, different types of mechanical and thermal loads are applied to these structures, resulting delamination or disbonding for high level of solicitations. Defects such as random inclusions or undesirable material have also been found during the manufacture process of composite materials [2]. These damages or defects may decrease even more the composite structures reliability lading consecutively to the introduction of high safety factors.
To optimize the design of composite structures, it is then required to identify and characterize as precisely as possible the damage evolution of these materials. The identified information will then allow predicting the behaviour of the structure by the use of adjusted models.
Nondestructive experimental characterizations show nowadays a major advantage for studying the damage process. In the aeronautic industry, there exists various nondestructive testing (NDT) used either for health monitoring of the aerostructure [3,4] or for damage mechanisms monitoring [5]. Some results have showed that infrared thermography and acoustic emission are qualified techniques for these studies, either for monotonic or fatigue tensile mechanical loads [6].
Infrared thermography (IT) is a non-destructive, non-intrusive, non-contact technique that provides mapping of thermal patterns (or thermograms) on the surface of objects. In the mechanical field, the measured radiation can result from two kinds of sources: an external excitation (halogen lamps, xenon flash, etc.) or from the deformation of the material itself due to the thermoelastic couplings and the dissipations. This method has been used for monitoring damages under stress in monotonic loading [2] or fatigue [7].
Acoustic emission (AE) has been developed to acquire in situ information during a mechanical load of a structure. The energy released during a damage process is detected by piezoelectric sensors in form of transient elastic waves. About 15 waveform parameters (amplitude, energy, counts…) can be studied from the acquired waves. These information can be then used to correlate the acoustic emission activity with the damage evolution of the materials. Some works have showed that damage in composite materials such as matrix cracking, fibre cracking or interfacial debonding can be identified by the use of acoustic emission [8,9].
Some other works have showed that these both techniques (IT and AE) can be correlated for damage identification and characterization. By combining both methods, it is possible to acquire in situ information about the fatigue damage in metallic materials, ceramic or glass composites [5,6,10]. Nevertheless, the coupling of surface temperature (thermograms acquired by IT) with AE parameters can be difficult in the case of monotonic load of composite materials due to low temperature variations [7]. The temperature itself could reveal some important dissipative phenomena [2] but yet it should not be considered as a relevant indicator since it does not take into account the external exchanges with the outside for example [11]. That is why the damage analysis with IT should be studied through the heat source and not only through the surface temperature variations.
The aim of this paper is to combine infrared thermography with AE parameters for damage identification in carbon-epoxy unidirectional laminates subjected to axis and off-axis tensile loads. In the case of IT, analyses are done by determining the heat source fields from the temperature fields by taking into account the anisotropic material
symmetry [7]. In the case of AE, Unsupervised Pattern Recognition Algorithms are used to identify the damage mechanisms.
2. Specimen and experimental setup 2.1. Specimen
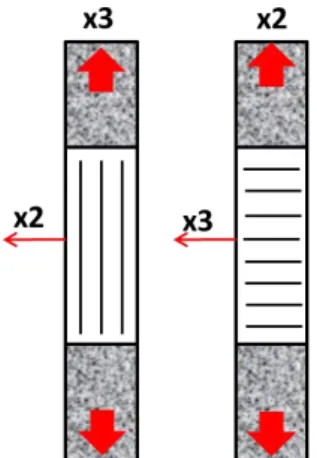
A carbon fibre reinforced laminate is considered for this study. The composite is made of 14 unidirectional plies of prepreg Hexply M10R/38%/UD150/CHS leading to a 2 mm thickness composite with fibre volume fV of 62%. The reference of the fibre is TORAY T700S. Sample fabrication is carried out using the manual lay up technique. Then the sample is cured at 125°C during 90 minutes at a pressure of 2 bars. This sample is representative of a transversely isotropic composite. To obtain the tensile samples, the cured plate is cut according to the standard ISO 527-5 [12]. Two composite directions are obtained after cutting the plate (0° and 90°). Figure 1 shows the axis fibre direction (direction x3) for each category of specimen.
Fig. 1. Fibre direction for each kind of specimen
The thermophysical properties are given in table 1. ρ is the density measured experimentally; C is the specific heat provided by the data software Granta CES selector; α is the coefficient of thermal expansion obtained by [13]; kLf (respectively kTf)are the heat conduction coefficient of the fibre in the longitudinal (respectively transversal) direction given by fibre manufacturer (Toray Carbon Fibers Europe); km is the heat conduction coefficient of the matrix (epoxy) indicated in the software Granta CES selector; time decrement τ is experimentally evaluated by warming the specimen
and then by waiting to the return to initial temperature.
Table 1. Thermal properties of the carbon/epoxy laminated composite obtained from different references
Properties ρ C τ αL αT kLf kTf km
Units [kg m-3] [J kg-1 °C-1] [s] [C-1] [C-1] [W m-1 C-1] [W m-1 C-1] [W m-1 C-1] Values 1449 1000 4.7 -0.12x10⁻⁵ 3.40 x10⁻⁵ 9.4 1.6 0.4 References Measured CES Measured [13] [13] Toray Toray CES
2.2. Experimental setup
The tensile tests are made at ambient temperature. These tests are performed with an electromechanical testing machine INSTRON 5500. 2 tests are carried out according to the fibre direction, 0° (axial load along the direction x3) and 90° (axial load along direction x2) (figure1). To check the reproducibility of the response, three specimens are considered for each loading direction.
The thermal acquisition is done with a FLIR Titanium SC7000 retrofitted camera. Automatic calibration, control of the camera and data recording are done by Altair software. Acquisition frequency is 150 Hz. So as to limit surrounding influences, a data processing after the acquisition phase has provided the temperature variations fields ΔT = T - T0 over the sample, with T the temperature field at time t and T0 the temperature field in the initial state t = 0. Such relative analysis avoids the most disturbing effects, including environmental ones, and highlights the thermal events induced in the material.
The acoustic emission activity is recorded during the tensile test using AEwin for SAMOS software. The data acquisition system is composed by a PCI8 board in which two channels are used. The AE monitoring is conducted using two piezoelectric sensors mounted on one side of the specimen. The sensors are attached using mechanical support while supplying the necessary acoustic coupling agent. The WD sensors are wideband with frequency band-width between 100 kHz and 1 MHz. In view of environmental noise in the laboratory, the acquisition threshold is set to 32-35
dB. The acquired signals are amplified by 40 dB. Two sensors have been positioned at the top and bottom of the specimen in order to derive the location of the AE events. The full experimental setup is shown in figure 2.
Fig. 2. Experimental setup 3. Heat source identification
As explained in the introduction section, the purpose of the present study is to correlate AE information with the heat source obtained by infrared thermography. Heat source st produced by the material is composed of the mechanical dissipation and of the thermoelastic coupling (temperature and strain). The heat source assessment is based upon the following assumptions: the temperature variation has no influence on the microstructure state, internal coupling sources are neglected, external heat rext does not depend on the time, coefficients k, ρ and C remain constant during the test and heat sources are assumed homogeneous through the thickness (low thickness compared to the sample’s length and width). Under these assumptions, the heat diffusion equation can be written as follows (Eq. (1), [11]).
(
) (
⃗⃗⃗⃗⃗⃗⃗⃗⃗⃗ )
(1)Regarding the heat sources determination, one of the main contribution of this work is to take into account the anisotropic symmetry of the material. Existing works often deal with isotropic materials (especially metallic, [7,14]) in which the thermal conductivity k remains a scalar value. In our case, 2D orthotropy is considered. It means that the second order conductivity tensor exhibits two eigenvalues related to fibre and transversal directions of the material. In view of the lack of experimental data, this work relies on a homogenization approach to address such issue. In agreement with the material morphology, the Mori-Tanaka approach [15,16] is used to derive the effective thermal conductivity of the material by assuming fibres as infinite length cylinders inclusions [17]. Expressions of thermal conductivities related to fibre direction and to the transversal direction are detailed in Eqs. (2) and (3) and table 2 gives the numerical results in the present case.
(
)
(2)
[
( ) ( )
( ) ( )
]
(3)Table 2. Effective conductivities of the composite according to the fibre direction
Conductivities [W m−1 C−1] [W m−1 C−1]
Values 5.98 0.87
To determine the heat source, a spatial-median filter is first applied to the recorded thermal fields due to high noise in the recorded temperature. That operation takes the temperature of the pixel and replaces it by the median value
of all the pixels in its spatial surrounding [18]. This operation is carried out for each thermal frame in the analyzed game of frames.
To solve Eq. (1), the classical left derivation is applied for temporal term ( ) and for the spatial conduction laplacian term ( ( ⃗⃗⃗⃗⃗⃗⃗⃗⃗⃗⃗ )) central derivation is used. This type of derivation is commonly used in signal processing field [18]. Filtering on the derived terms is needless due to well reduction of noise of the thermal fields with the spatial-median filter.
4. Pattern recognition method of AE
Noesis Software is used for post processing of the recorded acoustic emission signals. Pattern recognition techniques are applied by the use of k-means algorithm for acoustic emission signal classification [19]. The aim is to identify the damage mechanisms for each fibre direction. For instance, some works [9,20] have showed that fibre breakings, interphase failures and matrix crackings can be identified separately by this way.
K-means is a simple iterative algorithm, aims at minimizing the square error for a given number of clusters. The algorithm, starting with the initial clusters specified, assigns the remaining points to one of the predefined clusters by nearest neighbour classification. The cluster centers are updated and the process continues until none of the patterns changes class membership [19].
The classification procedure is investigated with several different features and number of classes. The features taken into consideration are chosen according to their degree of correlation to each other and can be different for each loading direction (that is for each damage process involved).
5. Results
For 0° specimens, AE analysis is based on rise time, energy, duration and amplitude. Those four parameters are correlated to identify 3 classes, each class corresponding to one specific damage mechanism.
For 90° specimens, rise time, duration and amplitude are the features chosen to converge into 2 classes. Fibre breaking is not a damage mechanism for 90° specimens.
With the purpose of correlating acoustic emission to heat sources, two assumptions are taken into account. The liberation of energy due to a specific damage phenomenon produces an acoustic emission and a heat source at the same time. The second assumption is that the acoustic emission with the most high amplitude and energy is related to a high heat damage source.
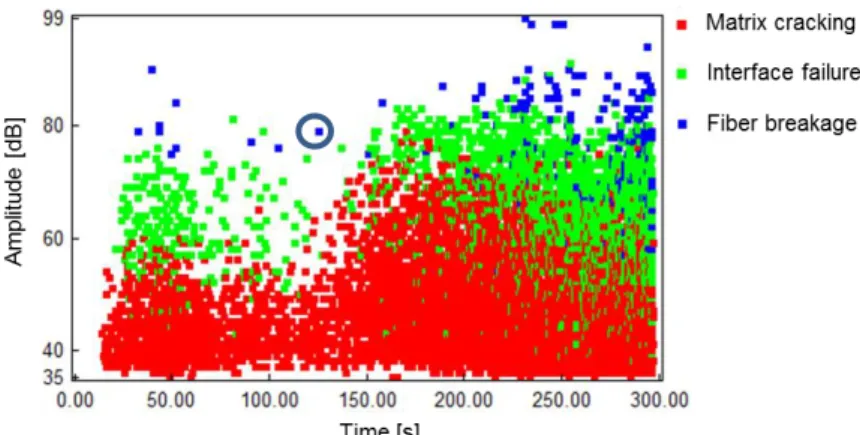
5.1. Correlation results for 0° tensile test
Figure 3 shows on the amplitude versus time graph the classes of AE data obtained after the application of the pattern recognition method. Three groups are clearly distinguished. The red group with the lowers amplitudes corresponds to the matrix cracking, the green group refers to the debonding and interphase failure and the last blue group corresponds to the fibre breaking. We can see that the fibre breaking generates AE at high amplitudes in regards to the others damage mechanisms.
Fig. 3. Cluster results of acoustic emission for 0° tensile test
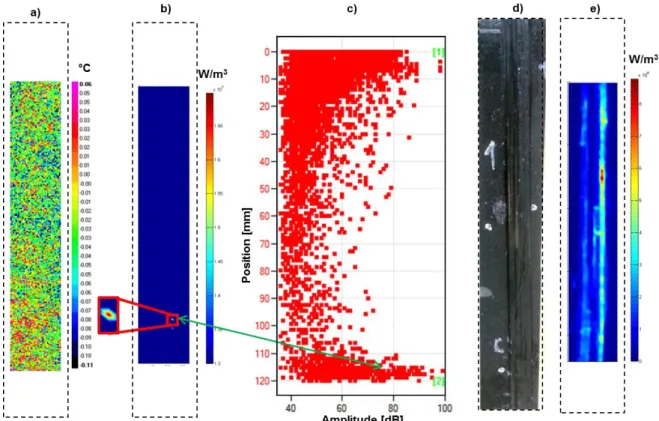
Correlations between AE and TI measurements have been done between several heat sources and acoustic events of high amplitude and high energy. As an illustration of the analysis, the procedure and results are explained here on the case of the one specific AE event selected on figure 3. Figure 4 shows the thermogram (figure 4a), the heat source (figure 4b) and the located amplitude (figure 4c) for this damage that appeared at 128.428 seconds after the beginning of the tensile test. According to the figure 3, this damage (at this specific time) corresponds to a fibre breaking. We can see that the amplitude of the analyzed acoustic event is around 79 dB (figure 4c). To correlate that specific AE to
the heat source, it is needed to analyse the maximum of heat source at a specific timespan. We have considered an interval of 1 s around the AE event (128.428 0.5 s) which includes 150 thermal frames. During this timespan the maximal heat source is obtained at 128.407 s. (error of 0.02%) for the pixel highlighted in figure 4b. Figure 5 shows that for such analyzed pixel, the heat source gets indeed its maximal value at the AE event time.
Fig. 4. Correlation between heat source and acoustic emission amplitude for the 0° specimen
Figure 4c provides the location of AE events during the test. Events take place all along the specimen length, which stands in agreement with the post-mortem observation shown in figure 4d and its heat source (breaking time) (figure 4e). We can clearly see that the final breaking of 0° specimens results from macroscopic debonding in the fibre direction.
Regarding the specific event highlighted in figures 3 and 4b, we can see that the location of the heat source and acoustic event stand in the same zone of the specimen (lower part) near the sensor number 2 (indicated by the green number 2 in figure 4c). The error of the AE location in regards to the heat source is 25%. However, it is important to note here that the location in AE is done by measuring the velocity of the wave for each specimen in the initial state. The slight difference in location may thus be explained by velocity change induced by the damage and load applied.
5.2. Correlation results for 90° tensile test
The same analyzes were carried out for 90° specimens. In this case, not the amplitude but the acoustic energy is taken in consideration for the analysis.
Figure 6 shows the classes of AE for the 90° specimen. As explained before, only two groups are needed according to the damage mechanisms for this fibre direction: the red group represents the matrix cracking and the green group refers to debonding. The AE corresponding to the matrix cracking have the lowest energy and amplitude. In this case the analyzed AE corresponds to a debonding (selected AE event in figure 6). This allows observing that debonding or delamination also create heat sources as important as the fibre breaking.
Fig. 6. Cluster results of acoustic emission for 90° tensile test
In the same way, a specific timespan is selected for the analysis. Figure 7 shows the thermogram (figure 7a), the heat source (figure 7b) and the located acoustic energy (figure 7c) for the selected damage at 42.220 seconds after beginning the tensile test. As explained above and according to figure 6, this damage (at this specific time) corresponds to an internal debonding. The acoustic energy for this specific damage is 38 aJ (figure 7c) which is high in regards to the others AE. For the analysis we have considered an interval of 1 s (42.220 0.5 s) which leads to 148 thermal frames to be analyzed. During this timespan the maximal heat source is founded at 42.216 s. (error of 0.01%) (Figure 7b). Again, figure 8 shows the correspondence between AE event and maximal value of the heat source for the analyzed pixel. Some high heat sources can be seen some milliseconds before and after the analyzed instant but should be considered as parasite events generated by some thermal noise since they do not correspond to any AE.
In this case, the location of the heat source and the acoustic event are also in the same zone of the sample (near sensor number 1) with an error of 21%. In addition to the changes in velocity, such difference may be related to much more brittle character, and therefore instable of the failure in that case. Indeed, it is shown in figures 7d and 7e the final failure breakdown occurs in the fibre axis, induced by the failure of the weakest point of the epoxy matrix (the breakdown is transversal to the load axis). The full load of the tensile test is supported by the matrix (epoxy) and so the break takes place transversally to the load axis.
Fig. 8. Heat source variation 0.5 s before and after the studied instant for the analyzed pixel (90° specimen) 6. Conclusions
In this study, combined analysis of carbon-epoxy composite subjected to axis and off-axis tensile tests is done by means of acoustic emission and infrared thermography measurements. Heat sources are obtained from the processing of the thermal fields and by using homogenization technique (Mori-Tanaka approach) to derive the effective orthotropy conductivity tensor. Acoustic emission technique is also used as a damage detection technique to identify and locate the damage events during the load.
By the use of Unsupervised Pattern Recognition Algorithms, three damage mechanisms are found in specimens at 0° according to the load axis matrix cracking, debonding and fibre breaking). In the case of 90° specimens, two damage mechanisms are found (matrix cracking and debonding).
Disbonding and fibre breaking are damage mechanisms that produce heat sources. It is found that acoustic emissions with high amplitude and high energy can be well correlated to high heat sources produced by these damage mechanisms evolutions. The accuracy of detection in the time is very optimal, while accuracy regarding the location is not precise and could be attributed to velocity change during the test.
Further works need now to be conducted to decompose the total heat source between the mechanical dissipation and the thermoelastic coupling. Also, this combined measurement approach should be put in place for the analysis of damage process of composite under dynamic load (fatigue) to confirm the correlation between acoustic and thermal events.
REFERENCES
[1] Soutis C., “Fibre reinforced composites in aircraft construction”. Progress in Aerospace Sciences, vol. 41, pp. 143-151, 2005.
[2] Goidescu C., Welemane H., Garnier C., Fazzini M., Brault R., Péronnet E., Mistou S., “Damage investigation in CFRP composites using full-field measurement techniques: combination of digital image stereo-correlation, infrared thermography and X-ray tomography”. Composites : Part B, vol. 48, pp. 95-105, 2013.
[3] Staszewski W.J., Mahzan S., Traynor R., “Health monitoring of aerospace composite structures – Active and passive approach”. Composites Science and Technology, vol. 69, pp. 1678-1685, 2009.
[4] Garnier C., Pastor M.L., Lorrain B., Pantalé O., “Fatigue behavior of impacted composite structures”. Composite Structures, vol. 100, pp. 443-450, 2013.
[5] Naderi M., Kahirdeh A., Khonsari M.M., “Dissipated thermal energy and damage evolution of Glass/Epoxy using infrared thermography and acoustic emission”. Composites : Part B, vol. 43, pp. 1613-1629, 2012.
[6] Kordatos E.Z., Dassios K.G., Aggelis D.G., Matikas T.E., “Rapid evaluation of the fatigue limit in composites using infraredlock-in thermography and acoustic emission”. Mechanics Research Communications, vol. 54, pp. 14-20, 2013.
[7] Pastor M.L., Balandraud X., Grédiac M., Robert J.L., “Applying infrared thermography to study the heating of 2024-T3 aluminium specimens under fatigue loading”. Infrared Physics & Technology, vol. 51, pp. 505-515, 2008.
[8] Loutas T.H., Kostopoulos V., “Healt monitoring of carbon/carbon, woven reinforced composites. Damage assessment by using advanced signal processing techniques. Part I: Acoustic emission monitoring and damage mechanisms evolution”. Composites Science and Technology, vol. 69, pp. 265-272, 2009.
[9] Kempf M., Skrabala O., Altstädt V., “Acoustic emission analysis for characterisation of damage mechanisms in fibre reinforced thermosetting polyurethane and epoxy”. Composites: Part B, vol. 56, pp. 477-483, 2014. [10] Kordatos E.Z., Aggelis D.G., Matikas T.E., “Monitoring mechanical damage in structural materials using
complementary NDE techniques based on thermography and acoustic emission”. Composites: Part B, vol. 43, pp. 2676-2686, 2012.
[11] Chrysochoos A., “Infrared thermography, a potential tool for analysing the material behaviour”. Mécanique et Industries, vol. 3, n°1, pp. 3-14, 2002.
[12] Standard NF EN ISO 527-5. “Plastics - Determination of tensile properties - Part 5: Test conditions for unidirectional fibre-reinforced plastic composites”. AFNOR, 2009.
[13] Gay D., “Matériaux composites”. Fifth edition, edition: Lavoisier, chapter 3, 2005.
[14] Kaganova I.M., “On calculation of effective conductivity of inhomogeneous metals”. Physics Letters A, vol. 312, pp. 108-118, 2003.
[15] Phan T.H., Férec J., Picandet V., Tronet P., Costa J., Pilvin P., “Etude expérimentale et numérique de la conductivité thermique d’un composite chaux-chanvre”. XXXe
Rencontres AUGC-IBPSA, Chambéry, France, 2012.
[16] Gruescu C., Giraurd A., Homand F., Kondo F., Do D.P., “Effective thermal conductivity of partially saturated porous rocks”. International Journal of Solids and Structures, vol. 44, pp. 811-833, 2007.
[17] Do D.P., “Application des approches d’homogénéisation à l’étude des propriétés themo-hydro-mécaniques des roches. Application aux argilites”. PhD thesis, Université de Lorraine, 2008.
[18] Vales B., “Caractérisation thermo-mécanique de l'endommagement des composites stratifiés par Thermographie Infrarouge.”. Masters thesis, Ecole Nationale d’Ingénieur de Tarbes, France, 2014.
[19] Noesis© 5.6.50 Reference Manual, “Advanced Acoustic Emission Data Analysis Pattern Recognition & Neural Networks Software for Acoustic Emission Applications”. V8, Envirocoustics S.A., 2011.
[20] Kostopoulos V., Loutas T., Dassios K., “Fracture behavior and damage mechanisms identification of SiC/glass ceramic composites using AE monotoring”. Composites Science and Technology, vol. 67, pp. 1740-1746, 2007.