To link to this article: DOI:10.1016/j.compositesb.2015.09.011
http://dx.doi.org/10.1016/j.compositesb.2015.09.011
This is an author-deposited version published in:
http://oatao.univ-toulouse.fr/
Eprints ID:
14695
To cite this version:
Munoz, Victor and Vales, Benjamin and Perrin, Marianne and Pastor,
Marie-Laetitia and Welemane, Hélène and Cantarel, Arthur and Karama,
Moussa Damage detection in CFRP by coupling acoustic emission and
infrared thermography. (2016) Composites Part B: Engineering, vol. 85.
pp. 68-75. ISSN
1359-8368
O
pen
A
rchive
T
oulouse
A
rchive
O
uverte (
OATAO
)
OATAO is an open access repository that collects the work of Toulouse researchers and
makes it freely available over the web where possible.
Any correspondence concerning this service should be sent to the repository
administrator:
[email protected]
Damage detection in CFRP by coupling acoustic emission and infrared
thermography
V. Munoz
a, B. Val
es
a, M. Perrin
b,*, M.L. Pastor
b, H. Welemane
a, A. Cantarel
b,
M. Karama
aaUniversit e de Toulouse, INP/ENIT, LGP, Tarbes, France
bInstitut Cl ement Ader, IUT de Tarbes, Dpt GMP, 1 rue Lautr eamont, 65016 Tarbes, France
Keywords: A. Carbon fibre B. Thermomechanical D. Acoustic emission D. Thermal analysis
a b s t r a c t
Acoustic emission (AE) and infrared thermography (IT) are simultaneously combined to identify damage evolution in carbon fibre reinforced composites. Samples are subjected to tensile static loads while acoustic emission sensors and an infrared camera record the acoustic signals and the temper-ature variations respectively. Unsupervised pattern recognition procedure is applied to identify damage mechanisms from acoustic signals. Thermodynamic arguments are introduced to estimate global heat source fields from thermal measurements and anisotropic heat conduction behavior is taken into account by means of homogenization technique. A spatial and time analysis of acoustic events and heat sources is developed and some correlation range in the AE and IT events amplitude are identified.
1. Introduction
Nondestructive experimental characterizations allow nowadays promising perspectives for studying the damage process in high-performance engineering materials such as composites. In the particular case of the aeronautic industry, Acoustic Emission (AE) and Infrared Thermography (IT) appear as widely used and advanced techniques for the damage monitoring in materials and aerostructures. With acoustic emission technique, the energy released during a damage process is detected by piezoelectric sensors in form of transient elastic waves. The study of acoustic emission descriptors allows then to identify specific damage mechanisms of composites[1,2]. This identification is done by the use of Unsupervised Pattern Recognition technique that has been used successfully by different authors in the case of glass fibre composites[3,4]. Infrared thermography is an optical measurement technique that provides 2D surface thermal fields. Acquired ther-mal fields can thus reveal and localize overheating related to degradation mechanisms (see works on carbon-epoxy of[5e7]and on glass-epoxy of [8]). Since temperature may be affected by
external exchanges and/or by heat diffusion inside the material itself, the dissipation sources represent even a more accurate in-dicator of damage[9,10].
Some authors have naturally suggested to combine these both techniques. Ref.[11]has shown that it is possible to correlate the damage zone of a glass fibre-thermoplastic composite by both techniques in quasi-static tensile test. Some others correlations between AE and thermal events were thus put in evidenced, mainly in the context of fatigue behavior. For instance, it was noted by Refs.
[12,13]a progressive appearance of hot areas on the composite surface as the number of acoustic hits increases. Mean surface temperature and AE cumulative counts or energy were also corroborated. The time curves of these data exhibit simultaneously inflection points corresponding to transitions between damage modes of the materials[14]. In Ref.[15], crack growth monitored by thermography and the ratio of rise time to amplitude of the waveform exhibit similar trends.
Even if these preliminary studies have confirmed the interest in coupling AE and IT, they only propose a global analysis of AE events, without distinguishing specific mechanisms involved. Regarding thermal aspects, they are mostly limited to temperature-based observations and thus potentially influenced by the surrounding. Few attempts to provide further interpretation are generally restricted by strong assumptions: either a dissipation estimated
*Corresponding author. Tel.: þ33 (0) 5 62 44 42 16.
only from the rate of heat absorption[14]or the single consider-ation of the thermo-elastic coupling[15], heat conduction inside the material being neglected in all cases.
This work focuses on the damage mechanisms in unidirectional carbon fibres laminates subjected to axis and off-axis static tensile loads. The aim is to investigate correlations between AE acquisi-tions interpreted with pattern recognition technique and dissipa-tion fields accounting for anisotropic conducdissipa-tion heat behavior. From this, a relevant spatial and time analysis of acoustic events and heat sources can thus be developed.
2. Materials and experimental work
A carbon fibre reinforced laminate is considered in this study. The composite is made of 14 unidirectional plies [0]14of prepreg
Hexply®
with resin M10R and carbon high strength (CHS) fibres Toray®
T700S and cured in an autoclave at 125C during 90 min at
a pressure of 2 bars. (2 mm thickness, fibre volume fVof 60%). The
cured plate is cut according to the standard ISO 527-5[16]so as to obtain two composite directions (0 and 90). Samples
di-mensions are 250 mm length, 20 mm (for 0tests) and 25 mm (for
90tests) width with heels of 50 mm length. The thermophysical
properties are given inTable 1. The heat conduction coefficients of the transversely isotropic fibres in the longitudinal (kfL) and
transverse (kfT) directions are given by the fibre manufacturer
(Toray®
Carbon fibres Europe). The density (
r
), 2D time decrement(
t
) and elastic properties have been experimentally measured. Precisely,t
is obtained by warming the specimen and then by waiting to the return to initial temperature. Others data, the composite specific heat (C) and the heat conduction coefficient of the isotropic epoxy matrix (km) are provided by the data softwareGranta CES©
selector.
Tests are performed with an electromechanical testing machine INSTRON 5500. Two kind of tests are carried out according to the fibre direction, 0 (axial load) and 90 (transverse load). Digital
Image Correlation (DIC) is performed in order to record by a CCD camera the observations of the visual damage evolution.
The acoustic emission activity is recorded during the tensile test by two piezoelectric WD wideband sensors (frequency band-width between 100 kHz and 1 MHz). They are placed on one side of the specimen, one on the top and one on the bottom of the specimen in order to calculate the location of the AE events (Fig. 1). These sensors are attached using lock pliers while supplying the neces-sary acoustic coupling agent. The data acquisition system is composed by a PCI8 board in which two channels are used and acquisition is computed with AEwin for SAMOS software. The analog filter frequency is set up between 20 and 400 kHz and the acquired signals are preamplified by 40 dB. Peak Definition Time (PDT), Hit Definition Time (HDT) and Hit Lockout Time (HLT), are set at 50, 100 and 500 ms respectively. Pencil break tests are per-formed to identify the wave velocity along the axial direction of the sample. This step thus integrates the anisotropic character of the material since such the velocity is higher in the fibre longitudinal direction (mean value of 9174 m=s with a standard deviation of
173 m=s) than in the transverse one (mean value of 2355 m=s with a standard deviation of 33 m=s). Measurement of environmental noise in the laboratory leads to set the acquisition threshold at 35 dB. According to the space occupied by sensors, the studied area for acoustic emission focuses on the center of the specimen.
The thermal acquisition is done with a FLIR Titanium SC7000 retrofitted camera (thermal resolution of 25 mK, acquisition fre-quency fixed to 150 Hz,Fig. 1). The data recording is done by Altair software. So as to limit most disturbing effects of the environment, a data processing after the acquisition phase has provided the temperature variations fields DT ¼ T ! T0 over the sample, with T
the temperature field at time t and T0the temperature field in the
initial state t ¼ 0. In what follows, specific area of digitized thermal fields are studied so as to focus on the center of sample and not to be disturbed by reflection effects around acoustic sensors. The size of studied area was of 226 " 39 pixels (respectively 154 " 33 pixels), that is 87 mm length for 15 mm width (resp. 94 mm length for 20 mm width) with a spatial resolution (pixel size) of around 0:385 mm (resp. 0:610 mm) for 0(resp. 90) tests.
Finally, the time of the simultaneous acquisitions (AE and TI) is adjusted according to the breaking time of the specimen. This allows to study the spatial and temporal correlation between acoustic and thermal events.
3. Acoustic emission pattern recognition
AE data are in general complex in nature. Regarding damage in composite materials, conventional graphical analysis is not suffi-cient to provide arguments to discriminate different mechanisms involved. In such a case, automated statistical techniques can help to identify correlation between data. In this way, this study uses Unsupervised Pattern Recognition (UPR) techniques to cluster in classes AE signals with similar acoustic signatures. Such post-processing is done with Noesis software[17].
Performances of algorithms implemented in Noesis were compared first on their statistical efficiency measured by the Davies and Bouldin coefficient RDBthat gives information on the
compactness among the results [18]. The best clustering result corresponds to a minimum value of RDB [1,2]. In a second step,
we have analyzed the physical consistency of the discrimination induced by the UPR scheme, that is the relevance of identified classes according to deformation mechanisms observed with DIC technique. According to these two criteria, the most relevant al-gorithm in the present case is k-means, which has been previously used with success on several composite applications[1,19,20].
Given the algorithm, a minimization of the number of de-scriptors is required to enhance the computational efficiency of the data post-processing. Significant descriptors that should be taken into consideration are determined according to their degree of correlation to each other [21] and in agreement with physical mechanisms involved. Accordingly, amplitude, rise time, energy and duration are found to be relevant for damage identification for the 0tensile test, whereas only amplitude, rise time and duration
appear are needed for the 90case. We finally define the optimum
number of classes by the use of the RDBcoefficient. The minimum
RDBvalue is then obtained when the number of clusters (associated
with damage mechanisms) is 3 for the 0tensile test and 2 for the
90 test. Note that such optimization process on significant
de-scriptors and optimum number of classes are the same for the two piezoelectric sensors, meaning that pattern recognition is inde-pendent on the events localization.
Clustering results are presented here according to the amplitude of hits. The assignment of each class to a specific damage mecha-nisms is done according to literature[21,22]and to the images of DIC that are used to compare the visual damage with the generated
Table 1
Physical and thermal properties of the carbon-epoxy laminated composite. Properties Values References Densityr 1449 kg/m3 C Measured
2D time decrementt 4.7 s Measured Fibre conduct. (long. direction) kfL 9.4 W/mC Toray®
Fibre conduct. (transverse direction) kfT 1.6 W/mC Toray®
clusters. Lowest amplitudes and energies are usually related to matrix cracking. The highest amplitudes and the group with fewer signals are related to fibre breakage. The intermediate group cor-responds to interface failure. In this wayFig. 2shows the amplitude versus time for the 3 classes of AE data obtained for the 0tensile
test. The first group with the lowest amplitudes corresponds to the matrix cracking (Fig. 2a), the second group refers to the debonding and interface failure (Fig. 2b) and the last group with highest am-plitudes corresponds to the fibre breakage (Fig. 2c). Generated cluster corresponding to fibre breakage is in accordance with the first visual crack (at t ¼ 230 s) provided by the DIC observed in
Fig. 2d. Especially, the number of AE events related to fibre breakage increases notably before the final failure of the composite, that is from time t ¼ 200 s to t ¼ 300 s.Fig. 3 presents also the classified signals for the 90 tensile test. The lowest amplitudes
correspond to the matrix cracking (Fig. 3a) and highest ones to the
interface failure (Fig. 3b). These results stand in agreement with existing works on same material[22].
4. Heat source identification
The heat source determination is established within the framework of quasi-static processes and small perturbations and is based on classical principles of the thermodynamics of irreversible processes. Following assumptions are assumed for the infrared image processing to obtain the heat source estimation: the tem-perature variation has no influence on the microstructure state, internal coupling sources are neglected, external heat does not depend on the time, coefficients
r
, C and conductivity tensor k(second order tensor) remain constant during the test and heat sources are assumed homogeneous through the thickness (low thickness compared to the length and width of the sample). Under
Fig. 1. Experimental setup.
these assumptions, the heat diffusion equation can be written as follows[9,10]: rC vq vtþ q t ! div"k$grad q#¼ st (1)
where
q
is the relative temperature defined as q ¼ T Treference, 2Dtime decrement
t
is obtained by warming the specimen and then by waiting to the return to initial temperature and st is the totalheat source.
Contrary to existing works that generally deal with isotropic materials, an homogenization-based approach has been used in this work to account for the anisotropic effective conductivity behavior (see details in Ref.[23]). Such a work is based on the Eshelby problem and uses precisely the Mori-Tanaka scheme
[24]. The Representative Volume Element (RVE) (volume U) corresponds to the laminate itself which exhibits a matrix-inclusion morphology, fibres being represented by infinite length cylinders (unit axis x1). Constituents are assumed to be
homogeneous and to follow the Fourier thermal linear law. km¼
kmI denotes the conductivity tensor of the isotropic matrix (with
I the second-order identity tensor) and the conductivity tensor of transversely isotropic fibres kf includes conductivity coefficients
in the longitudinal (kfL) and transverse (kfT) directions of the
fi-bres. The composite effective conductivity tensor k ¼ k1x15x1þ k2ðI x15x1Þ thus accounts for the transverse isotropy of the
material with two eigenvalues related to fibre (k1) and transverse
(k2) directions of the material given by:
k1¼ ð1 fVÞkmþ fVkfL (2) and k2¼ "ð1 þ fVÞkfTþ ð1 fVÞkm ð1 þ fVÞkmþ ð1 fVÞkfT # km (3)
According to values ofTable 1, one obtains in the present case
k1¼ 5:80 W=m$C and k2¼ 0:85 W=m$C.
Last aspect that needs to be handled is the question of discrete and noisy thermal measurements that notably affect time and spatial derivatives entering the heat equation(1). A thermal data processing based on filtering operations is thus absolutely required to provide a relevant interpretation of sources. It was found that the spatial-median filter reduces the noise while preserving significant events related to damage. Filtering on the derived terms is needless due to the important reduction of noise perturbations in the ther-mal fields provided by the spatial-median filter. Note that filtering process and heat source maps production from Eq.(1)are done with Matlab sofware.
5. Results
For the correlation analysis between AE and IT, two analysis steps are considered. In a first step, we intend to correlate heat sources and acoustic events produced by matrix cracking. As explained in Section3, this damage mechanism generates acoustic hits of low amplitude and energy in regards to the interface failure and fibre breaking. The second part of the analysis focuses obvi-ously on interface failure and fibre breakage mechanisms. This work is done in both senses: find heat source correlated with acoustic events and find acoustic events correlated to heat sources. Two assumptions are considered to develop such an approach. The energy liberation due to a specific damage produces simulta-neously an acoustic emission and a heat source; the acoustic emission with the higher amplitude and energy is related to a high heat damage source. In order to show the independence of con-clusions with loading directions, illustrations shown in what fol-lows deal with both axis and off-axis cases. Finally, it is important to note that AEwin software gives the spatial position of events along the specimen but does not provide directly the class of degradation mechanism. In this way, we use AEwin to determine the specific times of two hits of the same event captured by the two AE sensors. With Noesis software, we can then deduce the class of AE events these both times of hits are associated to.
5.1. Low energy and amplitude phenomena
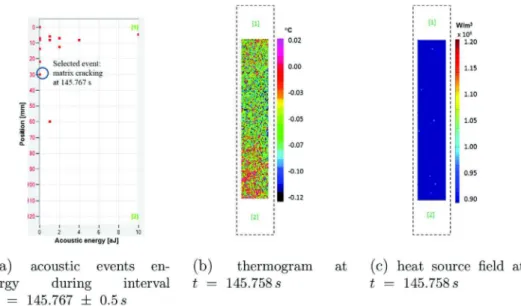
In this approach, we intend to correlate an acoustic event of low energy produced by a weak heat source according to the above mentioned assumptions.Fig. 4a provided by AEwin shows a selected event of 0:1 aJ energy and 42 dB amplitude for the 0$specimen that occurs at time t ¼ 145:767 s (time of the first hit
of that event) after the beginning of the tensile test (corresponding to around 50% of the failure stress). According to the procedure detailed above, this event was found to belong to the damage mechanism class of matrix cracking. Taking into account the travel time of ultrasonics waves along the sample (namely 13:1 ms for a wave velocity of 9174 m=s, and 51:0 ms for a wave velocity of 2355 m=s), a time span of 1 s around the AE event (145:767±0:5 s) should include the related heat source. It is thus needed to analyze the maximum heat source on the frames related to this interval, namely 150 frames according to the sampling frequency. Fig. 4c presents the map of the corresponding maximal heat source (namely 1:2 % 106W=m3) found at t ¼ 145:758 s. It is found in
Fig. 4c that many heat sources of same intensity are randomly distributed on the sample surface at that specific time, and not especially at the location of the AE event. No additional information could even be extracted from the initial thermal map at that time (Fig. 4b). Indeed, temperature variations are too low and noisy to
clearly reveal local dissipative mechanisms. It is thus difficult to make any correlation between acoustic events of low and ampli-tude with heat sources.
Similarly, a weak punctual heat source is taken as a reference to be correlated with an AE event. Fig. 5a shows a selected heat source of 4 105W=m3 for the 90 specimen occurring at time t ¼ 28:689 s (35% of the failure stress). An interval of 1 s is again
considered for the AE analysis (28:689±0:5 s).Fig. 5b shows the acoustic location for the considered interval. However, no acoustic event is found in that time which demonstrates also the difficulty to highlight any connection between weak heat sources and acoustic events.
5.2. High energy and amplitude phenomena
Let us consider now the noteworthy AE event of the 0 tensile test depicted onFig. 6a. This event occurs at time t ¼ 128:428 s (around 45% of the failure stress) and exhibits an energy of 60 aJ for an amplitude of 79 dB. Pattern recognition identifies such acoustic
event as a fibre breaking. Following the same approach as before,
Fig. 6b shows the field with maximum heat source in the interval of 1 s around that time, precisely obtained at t ¼ 128:407 s (error of 0.02%), which confirms the good concordance in time of acoustic and thermal phenomena. Moreover, we can see that the acoustic event and maximum heat source are both located in the bottom part of the specimen, near sensor [2] (Fig. 6). The difference in location between AE and source events, of about 25%, may be explained by the influence of the mechanical solicitation. Indeed, the location of acoustic events is derived from data given by the two sensors by considering the velocity of the wave in the initial state. Load applied and induced damage may thus affect the wave ve-locity and the estimation of the AE location.
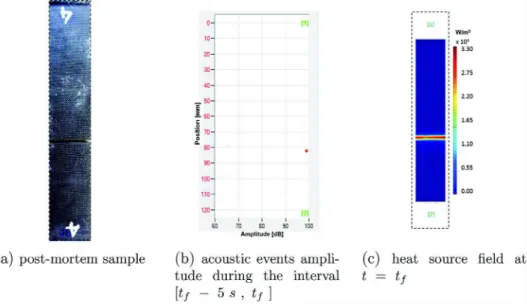
Before failure, specimens submitted to 0 tensile test exhibit macroscopic debonding in the fibre direction (see an illustration of post-mortem observation shown inFig. 7a). The graphical repre-sentation of acoustic events at the end of the test, namely during the 10 last seconds before failure time tf, confirms for such
spec-imen the occurrence of AE events with high energy all along the
Fig. 4. Analysis of the correlation between low acoustic energy and heat source (0 tensile test). Numbers in brackets correspond to sensors with sensor [1] (respectively [2]) positioned on the top (resp. bottom) of the specimen; vertical position of the figures fulfils the studied areas of the sample.
specimen, and here more localized in the upper part of the sample (Fig. 7b). Heat source field at breaking time (Fig. 7c) shows also high source intensity along debonding lines with highest value located in the upper part. These results at failure confirm again the good agreement between acoustic and dissipation observations for high amplitude and energy acoustic events.
To study the correlations in a an off-axis sollicitaion, we consider a high heat source (1:71 107W=m3) produced at t ¼ 42:216 s of
the 90!tensile test (Fig. 8a) in a last case. During the timespan t ¼ 42:216±0:5 s, the highest acoustic amplitude (55 dB)
corre-sponds to an interface failure and is found again with a good cor-respondence in time at t ¼ 42:220 s (error of 0.01%) (Fig. 8b). Heat source and acoustic event are also in the same zone of the sample (near sensor [1]) with an error of 21% (Fig. 8b). Similar observation can be done at breaking time (Fig. 9b and c). In addition to the changes in velocity, such a difference in location may be related to the much more brittle character, and therefore instability, of the failure in that case. Indeed, it is shown inFig. 9a that the final failure occurs transversally to the load axis, induced by the failure of the weakest point of the epoxy matrix.
6. Conclusions
In this study, combined analysis of carbon-epoxy composite subjected to axis and off-axis tensile tests is done by means of acoustic emission and infrared thermography measurements. On the one hand, acoustic emission technique is used for damage detection, both to identify and locate the damage events during the load. The use of Unsupervised Pattern Recognition algorithm allows to discriminate physical mechanisms associated to different signals: three damage mechanisms are found in speci-mens at 0 according to the load axis (matrix cracking, debond-ing and fibre breakdebond-ing) whereas only two are identified in the 90 case (matrix cracking and debonding). On the other hand, heat sources are obtained from the filtering of thermal fields and by using homogenization technique to account for the aniso-tropic character of the thermal conduction within these com-posite materials which is a clear original contribution. Compared to existing studies, this work thus proposes a deeper and, above all more physical, interpretation of the results of each technique. Consequently, this improves the quality of their correlations
Fig. 6. Analysis of the correlation between high acoustic energy and heat source (0 tensile test).
and of the understanding of different degradation processes involved.
Acoustic emissions and heat sources induced by disbonding and fibre breaking are found to be well correlated. Basically, these damage mechanisms produce acoustic emissions with high ampli-tude and high energy and heat sources with high intensity. Under these conditions, correlations can be highlighted in both senses. The accuracy of detection in the time is very optimal, while accuracy regarding the location is not so precise and could be attributed to velocity change during the test. On the contrary, damage corre-sponding to matrix cracking only leads to low intensity in acoustic and thermal events that not allows to find any matching point be-tween them. It seems thus that there is some correlation threshold below which the two damage manifestations cannot be related and beyond which they can be captured by both techniques. Accord-ingly, this study confirms the complementarity of AE and IT and further defines the specific sensibilities of each method regarding each mechanism. For the study of matrix cracking, the monitoring by acoustic emissions appears then as the most suitable technique,
while heat sources determined from infrared measurements may be favored for the study of fibre breakage and interface failure. In addition, this latter optical technique allows such investigation without any contact with the sample.
Further works need now to be conducted to identify more precisely the correlation threshold through a statistical analysis of several events. Also, it would be interesting to decompose the total heat source between the mechanical dissipation and the thermo-elastic coupling in order to analyze the correlation with heat sources coming only from damage phenomena. For the future mechanical experiments, it would be important to make inter-rupted mechanical tests at different load levels to confirm the damage mechanisms associated with each AE group. Finally, this combined measurement approach could be extended to the study of damage process of composites under dynamic load (fatigue). In that latter case, the question of data acquisition and storage will be a strong difficulty and will require different levels in the analysis, from the global response first to more local study afterward to focus on specific evolution steps of the fatigue damage.
Fig. 8. Analysis of the correlation between high heat source and acoustic amplitude (90tensile test).
References
[1] Kempf M, Skrabala O, Altst€adt V. Reprint of: acoustic emission analysis for characterisation of damage mechanisms in fibre reinforced thermosetting polyurethane and epoxy. Compos Part B 2014;65:117e23.
[2] Loutas T, Kostopoulos V. Health monitoring of carbon/carbon, woven rein-forced composites. Damage assessment by using advanced signal processing techniques. Part I: acoustic emission monitoring and damage mechanisms evolution. Compos Sci Technol 2009;69:265e72.
[3] Njuhovic E, Brau M, Wolff-Fabris F, Starzynski K, Altstadt V. Identification of failure mechanisms of metallised glass fibre reinforced composites under tensile loading using acoustic emission analysis. Compos Part B 2015;81: 1e13.
[4] Masmoudi S, Mahi AE, Turki S. Use of piezoelectric as acoustic emission sensor for in situ monitoring of composite structures. Compos Part B 2015;80: 307e20.
[5] Goidescu C, Welemane H, Garnier C, Fazzini M, Brault R, P eronnet E, et al. Damage investigation in CFRP composites using full-field measurement techniques: combination of digital image stereo-correlation, infrared ther-mography and X-ray tother-mography. Compos Part B 2013;48:95e105. [6] Montesano J, Bougherara H, Fawaz Z. Application of infrared thermography for
the characterization of damage in braided carbon fiber reinforced polymer matrix composites. Compos Part B 2014;60:137e43.
[7] Montesano J, Fawaz Z, Bougherara H. Non-destructive assessment of the fa-tigue strength and damage progression of satin woven fiber reinforced. Compos Part B 2015;71:82e90.
[8] Libonati F, vergani L. Damage assessment of composite materials by means of thermographic analysis. Compos Part B 2013;50:122e30.
[9] Benaarbia A, Chrysochoos A, Robert G. Kinetics of stored and dissipated en-ergies associated with cyclic loadings of dry polyamide 6.6 specimens. Polym Test 2014;34:155e67.
[10] Lisle T, Bouvet C, Pastor M-L, Margueres P, Corral RP. Damage analysis and fracture toughness evaluation in a thin woven composite laminate under static tension using infrared thermography. Compos Part A 2013;53:75e87. [11] Karger-Kocsis J, Fejes-Kozma Z-S. Failure mode and damage zone
develop-ment in a GMT-PP by acoustic emission and thermography. J Reinf Plast Compos 1994;13:768e92.
[12] Kordatos E, Dassios K, Aggelis D, Matikas T. Rapid evaluation of the fatigue limit in composites using infrared lock-in thermography and acoustic emis-sion. Mech Res Commun 2013;54:14e20.
[13] De Vasconcellos D, Touchard F, Chocinski-Arnault L. Tensionetension fatigue behaviour of woven hemp fibre reinforced epoxy composite: a multi-instrumented damage analysis. Int J Fatigue 2014;59:159e69.
[14] Naderi M, Kahirdeh A, Khonsari M. Dissipated thermal energy and damage evolution of glass/epoxy using infrared thermography and acoustic emission. Compos Part B 2012;43(3):1613e20.
[15] Kordatos E, Aggelis D, Matikas T. Monitoring mechanical damage in structural materials using complimentary NDE techniques based on thermography and acoustic emission. Compos Part B 2012;43(6):2676e86.
[16] Standard ISO 527e5. Plastics - determination of tensile properties - Part 5: test conditions for unidirectional fibre-reinforced plastic composites. 2009. [17] ENVIROCOUSTICS SA. Noesis© 5.6.50. Advanced acoustic emission data
anal-ysis pattern recognition & neural networks software for acoustic emission applications. 2011. Reference Manual.
[18] Davies D, Bouldin D. A cluster separation measure. IEEE Trans Pattern Anal Mach Intell 1979;1:224e7.
[19] Moevus M, Godin N, R'Mili M, Rouby D, Reynaud P, Fantozzi G, et al. Analysis of damage mechanisms and associated acoustic emission in two SiCf/[Si-B-C] composites exhibiting different tensile behaviours. Part II: unsupervised acoustic emission data clustering. Compos Sci Technol 2008;68:1258e65. [20] Kostopoulos V, Loutas T, Dassios K. Fracture behavior and damage
mecha-nisms identification of SiC/glass ceramic composites using AE monitoring. Compos Sci Technol 2007;67:1740e6.
[21] Momon S, Godin N, Reynaud P, R'Mili M, Fantozzi G. Unsupervised and su-pervised classification of AE data collected during fatigue test on CMC at high temperature. Compos Part A 2012;43:254e60.
[22] Dzenis Y, Qian J. Analysis of microdamage evolution histories in composites. Int J Solids Struct 2001;38:1831e54.
[23] Vales B, Munoz V, Welemane H, Pastor M-L, Trajin B, Perrin M, et al. Heat source estimation in anisotropic materials. Compos Struct 2015 [submitted to Composites Part A].
[24] Mori T, Tanaka K. Average stress in matrix and average elastic energy of materials with misfitting inclusions. Acta Metall 1973;21:571e4.