U
NIVERSITY OF
LIÈGE
F
ACULTY OFS
CIENCESDEPARTMENT OFASTROPHYSICS, GEOPHYSICS, ANDOCEANOGRAPHY
(AGO)
Development and exploitation of an
infrared coronagraphic test bench for
vortex phase mask performance
assessment
Author:
Aïssa JOLIVET
Supervisors Dr. Olivier ABSIL
Prof. Serge HABRAKEN
A thesis submitted in fulfillment of the requirements for the degree of Doctor of Philosophy in Space Sciences
in the
Department of Astrophysics, Geophysics, and Oceanography (AGO)
Members of the jury:
Prof. Denis GRODENT, University of Liège (President)
Dr. Olivier ABSIL, University of Liège (Advisor)
Prof. Serge HABRAKEN, University of Liège (Co-Advisor)
Prof. Mikael KARLSSON, Uppsala Universitet Prof. Lucas LABADIE, Universität zu Köln
Prof. Dimitri MAWET, California Institute of Technology Dr. Gilles ORBAN DEXIVRY, University of Liège
T
HESIS ABSTRACT
Coronagraphy is a high-contrast imaging technique aiming to reduce the blinding glare of a star in order to detect a potential companion in its close environment. Vor-tex phase mask coronagraphy is widely recognized as one of the most promising approaches.
This thesis is dedicated to the performance assessment of the vortex corona-graph. For this purpose, it was crucial to have our own dedicated facility at the Uni-versity of Liège. In the first part of this thesis we describe how was built the Vortex Optical Demonstrator for Coronagraphic Applications (VODCA) to optically char-acterize infrared phase masks, in particular vortex masks. The layout and salient features of VODCA are presented, as well as its operations, and its limitations in terms of optical quality. The bench is then used to assess the performance of L-(3575-4125 nm) and M-band (4600 to 5000 nm) annular groove phase masks (AGPM) manufactured by our team. We discuss the results obtained with other facilities and put them in perspective with the new measurements on VODCA. We demonstrate the highest rejection ratio ever measured for an AGPM at L-band: 3.2×10³ in a narrow band filter (3425-3525 nm) and 2.4×10³in a broad L band filter. We also
de-scribe the first results obtained at shorter wavelengths (H- and K-bands, from 1500 to 2400 nm). Vortex phase masks with higher topological charges VVC (Vector Vor-tex Coronagraph) are theoretically more resilient to aberrations and resolved stars, a key feature for next generation coronagraphs. We present here various designs for the SGVC4 (charge 4 Subwavelength Grating Vortex Coronagraph) and the perfor-mance of the first manufactured components. We finally investigate the influence of optical aberrations on the AGPM and SGVC4, and confirm the simulations results. The AGPM is sensitive to low order aberrations while the SGVC4 is significantly less affected by tip/tilt and defocus.
By providing measurements close to the intrinsic limit of science-grade AGPMs and accurately describing their behavior, VODCA proves to be a step forward in terms of the evaluation of vortex phase masks performance.
Keywords : Infrared test bench, high contrast imaging, subwavelength grating vortex coronagraph.
R
ÉSUMÉ
La coronographie est une technique d’imagerie « haut-contraste » dont le but est de réduire la lumière d’une étoile pour permettre la détection de potentiels com-pagnons dans son environnement proche. L’utilisation de masques de phase vortex est une des approches les plus prometteuses dans le développement de nouveaux coronographes.
Cette thèse est consacrée à l’évaluation des performances de ces coronographes. Pour cela, il s’est avéré indispensable d’avoir notre propre structure de test au sein de l’Université de Liège. Dans la première partie de ce document, nous décrivons le développement et la mise en place du Vortex Optical Demonstrator for Corona-graphic Applications (VODCA) pour la caractérisation de masques de phase dans l’infrarouge et en particulier les masques vortex. Le montage optique et les princi-pales caractéristiques de VODCA sont présentés ici ainsi que le détail de son opéra-tion et ses limites en termes de qualité optique. Le banc est ensuite utilisé pour éval-uer précisément les performances de nos « annular groove phase masks » (AGPM) en bande L (3575-4125 nm) et M (4600-5000 nm). Nous mettons ensuite en perspec-tive ces résultats avec ceux obtenus sur d’autres bancs optiques. Nous atteignons ainsi les plus haut taux de rejection jamais mesuré pour un AGPM en bande L : 3.2× 10³avec un filtre en bande étroite (3425-3525 nm) et 2.4×10³en bande large. Nous détaillons également les premiers résultats obtenus à de plus courtes longueurs d’onde (bandes H et K, de 1500 à 2400 nm). Les masques de phases vortex avec une charge topologique plus élevée sont théoriquement plus robustes aux aberrations et aux étoiles résolues par le télescope, un élément clé pour la prochaine génération de coronographes. Nous présentons ici différents designs pour un masque de phase vortex de charge 4 et les performances des premiers composants fabriqués. Finale-ment, nous nous intéressons à l’influence des aberrations optiques sur l’AGPM et les masques vortex de charge 4 et sommes en mesure de confirmer les simulations. L’AGPM est sensible aux aberrations de bas-ordre tandis que le masque vortex de charge 4 est lui considérablement moins affecté par le tip/tilt ainsi que le défocus.
En étant capable de délivrer des mesures proche de la limite intrinsèque de nos meilleurs AGPMs et de décrire avec précision leur comportement optique, VODCA se révèle être une importante amélioration en termes d’évaluation des performances de masques de phases vortex.
Mots-clés : Banc de test infrarouge, imagerie haut contraste, coronographe vor-tex.
C
ONTENTS
Abstract v
Résumé vii
Contents ix
List of Figures xiii
List of Tables xix
List of Abbreviations xxi
List of Symbols xxiii
I Introduction 1
1 Imaging exoplanets 3
1.1 The search for exoplanets . . . 3
1.2 Detection methods . . . 5
1.2.1 Indirect methods . . . 5
1.2.2 Direct methods . . . 7
1.3 Coronagraphy . . . 10
1.3.1 Focal plane coronagraphy . . . 10
1.3.2 Pupil plane coronagraphy . . . 13
1.3.3 Hybrid solutions . . . 13
2 Theory and manufacturing of charge 2 vector vortex coronagraphs 15 2.1 Vortex phase mask . . . 15
2.1.1 Theory . . . 15
2.1.2 The subwavelength grating vortex coronagraph . . . 16
2.2 AGPM design and manufacturing . . . 17
2.2.1 Design . . . 17
2.2.2 Manufacturing . . . 19
2.2.3 Anti-reflective gratings . . . 21
II Development of the VODCA bench 23
3 Context and heritage 25
3.2 Existing facilities for AGPM tests . . . 26
3.2.1 IRCT . . . 26
3.2.2 YACADIRE . . . 29
3.3 Need for a Liège-based dedicated test bench . . . 30
4 Design and hardware 33 4.1 Bench layout . . . 33
4.2 Optics . . . 34
4.3 Sources . . . 34
4.3.1 Red alignment laser . . . 34
4.3.2 Supercontinuum laser . . . 35
4.3.3 1.55 µm laser and M band quantum cascade laser . . . 36
4.4 Camera . . . 36
4.4.1 Linearity . . . 37
4.4.2 Operating range . . . 37
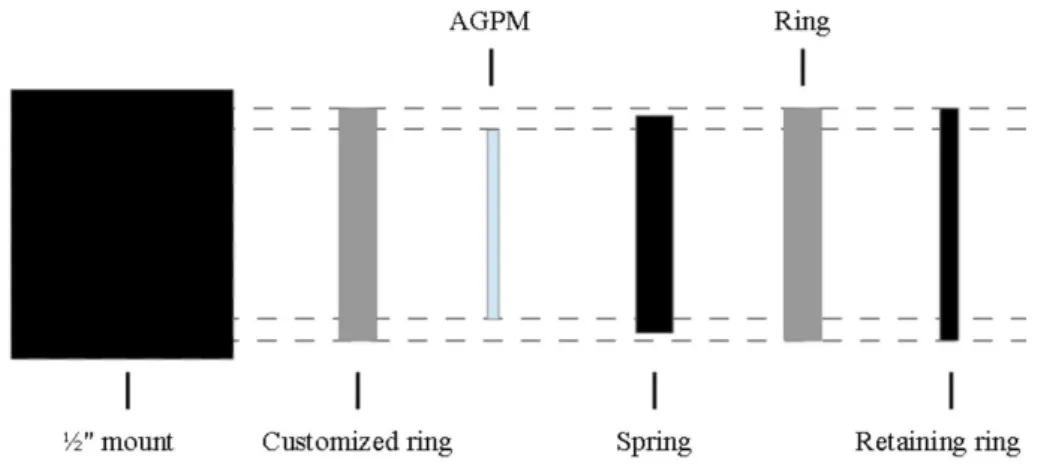
4.5 AGPM mount . . . 38
4.6 Beam-shaping part of VODCA . . . 39
4.7 Deformable mirror . . . 41
4.7.1 Stability over time . . . 42
4.8 VODCA alignment . . . 43
5 Software 45 5.1 LabVIEW interface . . . 45
5.1.1 Developing a complete interface . . . 45
5.1.2 Centering routine . . . 45
5.2 Python interface for aberrations correction . . . 46
5.2.1 Description . . . 46
5.2.2 Operation . . . 49
5.2.3 Expected achievable flatness of the wavefront . . . 49
III Using the VODCA bench 51 6 Performance measurements for L-band AGPMs 53 6.1 Procedure . . . 53
6.1.1 Number of frames averaged . . . 53
6.2 Measured performance . . . 55
6.3 Transmission . . . 55
6.4 Comparison with previous results . . . 55
6.4.1 Re-etching . . . 56
7 VODCA optical quality and limitations 59 7.1 Influence of wavefront correction . . . 59
7.2 Effect of time-limited wavefront control on rejection ratio . . . 62
7.3 Optical quality . . . 63
8 Influence of aberrations 67
8.1 Introduction and test protocol . . . 67
8.2 Results . . . 69 8.2.1 Tip/tilt . . . 69 8.2.2 Focus . . . 70 8.2.3 Astigmatism . . . 71 8.2.4 Coma . . . 72 8.2.5 Conclusion . . . 74
8.3 Influence of the incoming beam angle . . . 75
9 Performance measurements in other bands: H, K and M 77 9.1 M-band AGPMs . . . 77
9.2 H and K bands AGPMs . . . 78
9.3 Conclusion . . . 79
10 Beyond the AGPM: Charge 4 vortex phase masks 81 10.1 Introduction to higher topological charges vortex coronagraph . . . 81
10.1.1 From theory to manufacturing . . . 81
10.2 Performance in terms of rejection ratio . . . 83
10.3 Influence of aberrations . . . 85
10.4 Transmission map . . . 85
10.4.1 LabVIEW routine . . . 85
10.4.2 Results . . . 86
10.5 Conclusion . . . 87
IV Conclusion and perspectives 89
V Appendix 95
Publications with major contribution 97
Publications with minor contribution 99
L
IST OF
F
IGURES
1.1 Confirmed exoplanets detection and the planet type distribution. Cred-its: NASA . . . 3 1.2 This diagram compares our Solar System with some of the planetary
systems imaged so far, with the exoplanet distance relative to its host star expressed in astronomical units. The Solar System is illustrated at the bottom, showing the Sun along with the four outer planets, Jupiter, Saturn, Uranus and Neptune. Credits: ESO Press Release. . . . 4 1.3 Spatial representation of the habitable zone, main area of interest for
life detection. The red lines define an optimistic definition of the hab-itable zone while the blue lines are more conservative.. . . 5 1.4 Distribution of the main exoplanet detection methods. Credits: NASA. 6 1.5 The transit method. Credits: ESO Press Release. . . 6 1.6 The radial velocity method. Credits: ESO Press Release. . . 7 1.7 Representation of an adaptive optics layout. Credits: mavis-ao.org. . . 9 1.8 Illustration of the ADI image combination technique. Ai corresponds
to the series of raw frames taken in pupil-stabilized observing mode. The halo sketched in gray is the quasi-static speckle, the red-highlighted point is the rotating planet signal. Credits: Christian Thalmann, Max Planck Institute for Astronomy. . . 10 1.9 The Lyot coronagraph uses an opaque mask in the image plane, whereas
the nulling coronagraph (now referred to as the ’Roddier coronagraph’) uses a phase mask. Light distribution in the pupil is very different for the two coronagraphs. For the Lyot coronagraph the light is con-centrated inside the pupil near the edge. For the phase mask it is moved outside the pupil. This figure shows the light distribution in four different planes for both coronagraphs. Plane P1 is the entrance pupil plane; plane P2 is the focal plane, where the occulting (or phase) mask is; plane P3 is the second pupil plane, where the "Lyot" stop is; and plane P4 is the second focal plane. Credits: Guyon et al. (1999). . . 11 1.10 Left: Design of the four quadrant phase mask (FQPM). Middle: Two
quadrants on one diagonal make the light undergo a π phase shift, whereas the two other quadrants let it pass without shifting the phase. Right: Resulting PSF with a logarithmic intensity scale normalized to the peak flux. In the perfect case (circular aperture, perfect phase shift), the stellar light is perfectly cancelled. From Rouan et al. (2007). . 12
fect is obtained by the combination of a pupil plane apodizer and a focal plane mask. Performance is augmented in the Apodized Pupil Lyot Coronagraph (APLC) by introducing a Lyot mask in the out-put pupil plane (center left). Further performance improvement is achieved by replacing the opaque focal plane occulting mask with a partially transmissive phase-shifting mask (bottom left). The right part of this figure shows the equivalent coronagraph designs when apodization is performed by lossless PIAA optics instead of a clas-sical apodizer. A graphical representation of complex amplitude in a few relevant planes is shown for each coronagraph: (1) telescope entrance pupil, (2) pupil after apodization, (3) focal plane before in-troduction of the focal plane mask, (4) focal plane after the focal plane mask, and (5) exit pupil plane before truncation by the Lyot mask. The PIAA Complex Mask Lyot Coronagraph (PIAACMC), shown in the bottom right of this figure, offers the highest performance of all configurations. Credits: Guyon et al. (2010). . . 14
2.1 The VVC azimuthal phase ramp obtained with a rotationally sym-metric half-wave plate (HWP). The rotating optical axis orientation is represented with dashed lines perpendicular to the circumference. The net effect of a HWP on a linear impinging polarization is to rotate it by -2× αwhere α is the angle between the incoming polarization
direction and the fast optical axis. An incoming horizontal polariza-tion (blue arrow) is transformed by the vector vortex so that it spins around its center twice as fast as the azimuthal coordinate θ (red ar-rows). Right: For circular polarization, the starting angle 0 is rotated, therefore the output field rotation is strictly equivalent to a phase de-lay. From Mawet et al. (2011). . . 16
2.2 Left: Schematic diagram of a SG. The incident light beam vector is perpendicular to the grating lines of depth h and a periodicityΛ. The filling factor F is such that FΛ corresponds to the width of the grating walls. Right: AGPM coronagraph scheme. From Mawet et al. (2005). . 17
2.3 Best rejection ratios achievable for AGPMs with optimal parameters in different spectral bands, the grating depth is varied between 5.0 and 6.0 µm from blue to red, with the lines separated by steps of 0.02
µm. The sidewall angle is set to 2.45◦. From Vargas Catalán et al. (2016). 18
2.4 RCWA multi-parametric simulation: mean null depth (logarithmic scale) over the whole L band (3.5-4.1 µm) with α ranging from 2.7° to 3.2°. The period is set toΛ = 1.42 µm (SG limit). From Delacroix et al. (2013). . . 19
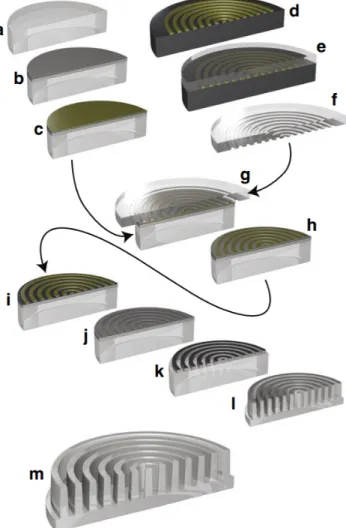
2.5 Process steps in brief. Diamond substrates are cleaned in solvents and acids (a). Three masking layers are sputtered onto the diamond sub-strate (b): a thick Al layer, followed by a Si layer and finally a thinner Al layer. A layer of nanoimprint polymer is then spin coated on top of the stack (c). The patterns are written to silicon wafers either by laser- or by e-beam lithography (d). A thin layer of polydimethyl-siloxane (PDMS) is molded on the patterned wafer (e) and peeled off (f). The structured PDMS is used as stamp in nanoimprint lithogra-phy to transfer the pattern to the polymer film at the top of the mask stack on the diamond substrate (g, h). Plasma etching is employed to texture the diamond surface in the following way: the thin poly-mer pattern is used as mask to etch the pattern in the top Al layer in a Cl2/BCl3 plasma (i). The Si layer is then etched using the top Al layer as mask in an Ar/SF6 plasma (j). The Si layer serves as mask for etching the thick Al layer in cycled Cl2/BCl3 and O2 plasmas (k). With the Al mask finished, the diamond is etched in an Ar/O2 plasma with strong bias (l). Finally, remaining mask material is removed with strong acids (m). From Forsberg and Karlsson (2013). . . 20 2.6 Evolution of the manufacturing of diamond AGPMs. Top: N-band
AGPMs, with periods ≈ 4.6 µm, manufactured in November 2009, October 2010, and February 2012 (from left to right). Bottom: cracked spares of L-band AGPMs, with periods ≈ 1.4 µm, manufactured in March 2011 and September 2012 (from left to right). From Delacroix (2013).. . . 21 2.7 SEM picture of the anti-reflective grating (ARG) etched on the
back-side of the AGPM. From Delacroix (2013). . . 22 3.1 Pictures of IRCT. Top: layout of the coronagraphic bench. Bottom:
Difference between the focal plane and the pupil plane imaging setup 27 3.2 Influence of the defocus on the rejection ratio. The flux is integrated
over the FWHM (red curve) and up to the second annulus of the PSF (blue curve) . . . 28 3.3 Tip influence on the PSF shape. Top: same scale – Bottom: adjusted
scale. . . 28 3.4 Rejection ratio measured on YACADIRE for AGPM-L15. . . 29 4.1 VODCA current configuration including the deformable mirror. . . 34 4.2 Supercontinuum spectrum delivered at full power (from Le Verre
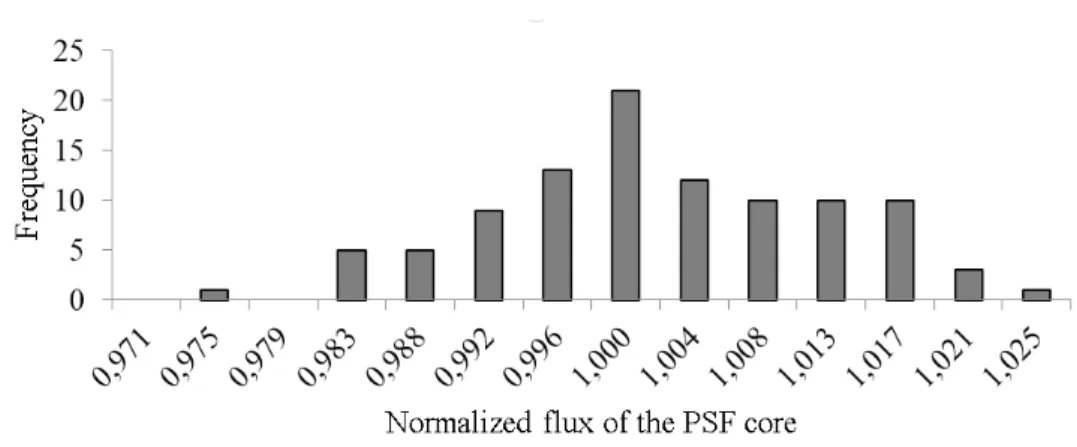
Flu-oré). . . 35 4.3 Histogram of the PSF core total flux considering 100 frames. . . 36 4.4 Averaged pixel value measuring only the background emission for
integration time varying between 0 and 5.8 ms. . . 38 4.5 Error between averaged pixel value and the fit. . . 38 4.6 Picture of the AGPM mount . . . 39 4.7 Representation of the AGPM mount components inside the lens tube.. 40 4.8 Left: Picture of an ALPAO DM. Right: DM surface schematic. By
applying a current in the coils (yellow), the magnets (grey, hold by a spring (blue)) are moved up and down to deform the membrane (red). Credits: ALPAO. . . 41 4.9 Rejection ratio evolution of an AGPM as a function of time with the
5.2 Rejection ratio after successive runs of the centering routine. The square is for the rejection ratio measured just after the aberrations minimization on the DM. The red cross is a failed attempt of the rou-tine to successfully find the optimal position. . . 47 5.3 Example of indicators (hidden) of the centering routine interface
run-ning. They display the rejection ratio approximation for every step taken and the quadratic fit (lower graph). . . 47 5.4 Flux leakage of the vortex coronagraph as a function of Zernike
aber-rations. (Left) Simulations for several Zernike (tilt, focus, astigma-tism, coma) showing similar trend close to zero aberrations. (Right) Leakage measurements for tip-tilt in L-band on the VODCA bench with an AGPM (Orban de Xivry et al., 2017). . . 48 6.1 Effect of frames averaging on on- (top) and off- (bottom) axis PSF. . . . 54 7.1 Left: Radial profiles for the coronagraphic (blue) and non-coronagraphic
(red) PSFs, using the same undersized Lyot stop. The dashed vertical line represents the area over which the flux is integrated to calculate the rejection ratio. The dashed red lines correspond to the theoreti-cal Airy pattern. Right: Illustration of the off-axis (top) and on-axis (bottom) PSFs. . . 60 7.2 Same as Fig 7.1 when the DM is introduced in VODCA and optimized
to improve the rejection ratio. . . 60 7.3 Simulated off-axis (black) and coronagraphic (orange) PSFs using the
parameters of Table 7.1. . . 61 7.4 Rejection ratio reached when the aberrations minimization routine
corrects the first 0 to 70 modes. The measurements have been per-formed for the 4 AGPMs available at that time. . . 62 7.5 Theoretical rejection ratio computed as a function of the amplitude of
five low order aberrations (Z2: tip, Z4: focus, Z5: astigmatism, Z6: coma, Z7: trefoil). . . 64 8.1 Shift measured of the PSF when tilt is applied from the DM. . . 68 8.2 Left: Deformable mirror shape. Right : Tilt simulation. . . 69 8.3 Influence of tip and tilt on the rejection ratio. Cross marks:
experi-mental results, line: simulation. . . 70 8.4 Left: Deformable mirror shape. Right : Focus simulation. . . 71 8.5 Influence of focus on the rejection ratio. Cross marks: experimental
results, line: simulation. . . 71 8.6 Left: Deformable mirror shape. Right : Astigmatism simulation. . . 72 8.7 Influence of astigmatism on the rejection ratio. Cross marks:
experi-mental results, line: simulation. . . 72 8.8 Left: Deformable mirror shape. Right : Coma simulation. . . 73 8.9 Influence of coma on the rejection ratio. Cross marks: experimental
results, line: simulation. . . 73 8.10 Influence of low-order aberrations on the null depth. . . 74 8.11 Influence of the incidence beam angle on the AGPM null depth. . . 75 9.1 Off axis PSF after aberrations minimization. Left : K band. Right : L
10.1 The VVC azimuthal phase ramp for charge 2, 4 and 6 VVC. . . 82 10.2 Evolution of the inner working angle (IWA) for higher topological
charge VVCs. . . 82 10.3 Working principle of a vector vortex coronagraph (VVC) of
topolog-ical charge l=2 (top) and l=4 (bottom). Left: Illustration of a rotating half-wave plate (HWP). The optical axis orientation ω is represented with dashed lines, and it rotates about the center as ω=θl/2, where
θ is the azimuthal coordinate. The HWP effect is to rotate the
in-put polarization (central arrow) by -2α where α is the angle between the incoming polarization direction and the optical axis orientation ω. Middle: The VVC azimuthal phase ramp obtained equals 2πl. Right: Binary grating geometry with constant line width. Only a charge-2 vector vortex coronagraph possesses the required circular symmetry for use with subwavelength gratings (SGVC2 or AGPM), which per-mits achromatization. For any other charge l 6=2, the grating period is locally larger than the subwavelength limit. From Delacroix et al. (2014).. . . 83 10.4 Optimized design of the charge-4 VVC using straight lines, curved
lines, and an hybrid solution. . . 84 10.5 Grating designs for the 8 segments (left) and 32 segments masks (right)
showing the first 10 periods. Only these two patterns have been suc-cessfully etched. From Catalán et al. (2018). . . 84 10.6 Influence of the integration zone on the measured rejection ratio. The
rejection ratio is computed by integrating the flux from the center (0λ/D) to the dashed line (at 0.5λ/D for the figures on the left, 2.23λ/D on the right). Top: Rejection ratio evaluated on the core of the psf. Left: low astigmatism. Right: strong astigmatism. Bottom: Rejection ratio evaluated until the 2nd annulus. Left: low astigmatism. Right: strong astigmatism. . . 86 10.7 Influence of low order aberrations influence on the null depth of a
SGVC4. . . 87 10.8 Influence of low order aberrations influence on the null depth of a
SGVC2. . . 87 10.9 Transmission map of SGVC4. The null depth is computed for a 100×100
pixels box. The origin of both axes is defined by the center of the grat-ing pattern (lowest transmission point). . . 88
L
IST OF
T
ABLES
2.1 Optimal grating parameters for various spectral windows (20% band-width) using RCWA simulations. From Delacroix (2013). . . 18 3.1 Rejection ratios measured on IRCT with the He-Ne and the L-band
source (AGPM and ARG refer to the mask side facing the beam). . . . 26 3.2 Best rejection ratio measured on YACADIRE. . . 30 4.1 Wavelengths covered by the different filters available on VODCA. . . . 40 4.2 Neutral densities transmission measured on VODCA. . . 41 4.3 Rejection ratio measured for the same DM shape (shape set to 0 after
each measurement).. . . 43 6.1 Best AGPM rejection ratio measured on VODCA with L-band filters
and in the M-band (monochromatic source). The accuracy of the cen-tering routine (±1-σ, Section 3.3) defines the errors on the rejection. . . 55 6.2 AGPM transmission in the L-BBF filter and at 4.6 µm. Error bars are
included only for AGPMs that have been measured several times. AGPM-L13 has not been evaluated in the L band due to its limited availability. . . 56 6.3 Comparison between the best results with the L-BBF filter on VODCA
and YACADIRE. AGPM L4 and L14 have not been tested without DM due to their limited availability. . . 56 6.4 Rejection ratios in the broadband L filter for the optimized AGPMs
(Vargas Catalán et al., 2016). . . 57 7.1 Simulation parameters . . . 61 7.2 Aberrations level limiting the rejection ratio (RR) to 103and 2×10³. . . 64 9.1 M band tuning. . . 78 10.1 Rejection ratio of the three SGVC4 manufactured. . . 84
L
IST OF
A
BBREVIATIONS
ADI Angular Differential Imaging
AGPM Annular Groove Phase Mask
ALPC Apodized Lyot Pupil Coronagraph
AO Adaptive Optics
APCMLC Apodized Pupil Complex Mask Lyot Coronagraph
APP Apodized Phase Plate
ARG Anti-Reflective Grating
BBF Broad Band Filter
CPA Conventional Pupil Apodization
DM Deformable Mirror
ERIS Enhanced Resolution Imager and Spectrograph
ESO European Southern Observatory
FQPM Four Quadrant Phase Mask
FWHM Full width at Half Maximum
HWP Half-Wave Plate
IRCT InfraRed Coronagraphic Testbed
IWA Inner Working Angle
JPL Jet Propulsion Laboratory
LCP Liquid Cristal Polymer
MIR Mid-InfraRed
NASA National Aeronautics and Space Administration
NBF Narrow Band Filter
NCPA Non Common Path Aberrations
ND Null Depth
NIR Near-InfraRed
OAP Off-Axis Parabola
PCP Photonic Cristal Polymer
PCA Principal Component Analysis
PDMS PolyDiMethylSiloxane
PIAAC Phase-Induced Amplitude Apodization Coronagraph
PIAACMC Phase Induced Amplitude Apodization Complex Mask Coronagraph
PIAALC Phase-Induced Amplitude Apodization Lyot Coronagraph
PSF Point Spread Function
QACITS Quadrant Analysis of Coronagraphic Images for Tip-Tilt Sensing
QCL Quantum Cascade Laser
RCWA Rigorous Coupled-Waved Analysis
RMS Root Mean Square
RR Rejection Ratio
SC Super-Continuum
SG Subwavelength Grating
SGVC Subwavelength Grating Vortex Coronagraph
SGVC2 Charge 2 Subwavelength Grating Vortex Coronagraph
SGVC4 Charge 4 Subwavelength Grating Vortex Coronagraph
SNR Signal to Noise Ratio
Speculoos Search for habitable Planets EClipsing ULtra-cOOl Stars
Trappist TRAnsiting Planets and PlanetesImals Small Telescope
VIP Vortex Image Processing
VLT Very Large Telescope
VODCA Vortex Optical Demonstrator for Coronagraphic Applications
VVC Vector Vortex Coronagraph
WFS WaveFront Sensor
L
IST OF
S
YMBOLS
Symbol Description Unit
λ Wavelength nm h Grating’s depth µm Λ Grating’s period µm F Filling factor α Sidewall angle ◦
Notations
Atmospheric windows H band from 1.44 to 1.78 µm K band from 1.95 to 2.35 µm L band from 3.5 to 4.1 µm M band from 4.6 to 5 µm N band from 11 to 13.2 µm xxiiiP
ART
I
Introduction
1
I
MAGING EXOPLANETS
1.1
The search for exoplanets
By definition, an exoplanet is a planet beyond our solar system. Their existence was hypothesized by the scientific community a long time ago but was only verified recently. The first confirmed detection occurred in 1992 when a planetary system was discovered around a pulsar (Wolszczan and Frail,1992). A few years later, the first exoplanet around a main-sequence star was detected (Mayor and Queloz,1995).
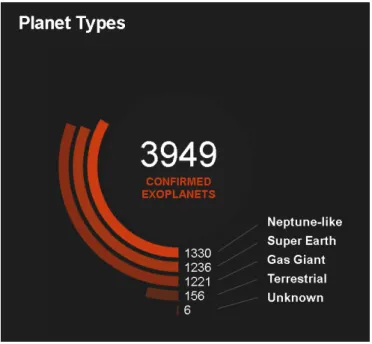
Figure 1.1: Confirmed exoplanets detection and the planet type distribution. Credits: NASA
Until the 90’s, only a reduced sample limited to the 8 planets of the Solar system was available to create and fine-tune models on the formation of planetary systems. Today, more than 3900 detections have been confirmed (Figure1.2). Recent studies reached the conclusion that planetary systems orbiting a star is the common rule
Figure 1.2: This diagram compares our Solar System with some of the planetary systems imaged so far, with the exoplanet distance relative to its host star expressed in astronomical units. The Solar System is illustrated at the bottom, showing the Sun along with the four outer planets, Jupiter, Saturn, Uranus and Neptune. Credits: ESO Press Release.
with an Earth-like planet frequency estimated around 20% (Petigura et al., 2013). Most of the exoplanets discovered belong to the Neptune-like and Jupiter-like cat-egories although Earth-like planets could be the most abundant. These detections have tremendously improved our understanding of planetary systems (Figure1.2) and added new classes of planets such as hot-Jupiters (giant gaseous planets with small orbits) or super-Earths, more massive than the Earth but smaller than Neptune (Valencia et al.,2007).
Exoplanet observation provides extremely valuable information about the pro-cess of planet formation and aim to answer one of the greatest questions of mankind: does life exist elsewhere in the Universe ?
The search for life has been shaped by the conditions which allowed its emer-gence on Earth, mainly the presence of liquid water. This temperature condition is related to the radiant energy received by an exoplanet from its host star and as a con-sequence the distance between them. This range of distance allowing liquid water is called the habitable zone (see Figure1.3). Even if it has been challenged as the only criterion for life emergence, the presence of liquid water outside the habitable zone has been accepted (Jupiter and Saturn’s moons for example,Sohl et al. (2010) and Hussmann et al.(2010)). Nevertheless, observations still focus on exoplanets in the habitable zone to detect life (Kopparapu et al.,2013). The closest exoplanet (Proxima Centauri b) being at more than 4 light years from Earth, a space mission to other solar systems is not a viable solution in the close future. However, it is possible to detect the presence of life on an exoplanet from ground-based (or space-borne) ob-servations. An exoplanet hosting life will see its atmosphere composition altered in
1.2. Detection methods 5
Figure 1.3: Spatial representation of the habitable zone, main area of interest for life detection. The red lines define an optimistic definition of the habitable zone while the blue lines are more conservative.
a way that is not attainable without life. The characteristic markers are called bio-signatures: they can be detected by a spectral analysis of the exoplanet atmosphere (Schwieterman et al.,2018).
Remarkable technological and technical progress in the recent years and the new class of extremely large telescopes under construction promise even more discover-ies in the future and game-changing breakthroughs.
1.2
Detection methods
Different methods of detection can be used in the hunt for exoplanets and are di-vided in two main categories: direct and indirect methods. Technological limits and intrinsic preferential targets inherent to each method may create a bias in the pool of discoveries leading to an over representation of Neptune-like and gas giant planets (Kipping and Sandford,2016).
1.2.1 Indirect methods
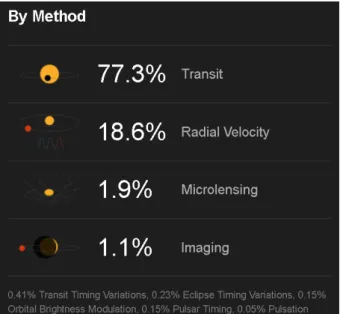
Indirect methods constitute a class of exoplanet detection techniques focusing on observing the star to infer the presence of companions. They were the first ones to be developed and represent most of the confirmed detections (>95%, Figure1.4). The main indirect methods, radial velocity and transit, are briefly described below.
Transit
More than 77% of the exoplanet confirmed detections have been made through tran-sit observations (Figure1.5). A transit occurs when an exoplanet passes between the star it orbits and the observer. The brightness of the star decreases as the exoplanet blocks part of the starlight. By repeatedly measuring the small flux attenuation, the orbital parameters and radius of the exoplanet can be deduced. Since starlight goes through the planet’s atmosphere, in some cases it has been possible to identify its
Figure 1.4: Distribution of the main exoplanet detection methods. Credits: NASA.
chemical composition (Deming and Seager(2017),Winn (2010), Sing et al.(2009)). "Hot Jupiters" (massive planets close to the host stars) are the most likely to be ob-served; their big size creates deeper transits. Red dwarf stars are the preferred can-didates for the observations of rocky planets since their small radius increases the depth of the transit. Some of the most successful projects (TRAPPIST, SPECULOOS, The SPECULOOS and TRAPPIST teams et al.(2018)) have been focused on this type of stars. Obviously, only a small portion of all exoplanets can be observed by this method since it requires a specific orientation of the star-planet system to produce transits visible from Earth. Star brightness fluctuations and insufficient photometry accuracy (especially in the case of small exoplanets and bright stars) can also prevent effective transit detections.
1.2. Detection methods 7
Radial Velocity
Radial velocity (Figure1.6) was until the 2010s the main technique for exoplanet detection. It accounts now for 18.6% of the discoveries. An orbiting exoplanet cre-ates a gravitational pull on the star. As a result, the star will move on a small orbit around the center of gravity of the system and this movement can be quantified by observing the star’s spectrum. The Doppler effect predicts a blue- or red-shift of its spectrum when the star moves toward or away from the observer. An estimation on the exoplanet (or companion) mass can also be determined from the spectral shift. The major limitation is that the spectrum shift can only be measured on the star-observer axis. If the orbital plane of the exoplanet is not aligned along this axis, the radial velocity can not capture the complete motion of the star. Only a minimal mass of the planet can be calculated without further observations. This method favors the detection of "hot-Jupiters". Their big mass creates the largest change in radial veloc-ity and the small orbit allows more observations (increased Signal to Noise Ratio). Complex planetary systems (several planets with different masses and various or-bit radii) and stellar activity can make the observations less conclusive (Vanderburg et al.,2016).
Figure 1.6: The radial velocity method. Credits: ESO Press Release.
1.2.2 Direct methods
As opposed to indirect methods, direct observations collect the light from the exo-planet itself. Direct imaging is a great tool not only for the detection but also for the spectral characterization of exoplanets. Having access to a planet’s flux allows (de-pending on the accuracy) to identify its structure, the composition of its atmosphere and possibly to identify markers of life. It also gives access to an important pool of planetary systems that could not be observed through the previously described indirect methods.
Unfortunately, these methods face two major issues. (i) The angular separation between a distant star and an orbiting exoplanet is really small (few milliarcsec to a few arcsec). (ii) An exoplanet is much fainter than its host star, disregarding whether
its thermal or reflected light is considered. For instance, an Earth-like planet presents a contrast of 10−10 with respect to a Sun-like star in the visible (reflected light) or around 10−7 in the mid-infrared (thermal emission). The angular resolution of an instrument, i.e. the smallest angle between two objects that the instrument can sepa-rate, is a crucial feature of a telescope. A better resolution allows to detect exoplanets closer to their host star. A star and an exoplanet can be considered as point sources in most cases (future 30+m class telescopes will challenge this assertion). In the ab-scence of aberrations, their direct images are limited by diffraction and lead to the concept of the point spread function (PSF). In the case of an unobstructed circular aperture, this function is described by an Airy pattern. According to the definition, two equally bright point sources are resolved when the maximum of the first PSF is located farther than the first minimum of the second one. The Airy pattern first minimum is observed at an 1.22 λ/D angle, where λ is the wavelength and D the diameter of the circular aperture of the telescope.
Under perfect conditions, the resolving power of a telescope is positively affected by two factors: (i) observing at shorter wavelengths and (ii) increasing the aperture diameter, which also contributes to a better detection of faint objects since more pho-tons are collected. In practice, the angular resolution of ground-based telescopes is strongly limited by atmospheric turbulence and also by the optics quality. The atmo-sphere, constantly moving with layers of air at different temperatures and densities, can not be considered as a uniform medium but consists of multiple refractive in-dexes evolving at high frequency due to the wind. The light from the star can be considered as a flat wavefront before going through the atmosphere. After that, the PSF which should be an Airy pattern becomes blurry. Bright, compact and moving spots appear around the PSF (speckles). As a consequence, potential companions buried in either the star widened PSF or in the speckles are less likely to be detected. The Strehl ratio is the main criterion to assess the quality of a telescope and its instrument. It is defined as the ratio between a given PSF and the theoretical Airy pattern. A telescope strongly limited by atmospheric turbulence can only achieve a very low Strehl ratio. Typically, the best sites for observations have a coherence length (r0) between 15 and 30 cm. r0is the greatest diameter of a circular aperture
with less than 1 rad rms phase aberrations on its collected light wavefront. The "see-ing" is estimated from the full width at half maximum (FWHM) of a long exposure PSF for a telescope with diameter >r0. A telescope with a diameter larger than r0
is not diffraction limited but "seeing-limited". Any aperture larger than r0will add
no gain to the resolving power (except if it is being used with adaptive optics).
Adaptive Optics
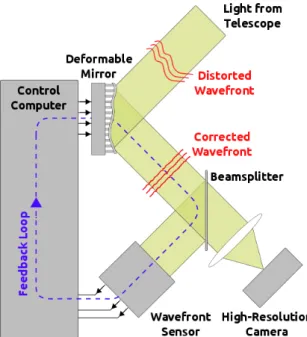
Adaptive Optics (AO, Figure1.7) is a technical solution used to compensate atmo-spheric turbulence and aberrations introduced by the optics when operating a tele-scope at its full potential (first applied for astronomy byRousset et al.(1990)). AO is a two step process, the wavefront distortion is first measured with a wavefront sensor (WFS: Shack-Hartmann, pyramid, etc..). The information is then processed by a software and sent to a deformable mirror (DM) installed in the optical path. A DM is a mirror with actuators below its surface that can be pulled or pushed to modify its shape as necessary. The DM tunes its shape to compensate the wavefront aberrations. The WFS measures the wavefront corrected and in a close loop adapts the information sent to the DM for a live correction.
1.2. Detection methods 9
Figure 1.7: Representation of an adaptive optics layout. Credits: mavis-ao.org.
A larger number of DM actuators (and density) guarantees a finer level of aber-ration correction. State of the art DM for large ground-based telescopes have thou-sands of actuators. Concerning the frequency, the wavefront correction has to op-erate at the same or higher frequency than the typical atmospheric turbulence (≈ 1 kHz). Lower frequency AO systems can be used to correct the quasi-static aber-rations induced by misalignments and the optics. Nowadays, the best AO systems can use a couple of DMs and WFSs correcting first low order aberrations with a large amplitude and then higher orders with smaller amplitudes (which require finer cor-rection). State of the art adaptive optics systems on 10m-class telescopes provide PSFs with Strehl ratios higher than 90% in the near-infrared (Dekany et al.(2013), Macintosh et al.(2014),Milli et al.(2017),Sahoo et al.(2018)).
Observing techniques
Angular Differential Imaging (ADI,Marois et al.(2006), Figure1.8) can be used on an alt-azimuth telescope where the pupil rotates with respect to the field. The Earth ro-tation around its axis makes the field rotate for an observer on the ground. This tech-nique takes advantage of the fact that quasi-static speckles (due to the telescope) are fixed during the observation. In this case, a reference image averaging the speckle can be subtracted from each image. The images are then "derotated" to maximize the flux of a potential companion. It allows to reduce the speckles noise (and partially the starlight) while in the meantime increasing the exoplanet signal.
Spectral Differential Imaging (SDI,Smith(1987),Racine et al.(1999),Lafreniere et al.(2007)) pursues the same goal but uses the difference between an exoplanet and the speckles when the wavelength of observation varies. Speckles are caused by the starlight diffraction and their position changes with respect to the wavelength, contrary to the exoplanet that has a fixed position. Taking into account this behavior, it is possible to strongly attenuate the speckle noise.
Various post-processing techniques consisting of data reduction and combining images aim to reduce the speckle noise and make potential companions more vis-ible. In the Vortex project, we developed our own post-processing package (VIP, vortex image processing, Gomez Gonzalez et al.(2017)) using ADI and principal component analysis (PCA) algorithms.
Figure 1.8: Illustration of the ADI image combination technique. Ai corresponds to
the series of raw frames taken in pupil-stabilized observing mode. The halo sketched in gray is the quasi-static speckle, the red-highlighted point is the rotating planet signal. Credits: Christian Thalmann, Max Planck Institute for Astronomy.
1.3
Coronagraphy
Coronagraphy is a direct imaging technique aiming to mitigate the contrast issue between an exoplanet and its host star. In 1939, Bernard Lyot designed an optical instrument to observe the Sun’s corona without being blinded by its photosphere (Lyot,1939). The term "coronagraphy" describes systems relying on the principle of blocking the light from the star (on-axis source) to distinguish its surrounding (off-axis sources).
Applied to exoplanet detection, coronagraphy is a high-contrast imaging tech-nique aiming to reduce the blinding glare of a star to enable the detection of very faint objects in its vicinity (Figure 1.9). The emergence of the exoplanet detection field led to remarkable innovations in the coronagraphic techniques. They can be divided in two distinct categories : (i) focal plane and (ii) pupil plane coronagraphs depending on where they use a Fourier spatial filter to produce the coronagraphic effect.
1.3.1 Focal plane coronagraphy
Focal plane coronagraphy relies on an amplitude or phase mask in the focal plane to achieve the starlight cancellation. The coronagraph mask is placed at the focal point and produces the coronagraphic effect that cancels the beam from the on-axis
1.3. Coronagraphy 11
Figure 1.9: The Lyot coronagraph uses an opaque mask in the image plane, whereas the nulling coronagraph (now referred to as the ’Roddier coronagraph’) uses a phase mask. Light distribution in the pupil is very different for the two coronagraphs. For the Lyot coronagraph the light is concentrated inside the pupil near the edge. For the phase mask it is moved outside the pupil. This figure shows the light distribution in four different planes for both coronagraphs. Plane P1 is the entrance pupil plane; plane P2 is the focal plane, where the occulting (or phase) mask is; plane P3 is the second pupil plane, where the "Lyot" stop is; and plane P4 is the second focal plane. Credits:Guyon et al.(1999).
source. By diffraction, the light is distributed (partially) outside the geometric pupil and blocked by an undersized (compared to the first aperture) diaphragm called the Lyot stop. When focused, an off-axis source PSF is slightly shifted compared to the on-axis focal plane mask. It is not affected by the mask and the flux propagates through the system. The star light vanishes and potential nearby companions can be observed. Focal plane coronagraphic masks are divided in two categories, they either use amplitude or phase to cancel the starlight.
Amplitude masks
An amplitude mask is an opaque disk placed at the focal point, it blocks physically the light of the core of the PSF. Its size has to be carefully chosen to only block the core of the stellar PSF. Since the PSF diameter varies with respect to the wavelength, amplitude masks are intrinsically chromatic. The drawback of amplitude masks is their large inner-working angle (IWA). The IWA describes the smallest angular sep-aration between the host star and a detectable companion. This limit is set when the transmission reaches 50%. They also do not completely cancel the starlight. The two main reasons are (i) the diffraction around the mask edges and (ii) since the mask has a finite size, it only blocks the core of the PSF allowing the rest to propagate inside
the geometric pupil. Reducing the Lyot stop diameter improves the cancellation but at the price of a low throughput.
Phase masks
As opposed to amplitude masks, phase masks are transparent. They introduce a phase shift to the on-axis source and by destructive interference the light is rejected outside the geometric pupil. The first phase mask, described inRoddier and Rod-dier(1997) and now referred to as the Roddier coronagraph, consists in a transparent material with a circular step in the center. The step depth e is sized as λ= 2(n-1)e and its diameter only covers a part of the PSF core. The principle is to introduce a π phase shift on a small area of the PSF that will destructively interfere with the rest of the PSF to produce the coronagraphic effect. The advantage of such a mask is the smaller IWA since the light is not physically blocked and only the on-axis source is affected. The starlight cancellation is improved and is perfect for a circular aperture and monochromatic source. The drawback is a strong chromaticism, both the di-ameter and the depth of the step are expressed as a function of λ. The chromatism of the mask can be reduced by using several steps producing different phase shifts (Soummer et al.,2003) at the price of technical difficulties.
To reduce the double chromatic dependance, the four quadrant phase mask was proposed (Rouan et al.(2000),Rouan et al.(2007),Riaud et al.(2001),Boccaletti et al. (2004), Figure1.10). It consists of 2 quadrants inducing a π phase shift with respect to the other 2 to produce the coronagraphic effect. Only the depth of 2 quadrants depends on λ. However the weaknesses of the FQPM include a sensitivity to cen-tral obstruction and spider arms in addition to the loss of transmission at the edges between two quadrants.
Figure 1.10: Left: Design of the four quadrant phase mask (FQPM). Middle: Two quadrants on one diagonal make the light undergo a π phase shift, whereas the two other quadrants let it pass without shifting the phase. Right: Resulting PSF with a logarithmic intensity scale normalized to the peak flux. In the perfect case (circular aperture, perfect phase shift), the stellar light is perfectly cancelled. From Rouan et al.(2007).
The ultimate step of phase masks evolution is the vortex phase mask corona-graph. Core element of this thesis, it will be extensively described in the next chap-ter.
1.3. Coronagraphy 13
1.3.2 Pupil plane coronagraphy
Pupil plane coronagraphy uses amplitude or phase apodizers as spatial filters in the entrance pupil to shape the image of the star downstream.
The apodization can be achieved by variations of amplitude in the entrance pupil. Various shapes can be applied depending on the telescope configurations (spider arms, central obstruction) and the observation goals. The price of their per-formance is a considerable diminution of the instrument throughput (Shaped Pupil Coronagraph,Kasdin et al. (2004)). An other method is the phase apodization of the pupil such as the apodized phase plate (APP,Codona and Angel(2004)). The diffraction mitigate the speckle in some specific zones of the pupil (dark zones) but reinforce them in other zones by symmetry. At maximum, a 180° dark zone can be created to facilitate the detection of faint companions. The main limitations of the APP are its detection zone and outer working angle.
1.3.3 Hybrid solutions
Coronagraphs such as the PIAACMC (phase induced amplitude apodization com-plex mask coronagraph, see Figure1.11, Guyon et al.(2010)) combines both tech-niques and a specific phase mask to offer a complete attenuation of an on-axis source, excellent throughput (>99%) and small IWA (<1λ/D). The drawbacks of such a coro-nagraph are the increased complexity of the instrument layout and the technological challenge of the optics manufacturing.
Amplitude masks are commonly used with pupil plane coronagraphs (Shaped pupil Lyot, apodized pupil Lyot, PIAACMC, hybrid Lyot,Ruane et al.(2018)).
Figure 1.11: Coronagraphic architectures. In CPA (top left), the coronagraphic effect is obtained by the combination of a pupil plane apodizer and a focal plane mask. Performance is augmented in the Apodized Pupil Lyot Coronagraph (APLC) by in-troducing a Lyot mask in the output pupil plane (center left). Further performance improvement is achieved by replacing the opaque focal plane occulting mask with a partially transmissive phase-shifting mask (bottom left). The right part of this fig-ure shows the equivalent coronagraph designs when apodization is performed by lossless PIAA optics instead of a classical apodizer. A graphical representation of complex amplitude in a few relevant planes is shown for each coronagraph: (1) tele-scope entrance pupil, (2) pupil after apodization, (3) focal plane before introduction of the focal plane mask, (4) focal plane after the focal plane mask, and (5) exit pupil plane before truncation by the Lyot mask. The PIAA Complex Mask Lyot Coro-nagraph (PIAACMC), shown in the bottom right of this figure, offers the highest performance of all configurations. Credits:Guyon et al.(2010).
2
T
HEORY AND MANUFACTURING OF
CHARGE
2
VECTOR VORTEX
CORONAGRAPHS
2.1
Vortex phase mask
2.1.1 Theory
The vortex phase mask (Mawet et al.(2005),Foo et al.(2005),Jenkins(2008), Swartz-lander Jr(2009);Mawet et al.(2011),Serabyn et al.(2011)) is a novel approach aiming to overcome the issues faced by the previously described phase masks, which relied on a step difference to create a phase shift. The idea is to produce a continuous phase shift around the optical axis (Figure2.1). The center is a singularity where the phase is not defined, nulling the light locally and creating an optical vortex. Vortex coron-agraphs have a small IWA (down to 0.9λ/D) and high throughput, absence of dark zones limiting the detection, and excellent starlight cancellation.
The helical phase ramp produced by the vector vortex phase mask can be written as exp(iΦ)with Φ = lθ, where θ is the focal plane azimuthal coordinate and l the topological charge: an even number describing the number of times the phaseΦ accumulates 2π along the optical center of the vortex (Pancharatnam,1956). It can be shown mathematically that for a circular aperture and a vortex with an even topological charge (6= 0), the light is fully diffracted outside the geometric image of the pupil and can be stopped by the slightly undersized Lyot stop. The phase ramp can be achieved through two different ways. First, with a scalar vortex: a dielectric material is shaped as an helix to apply the desired phase shift to both orthogonal polarization components of the light. In this case, the vortex is highly chromatic and the manufacturing presents a serious technological challenge in terms of accuracy. The second solution that will be the focus of this thesis is the vector vortex coronagraph (VVC,Mawet et al. (2005) and Delacroix et al. (2010),) and is widely recognized as one of the most promising approaches in coronagraphy.
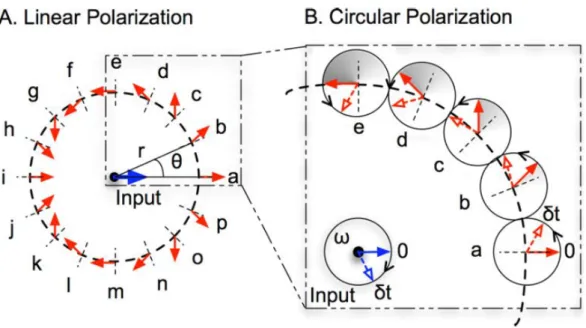
2.1.2 The subwavelength grating vortex coronagraph
The vector vortex phase masks uses a half-wave plate (HWP) inducing a π phase shift between the light polarizations components, which rotates around the optical axis, to create the phase ramp. For a complete rotation, the HWP produces a helical phase ramp with an overall 4π phase shift. This simple structure corresponds to a charge 2 (2×2π) VVC. It has been shown that vector and scalar vortices present the same phase ramp (Mawet et al.(2005);Niv et al.(2006)).
Figure 2.1: The VVC azimuthal phase ramp obtained with a rotationally symmet-ric half-wave plate (HWP). The rotating optical axis orientation is represented with dashed lines perpendicular to the circumference. The net effect of a HWP on a lin-ear impinging polarization is to rotate it by -2×αwhere α is the angle between the
incoming polarization direction and the fast optical axis. An incoming horizontal polarization (blue arrow) is transformed by the vector vortex so that it spins around its center twice as fast as the azimuthal coordinate θ (red arrows). Right: For circu-lar pocircu-larization, the starting angle 0 is rotated, therefore the output field rotation is strictly equivalent to a phase delay. FromMawet et al.(2011).
VVCs have been manufactured using 3 different technologies: liquid crystal polymers (LCP), photonic crystal polymers (PCP) and subwavelength gratings (SG). Among these technlogies, only SG are currently mature for applications in the mid-infrared domain (a spectral range of great interest, see Section 2.2).
This thesis focuses on subwavelength grating vortex coronagraphs (SGVCs). Sub-wavelength gratings have unique properties in terms of light diffraction. Only the zeroth order propagates as long as the period of the gratingΛ is smaller than λ/n (n being the grating refractive index). In this case, it has been demonstrated that one can use the birefringence induced by etching a subwavelength grating on top of a transparent substrate in order to produce a spatially variant achromatic half-wave plate (HWP,Kikuta et al.(1997)). The phase shift depends on two factors: the wave-length and the difference between the two refractive indices of the HWP (which are also related to the wavelength). Physical parameters of the SG can be tuned to make
2.2. AGPM design and manufacturing 17
Figure 2.2: Left: Schematic diagram of a SG. The incident light beam vector is per-pendicular to the grating lines of depth h and a periodicityΛ. The filling factor F is such that FΛ corresponds to the width of the grating walls. Right: AGPM corona-graph scheme. FromMawet et al.(2005).
the two factors proportional and create a close to achromatic HWP across a large spectral band. The achromaticity is a much needed feature for coronagraphs to op-erate over a large wavelength range, allowing spectral analysis and a significantly higher signal-to-noise ratio (SNR). Since the SG is not perfectly achromatic along the spectral band, a coronagraph using this technology will never produce a perfect cancellation of the star light due to chromatic errors in the π phase shift induced between the two orthogonal polarizations. The textbook effect of chromatic errors is to produce a scaled-down version of the non-coronagraphic PSF. The ratio between the original and the scale down PSF will define the performance of such a mask (see Section 3.1). A charge 2 VVC using SG has a simple pattern and is called the Annular Groove Phase Mask (AGPM, Figure2.2).
2.2
AGPM design and manufacturing
2.2.1 Design
The MIR wavelength range is a sweet spot for the direct imaging of young planetary systems, where good wavefront quality can be obtained from the ground with stan-dard adaptive optics correction. The luminosity ratio between thermal emission of a young exoplanet and its host star is also maximized in this region.
To answer the growing demand for coronagraphs in the H- (1.44 to 1.78 µm), K-(1.95 to 2.35 µm), L- (3.5 to 4.1 µm), M- (4.6 to 5 µm) and N- (11 to 13.2 µm) bands, SGVC (subwavelength grating vortex coronagraph) solutions have been developed and optimized for those regions. AGPMs are designed and optimized using Rig-orous coupled-wave analysis (RCWA,Moharam and Gaylord(1981)) to model an optimal π phase shift between the two transverse modes of the light across the spec-tral band considered. RCWA is a Fourier-space semi analytical solving method for grating diffraction. Four parameters are taken into account, the period of the grating Λ, the filling factor F (ratio between the walls width and the period Λ), the depth h of the grooves and the sidewall angle α (usually constrained between 2.5° and 3° due to manufacturing limits). The 4 parameters are optimized within the realistic model
Table 2.1: Optimal grating parameters for various spectral windows (20% band-width) using RCWA simulations. FromDelacroix(2013).
20% BW Gratings parameters Rejection ratio Filter Range (µm) Λ (µm) α(◦) F h (µm) N 11-13.2 4.6 3.0 0.45 16.9 2354 L 3.5-4.1 1.42 3.0 0.45 5.21 2457 K 2.0-2.4 0.82 3.0 0.45 3.02 2366 H 1.5-1.8 0.61 3.0 0.45 2.26 2341 J 1.15-1.4 0.48 3.0 0.45 1.75 2353
conditions that were set after an iterative process between design and manufactur-ing. In Table2.1are displayed optimal parameters for each spectral band depending on the sidewall angle (α).
The RCWA method solves Maxwell’s equations through a discretized AGPM layer by layer. The limitations and approximations in the RCWA modeling of the AGPM are beyond the scope of this thesis but are further discussed inDelacroix (2013) andMawet(2006). We consider RCWA performance simulations as an accu-rate description of the AGPM theoretical limits.
Figure 2.3: Best rejection ratios achievable for AGPMs with optimal parameters in different spectral bands, the grating depth is varied between 5.0 and 6.0 µm from blue to red, with the lines separated by steps of 0.02 µm. The sidewall angle is set to 2.45◦. FromVargas Catalán et al.(2016).
The Figure 2.3illustrates the best null depth achievable across a the L- and M-bands with various gratings depths and otherwise optimized parameters. However, we have to take into account that most likely the manufactured AGPMs will not per-fectly reached the exact optimal parameters. The Figure2.4shows how the deviation from the optimal filling factor or depth will affect the null depth of a given AGPM.
2.2. AGPM design and manufacturing 19
Figure 2.4: RCWA multi-parametric simulation: mean null depth (logarithmic scale) over the whole L band (3.5-4.1 µm) with α ranging from 2.7° to 3.2°. The period is set toΛ = 1.42 µm (SG limit). FromDelacroix et al.(2013).
Details about the modeling of SG can be found in the following publications : Mawet(2006) andDelacroix(2013).
2.2.2 Manufacturing
AGPMs are manufactured by our collaborators at the Uppsala University in Swe-den. They are etched on a synthetic diamond substrate which has been selected for its unique characteristics:
- transparency in the MIR - high refractive index
- good mechanical resistance, low thermal expansion, resistant to chemicals
Several steps are needed to produce an AGPM (see Fig2.5). The diamond sub-strate is coated with different metal layers. The AGPM pattern is printed in a pho-toresist layer coated on top. The different layers are etched to finally obtain the diamond AGPM. Scanning electron microscope or other non-invasive methods can not verify all the parameters of the newly etched AGPMs (in particular the groove depth). To partially solve this issue, a test sample is etched at the same time as the AGPM and cracked after each layer etched to monitor the process and tune it ac-cordingly. The process was described in details in the following papers: Forsberg and Karlsson(2013),Delacroix(2013),Vargas Catalán et al.(2016) andCatalán et al. (2018).
The first AGPMs have been optimized for the N-band since it is in this band that the grating parameters are the largest making the first manufacturing trials
Figure 2.5: Process steps in brief. Diamond substrates are cleaned in solvents and acids (a). Three masking layers are sputtered onto the diamond substrate (b): a thick Al layer, followed by a Si layer and finally a thinner Al layer. A layer of nanoim-print polymer is then spin coated on top of the stack (c). The patterns are written to silicon wafers either by laser- or by e-beam lithography (d). A thin layer of poly-dimethylsiloxane (PDMS) is molded on the patterned wafer (e) and peeled off (f). The structured PDMS is used as stamp in nanoimprint lithography to transfer the pattern to the polymer film at the top of the mask stack on the diamond substrate (g, h). Plasma etching is employed to texture the diamond surface in the following way: the thin polymer pattern is used as mask to etch the pattern in the top Al layer in a Cl2/BCl3 plasma (i). The Si layer is then etched using the top Al layer as mask in an Ar/SF6 plasma (j). The Si layer serves as mask for etching the thick Al layer in cycled Cl2/BCl3 and O2 plasmas (k). With the Al mask finished, the diamond is etched in an Ar/O2 plasma with strong bias (l). Finally, remaining mask material is removed with strong acids (m). FromForsberg and Karlsson(2013).
easier (grating parameters are proportional to λ). Over the years, the process has been perfected (Figure2.6) and reached outstanding accuracy enabling shorter and shorter wavelengths range for the AGPM. Once manufactured, the AGPMs have their performance assessed before their potential installation on large ground-based
2.2. AGPM design and manufacturing 21 telescopes. Developing a testing facility capable to accurately measure their perfor-mance and describe their behavior is the main subject of this thesis.
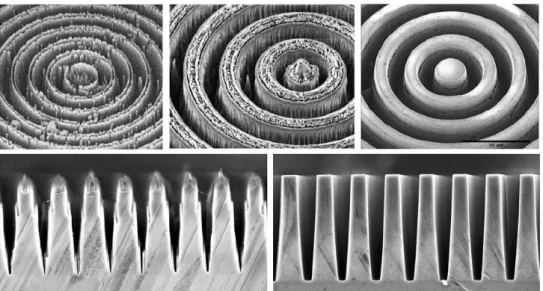
Figure 2.6: Evolution of the manufacturing of diamond AGPMs. Top: N-band AGPMs, with periods ≈ 4.6 µm, manufactured in November 2009, October 2010, and February 2012 (from left to right). Bottom: cracked spares of L-band AGPMs, with periods≈1.4 µm, manufactured in March 2011 and September 2012 (from left to right). FromDelacroix(2013).
2.2.3 Anti-reflective gratings
The first AGPM manufactured had lower than predicted rejection ratio as the on-axis light reflected inside the AGPM was not canceled by the optical vortex. Fixing this issue is mandatory to reach performance close to the simulations and also to im-prove the throughput of the AGPM since coronagraphic instruments usually have to face the issue of low flux observations.
To avoid internal reflections, instead of a single layer film it is possible to use SG as an anti-reflective intermediate medium (Figure2.7). The refractive index of a SG can be tuned by adjusting its filling factor and take the appropriate value to mini-mize the total reflectivity of the AGPM (Karlsson and Nikolajeff, 2003). Delacroix (2013) described a ∼17% backside reflection of the bare diamond substrate in the L-band, reduced to∼1.9% thanks to the ARG. The theoretical transmission in the L-band is averaged to∼87% at L-band (limited by photon absorption in the diamond substrate,Forsberg and Karlsson(2013)).
Figure 2.7: SEM picture of the anti-reflective grating (ARG) etched on the backside of the AGPM. FromDelacroix(2013).
P
ART
II
Development of the VODCA
bench
3
C
ONTEXT AND HERITAGE
We describe in this section how the AGPM performance was assessed until 2014. These tests helped us to define how to achieve the best measurements of our phase masks and what were the requirements in the development of a dedicated test bench.
3.1
Test protocol
The AGPM test protocol aims to provide an accurate method to assess their perfor-mance, allowing a fair comparison between the different manufactured AGPMs and their corresponding data collected throughout the past years. FollowingDelacroix (2013), we chose to evaluate the mask quality with its null depth. The null depth is the flux ratio between two images, one with the beam focused on the center of the mask (on-axis, the PSF is attenuated) and one off-axis (the PSF is not attenu-ated). By decentering the mask by at least 2 mm (> 10λ/D) we make sure that the off-axis PSF is not affected by the vortex effect but still takes into account the trans-mission of the mask. The flux is only integrated in a defined zone of the PSF. An extremely small integration zone would be similar to the peak-to-peak attenuation. It is commonly used for coronagraphic evaluation but not selected in our case since the AGPM (when on-axis) significantly changes the shape of the PSF. Using this method would not accurately described the mask performance. On the opposite, an extremely large integration zone (the full image) would include an important back-ground and speckle noise.
Defining the integration zone as λ/D, which roughly corresponds to the full width at half maximum (FWHM) of the PSF, is the most appropriate choice. Most of the intensity is contained within this diameter, limiting the loss of information and increasing the signal-to-noise ratio. The null depth equation is:
NDAGPM = RFW HM 0 R2π 0 Io f f(r, θ)r dθ dr RFW HM 0 R2π 0 Icor(r, θ)r dθ dr , (3.1)
where Icorand Io f f are the averaged coronagraphic and off-axis images (seeDelacroix
(2013)). The rejection ratio, defined as 1/ND, is also commonly used and will be the main indicator of the AGPM performance in this thesis.
Table 3.1: Rejection ratios measured on IRCT with the He-Ne and the L-band source (AGPM and ARG refer to the mask side facing the beam).
He-Ne Broadband
AGPM ARG AGPM ARG
AGPM-L2 38
AGPM-L5 169 349
AGPM-L6 208 171 87 93
AGPM-L8 28 31 41 32
3.2
Existing facilities for AGPM tests
Performance assessment of AGPM requires a coronagraphic test bench with spe-cific optical equipment and configuration. The minimum optical equipment is an infrared point source in the wavelength range of the masks and the appropriate de-tector. The basic configuration includes the access to one focal plane (where the AGPM will be placed) and after it, a plane conjugate to the entrance pupil (where the Lyot stop will be placed). It follows the classic coronagraphic setup (see Section 1.3).
3.2.1 IRCT
In July 2014, L-band AGPMs were tested on the InfraRed Coronagraphic Testbed (IRCT located at the Jet Propulsion Laboratory, Pasadena, USA). It includes a faint broad band thermal source with a filter limiting the spectral band from 3440 to 4075 nm. Unfortunately the source had a low flux output leading to a poor SNR especially for the on-axis PSF where the initially low flux is divided by a ratio >100. A He-Ne laser at 3.49 µm was also available (Fig. 3.1). The f# on the AGPM is 17 and we had the possibility to image the pupil plane. Unfortunately no shutter was available on the bench. For the background subtraction, the background frame was taken after the science frame by turning off or blocking the source output. It led to an imperfect subtraction because the background fluctuated fast enough to make a noticeable difference (see Section 6.1 background frame subtraction).
On top of the rejection ratio measurements (Table3.1), we also tested the influ-ence of the phase mask side facing the beam (AGPM or AR grating). No evidinflu-ence was found suggesting that the orientation of the phase mask affects either the rejec-tion ratio achieved or the radial profile of the coronagraphic PSF.
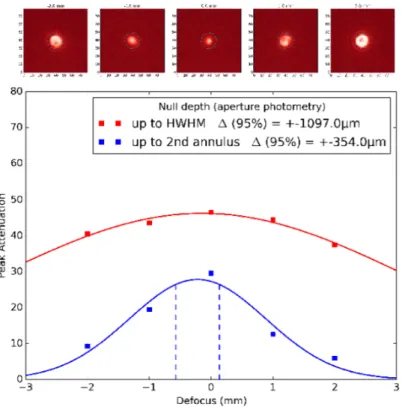
The AGPM focus and tip/tilt sensitivity were also investigated. To do so, the phase mask mount was shifted along the beam for defocus (z axis), and perpendicu-larly to it (x or y axis) to simulate tip/tilt instead of really tilting the wavefront. The only difference between these two methods is that the PSF is not translated on the detector when the AGPM is translated, however, the shape of the PSF is affected in the same way. For each position, the rejection ratio was evaluated. Concerning the defocus (see Fig. 3.2), the rejection ratio has been estimated in two different ways. First, the usual way (see Section 3.1), by integrating in the FWHM zone of the PSF (rejection ratio). Second, integrating the flux in a larger area (4 times the FWHM). Even if this approach is not optimal for AGPM performance assessment (see Section 3.1), it seems more appropriate for this study as it is clear that even if the flux at the center of the PSF does not significantly increase with defocus, the light leaks in the
3.2. Existing facilities for AGPM tests 27
Figure 3.1: Pictures of IRCT. Top: layout of the coronagraphic bench. Bottom: Dif-ference between the focal plane and the pupil plane imaging setup
first annuli of the PSF, reducing the contrast performance.
We conclude that a misplacement of the AGPM by±300 µm did not significantly influence (less than 5% decrease, see Fig. 3.2) the rejection ratio achieved on IRCT and the mask performance.
The same procedure was applied to tip/tilt shift (Fig.3.3). When observing with a telescope, the light leaking in the image is related to the amount of tip-tilt affecting the beam. These measurements contributed to the development of the Quadrant Analysis of Coronagraphic Images for Tip-tilt Sensing, QACITS (Huby et al.,2015).
In conclusion, IRCT was a good starting point for AGPM evaluation and allowed a better understanding of the needs for high rejection ratio evaluation (proper back-ground subtraction and source power). It also emphasized the major role played by tip/tilt alignment on the rejection ratio achieved (discussed in details in Section
Figure 3.2: Influence of the defocus on the rejection ratio. The flux is integrated over the FWHM (red curve) and up to the second annulus of the PSF (blue curve)
Figure 3.3: Tip influence on the PSF shape. Top: same scale – Bottom: adjusted scale 7.2.1). On the contrary, AGPMs showed a relatively lower sensitivity to focus mis-alignment (discussed in details in sect 7.2.2).