HAL Id: hal-01501209
https://hal.archives-ouvertes.fr/hal-01501209
Submitted on 4 Apr 2017HAL is a multi-disciplinary open access archive for the deposit and dissemination of sci-entific research documents, whether they are pub-lished or not. The documents may come from teaching and research institutions in France or abroad, or from public or private research centers.
L’archive ouverte pluridisciplinaire HAL, est destinée au dépôt et à la diffusion de documents scientifiques de niveau recherche, publiés ou non, émanant des établissements d’enseignement et de recherche français ou étrangers, des laboratoires publics ou privés.
Wave velocities in assemblies of glass beads using
bender-extender elements
Mohammad Sharifipour, Christophe Dano, Pierre-Yves Hicher
To cite this version:
Mohammad Sharifipour, Christophe Dano, Pierre-Yves Hicher. Wave velocities in assemblies of glass beads using bender-extender elements. 17th ASCE Engineering Mechanics Conference, Jun 2004, Newark, DE, United States. �hal-01501209�
WAVE VELOCITIES IN ASSEMBLIES OF GLASS BEADS USING
BENDER-EXTENDER ELEMENTS
Mohammad Sharifipour1, Christophe Dano2 and Pierre-Yves Hicher1
ABSTRACT
Experiments of wave propagation through assemblies of glass beads, using bender-extender elements, are presented in this paper. Wave velocities are determined using many procedures of interpretation to be meticulously accurate about the results. The experimental results are then compared to theoretical predictions and experimental results in granular materials found in the literature. The effect of the beads diameter on the shear wave velocity is also investigated.
Keywords: elastic properties, glass beads, bender-extender elements, wave propagation, Hertz’s theory
BENDER-EXTENDER ELEMENTS
Bender elements were developed at the end of the 70’s by Shirley and Hampton (1978). The technology has been gradually improved since that date. Bender elements were for instance implemented in different geotechnical devices - triaxial cells to study both clays and sands, both reconstituted or natural soils, oedometer cells - and even put into centrifuges (Ismail and Hourani, 2003). Bender elements, whose working principle was previously described in Dyvik and Madhus (1986) and Brignoli et al. (1996), are piezoelectric transducers from which a shear wave can be transmitted and received. From the induced electric signals, the elastic properties of a soil in the small strain domain can be identified.
More recently, Lings and Greening (2001) developed a new type of piezoceramics transducers called bender-extender elements from which both shear waves (S-waves) and compression waves (P-waves) can be transmitted and received. Therefore, from the velocities of the S-waves and of the P-waves, it is possible to calculate the Young’s modulus Emax, the shear modulus Gmax and the
1 Research Institute in Civil and Mechanical Engineering (GeM), Ecole Centrale Nantes – University of Nantes – CNRS,
1 rue de la Noë, BP 92101, 44321 NANTES cedex 3, France
Poisson’s ratio in the small strain domain. Dano et al. (2003) showed an application of such bender-extender elements on a Loire River sand.
However, the bender elements technique and its most recent improvements suffer from a lack of standardization. Indeed, although the bender elements technique has proved its efficiency, in spite of many experimental as well as numerical research works, there is no harmonization in the interpretation of the bender elements test results probably due to the fact that the method requires an educated judgment and that the wave propagation happens in a discontinuous and heterogeneous medium containing different phases (solids, water, air).
The authors have chosen to carry out experiments in reference materials, namely spherical glass beads. The results of a first series of tests are presented in this paper.
EXPERIMENTAL PROCEDURE
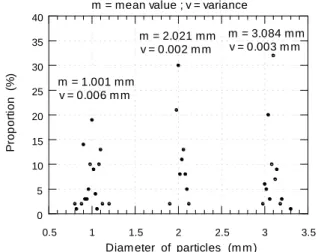
The tested material is composed of solid, spherical and smooth – visually - soda lime glass beads (PGC Scientifics, Ref. 41-5500-01 for the beads of 1mm in diameter, Ref. 41-5500-02 for the beads of 2mm in diameter). Glass beads of unknown origin and 3 mm in diameter were also used. Their grading curves are represented in Figure 1 where m and v represent respectively the mean value and the variance of the diameter of the glass beads.
0 5 10 15 20 25 30 35 40 0.5 1 1.5 2 2.5 3 3.5 P ro p o rt io n (% )
Diam eter of particles (m m ) m = mean value ; v = variance
m = 1.001 mm v = 0.006 m m m = 2.021 mm v = 0.002 m m m = 3.084 mm v = 0.003 m m
FIG. 1. Grain size distribution of glass beads.
The chemical composition is mainly silica, calcium oxide and sodium oxide. The specific gravity of the PGC glass beads is 2,54 g/cm3 (ASTM D854). The elastic modulus and the Poisson’s
ratio of the material are respectively close to 60 GPa and 0.3 as indicated in information brochures by the manufacturers of soda lime glass beads.
The previously dried beads were placed manually, without well-ordered structure, and compacted by shocks on the mould used for the preparation of the samples. Preparation by raining was not possible here because beads bounce outside the mould. However, this procedure was repeatable enough. It induced density between 1.61 g/cm3 and 1.64 g/cm3, except for the first test
for which the density was 1.54 g/cm3. Samples were 100 mm in diameter and the height to diameter
ratio was close to 2. No saturation was applied. The tests were conducted in drained conditions with confining pressures between 100 and 500 kN/m2.
subsequent boundary effects. Bender-extender elements were 10 mm large, 2.5 mm high and about 0.5 mm wide.
THEORETICAL PREDICTIONS
Hertz (1882) theoretically predicted that in a 1D chain of elastic spherical beads, the velocity Vw of an acoustic wave depends on the normal load F applied to the chain following a power law:
6 / 1 3 / 1 3 / 1 w F R E V (1)
where E, and R are respectively the elastic modulus, the density and the radius of the beads. Many experiments were performed to confirm or invalidate the predictions by Hertz (Duffy and Mindlin, 1957; Warren and Anderson, 1973; Pilbeam and Vaisnys, 1973; Goddard, 1990; Jia et al., 1999; Coste, 2001). An obvious conclusion is that the velocities scale up with the pressure following a power law. However, in disordered assemblies of spheres, the power law exponent is experimentally between 1/4 and 1/3, rather than the theoretical value 1/6.
Coste (2001) reviewed the sources of discrepancy between theoretical and experimental data. On the one hand, the sources of discrepancy are “local” and related to the assumptions of the Hertz’s contact law : the beads are not perfectly spherical and smooth, they can be covered with a thin layer of degraded material, sliding can occur in the contact area … On the other hand, the waves propagate through a mass of beads in which the contacts between grains and therefore the force chains that support and transmit the loads are more or less randomly distributed (effect of packing).
EXPERIMENTAL SIGNALS
The experimental work presented in this paper aims at proving the efficiency of the bender-extender elements for the identification of the elastic properties of soils. The subject is not to discuss about the Hertz’s theory but to find consistent pressure-dependent power laws for the wave velocities, and therefore for the elastic properties (Emax, Gmax, ). In Figure 2, typical input
and output signals for S-wave and P-wave propagating through 1 mm glass beads under a pressure of 300 kN/m2 are shown. For comparison, amplitudes were normalized by the absolute maximum
amplitude. No differences between sinusoidal or square signals were notable, whereas the frequency of the input signal has a notable effect on the quality of the output signal.
INTERPRETATION OF PULSE TESTS
As previously mentioned, the interpretation of bender-extender elements tests is not an easy task since the physical phenomena induced by the propagation of a wave into a soil are complex. In the literature, three kinds of interpretation method can be found.
The most often used method consists in identifying the deflection of the output signal that corresponds to the arrival of the wave on the receiver (Jovicic et al., 1996; Brignoli et al., 1996). However, near-field effects and wave reflections on the sample boundaries usually inflect the signal and make the determination of the travel time difficult (Brignoli et al., 1996).
The second method consists in comparing the input and the output signals by cross-correlation (Viggiani and Atkinson, 1995; Mohsin and Airey, 2003). The travel time corresponds then to the time that fits at best the two signals. The third kind of interpretation methods based on Fourier transformation (Mancuso et al., 1989; Theron et al., 2003) were not considered here.
All the indicators (Jovicic et al., 1996; Brignoli et al., 1996; Arroyo et al., 2003) show that near-field effects, though not quantitatively important here, have to be nevertheless considered for the precise determination of the travel time of the shear waves.
-1 -0.5 0 0.5 1 0 0.5 1 1.5 2 N o rm a li ze d a m p li tu d e A /l A ma x l Time (m s) P-wave A' PP A (a) P-wave -1 -0.5 0 0.5 1 0 0.5 1 1.5 2 N o rm a li ze d a m p li tu d e A /l Ama x l Time (m s) S-wave PP A A' PW (b) S-wave
Sinusoidal wave, f = 10 kHz, ’c = 300 kN/m2, 1 mm glass beads
FIG. 2. Examples of input and output experimental signals.
TRAVEL TIME OF THE WAVES
In this section, the travel time of the waves determined by two methods is compared. The peak-to-peak time (denoted PP in Figure 2) has to be considered as a reliable estimate of the travel time Tp for the P-wave or Ts for the S-wave. However, the correct travel time has to be determined
from the delay time denoted AA’ in Figure 2. AA’ is the period between the beginning of the input pulse and the arrival of the wave on the receiver. For the P-wave, the determination of AA’ is relatively easy since the first deflection of the output signal corresponds to the arrival of the P-wave (Fig. 2a). As previously indicated, for the S-wave, near-field effects induce the propagation of a parasite wave that causes the receiver to bend before the arrival of the shear wave. In Fig. 2b, PW corresponds to the arrival of the P-wave identified in Fig. 2a. The point A’ that marks the arrival of the shear wave, is located using recommendations by Jovicic et al. (1996) and Brignoli et al. (1996). The delay times AA’ and PP are usually close, indeed equal.
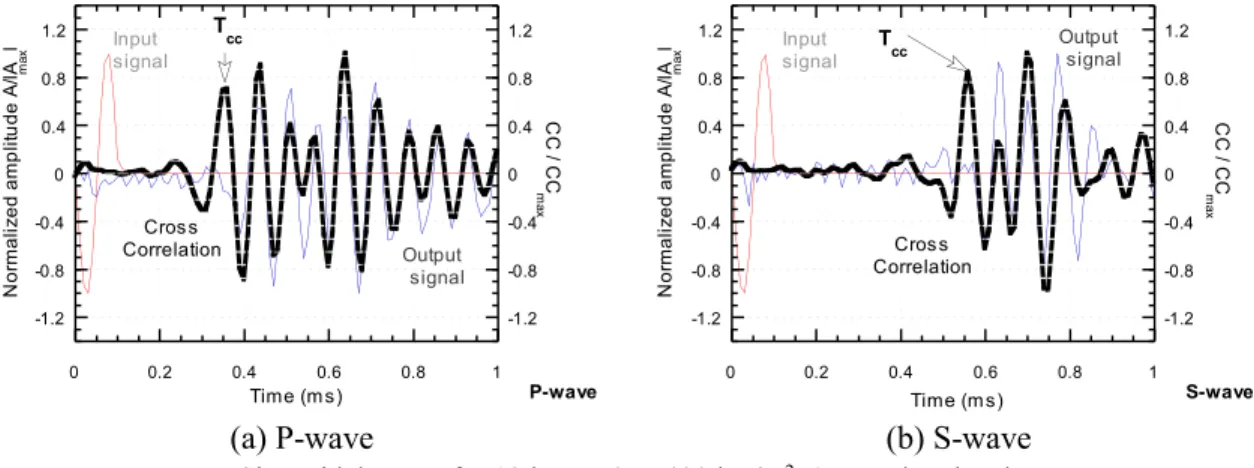
Cross-correlation is also calculated in order to identify the time Tcc that fits at best the input and
the output signals. Examples are shown in Figure 3 for a sample of 1 mm glass beads under a pressure of 400 kN/m2. Assuming that the sample behaves as a linear system, Mohsin and Airey
(2003) indicated that one of the peaks of the cross-correlation should correspond to the correct delay time. The authors added that the cross-correlation method provides a reliable indication of the travel time for frequencies greater than a critical frequency which increases with the effective confining stress. Finally, Mohsin and Airey (2003) presented experimental results on sands from which they conclude that the third peak of the cross-correlation corresponds to the correct arrival of a shear wave.
Values of AA’, PP and Tcc for four tests on 1mm glass beads with confining pressures equal to
300 kN/m2 and 400 kN/m2 are reported in Table 1. In Table 1, P and S respectively stands for a
the wave velocities Vp for the P-wave and Vs for the S-wave respectively. A slight uncertainty of
about 0.02 ms can be observed depending on the interpretation method. That uncertainty induces a relative uncertainty on the shear modulus Gmax/Gmax close to 10 %.
-1.2 -0.8 -0.4 0 0.4 0.8 1.2 -1.2 -0.8 -0.4 0 0.4 0.8 1.2 0 0.2 0.4 0.6 0.8 1 N or m al iz ed am pl itu de A/ lAmax l C C / C C m ax Time (ms) Input signal Output signal Cross Correlation P-wave Tcc (a) P-wave -1.2 -0.8 -0.4 0 0.4 0.8 1.2 -1.2 -0.8 -0.4 0 0.4 0.8 1.2 0 0.2 0.4 0.6 0.8 1 N or m al iz ed am pl itu de A/ lAmax l C C / C C m ax Time (ms) Input
signal Output signal
Cross Correlation
S-wave Tcc
(b) S-wave
Sinusoidal wave, f = 10 kHz, ’c = 400 kN/m2, 1 mm glass beads
FIG. 3. Cross-correlation of both P-wave and S-wave. TABLE 1. Comparison of travel time.
p’ Wave PP AA’ Tcc Tp Ts Figure
kN/m2 S or P ms ms ms ms ms
300 P 0.38 0.36 0.35 0.36 - 2a
300 S 0.61 0.61 0.61 - 0.61 2b
400 P 0.36 0.35 0.36 0.36 - 3a
400 S 0.56 0.56 0.56 - 0.56 3b
PRESSURE - DEPENDENT WAVE VELOCITY
It is well-known that the velocities Vp and Vs can be calculated following :
P P TL V (2) S S TL V (3)
where L is the distance covered by the wave. The distance is the length between the tips of the bender-extender elements (Jovicic et al., 1996; Brignoli et al., 1996). The length is corrected from the volumetric variation of the sample during isotropic loading or unloading.
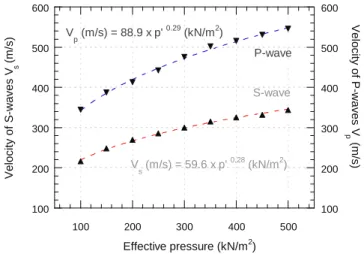
Figure 4 represents the velocities Vp and Vs (in m/s) as a function of the mean effective pressure
p’ (in kN/m2). As expected, the velocities increase with the effective pressure following power
29 . 0 P 88.9 p' V (4) 28 . 0 S 59.6 p' V (5)
Exponents in equations (4) and (5) are almost similar. Therefore, it induces an almost constant value for the Poisson’s ratio since :
2 S 2 P 2 S 2 P
V
V
V
2
V
2
1
(6)as previously observed in a Loire River sand (Dano et al., 2003). Here, the value of the Poisson’s ratio is between 0.13 and 0.17. Such a value is typical of many soils.
100 200 300 400 500 600 100 200 300 400 500 600 100 200 300 400 500 Velocity of S-waves V s (m/s) Velocity of P-waves V p (m/s) Effective pressure (kN/m2) S-wave P-wave V s (m/s) = 59.6 x p' 0.28 (kN/m2) V p (m/s) = 88.9 x p' 0.29 (kN/m2)
FIG. 4. Pressure-dependent velocity of waves.
EFFECT OF BEADS SIZE
After being validated, the procedure is used to compare the velocity of shear waves propagating through assemblies of glass beads of different size. Two tests on samples of 1 mm beads with initial void ratios e0 respectively equal to 0.56 and 0.58 (independent from the previous test), two tests on
samples of 2 mm beads (e0 equal to 0.58) and two tests on samples of 3 mm beads (e0 respectively
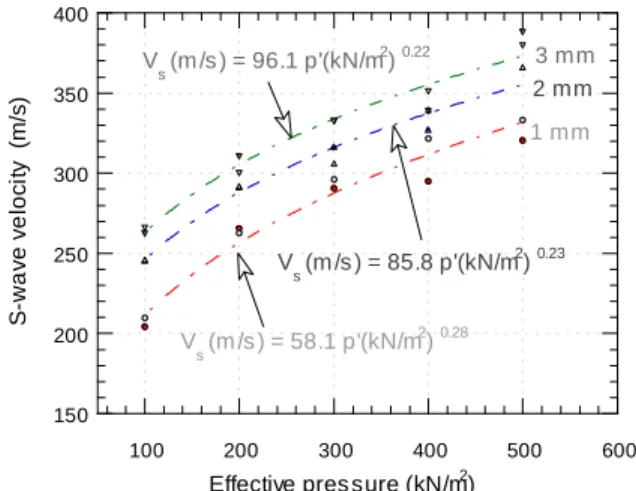
equal to 0.57 and 0.55) were carried out along isotropic stress paths. Calculated velocities are reported in Figure 5.
The main observation is that the value of the exponent decreases whereas the diameter of the beads increases. However, curve fits slightly depend on the experimental scattering. Even if this do not change the previous observation, the results has to be taken with care. Indeed, previous papers (Chang and Makarechi, 1982; Hicher, 2001) indicated that the shear modulus is not affected by the mean diameter of the soil particles. Nevertheless, this observation leads to examine even more the validity of the method for the measurement of wave velocities in the small strain domain.
150 200 250 300 350 400 100 200 300 400 500 600 S -w a ve ve lo ci ty (m /s )
Effective pres sure (kN/m2)
V s (m /s ) = 58.1 p'(kN/m 2 ) 0.28 V s (m /s ) = 96.1 p'(kN/m 2 ) 0.22 Vs (m /s ) = 85.8 p'(kN/m2) 0.23 1 mm 2 mm 3 mm
FIG. 5. Size effect of the beads on the velocity of S-waves.
COMMENTS
Experimental results presented in this paper are consistent with previous published results synthesized above. The exponents characterizing the pressure-dependent relations for the velocities are between 0.22 and 0.29, depending on the size of the particles. These relatively high values for the exponents compared to the theoretical predictions by Hertz can be attributed to the disordered structure of the sample and the preparation method that probably induced an anisotropic fabric.
CONCLUSIONS
Experiments of wave propagation through samples of glass beads are carried out in order to validate the bender-extender elements technique. Indeed, the method has already shown its effectiveness in the determination of elastic properties of sands. However, it suffers from a lack of validation in standard materials such as glass beads. The velocities of both compression waves and shear waves are experimentally determined. These velocities evolve as a power law of the effective pressure. The exponents of these power laws and the values of the Poisson’s ratio calculated from the S-wave and P-wave velocities are consistent with current results found in the literature. However, further work has to be carried out in order to explain the dependence of the power law exponent on the beads size.
REFERENCES
Arroyo, M., Muir Wood, D. and Greening, P.D. (2003), “Source near-field effects and pulse tests in soil samples”, Geotechnique, 53(3), 337-345.
Brignoli, E.G.M., Gotti M., and Stokoe, K.H. (1996), “Measurement of shear waves in laboratory specimens by means of piezoelectric transducers”, Geotechnical Testing Journal, 19(4), 384–397.
Chang, C.S. and Makarechi, H. (1982), “Effects of gradation on shear modulus of Denver sands at small strains”, Soil Dynamics & Earthquake Engineering Conference, Southampton, 117-129. Coste, C. (2001), “Propagation d’ondes dans un milieu granulaire modèle”, in Mécanique des
Milieux Granulaires, under the direction of J. Lanier, Hermès Sciences, 185-212.
small-strain domain using new bender-extender elements”, Proceedings of the 16th Engineering
Mechanics Conference, University of Washington, Seattle.
Duffy, J. and Mindlin, R.D. (1957), “Stress-strain relation and vibrations of a granular medium”, Journal of Applied Mechanics, 24, 585-593.
Dyvik, R. and Madhus, C. (1986), “Lab measurements of Gmax using bender elements”, Publication
161 of the Norwegian Geotechnical Institute, 1-7.
Goddard, J.D. (1990), “Nonlinear elasticity and pressure-dependent wavespeed in granular media”, Proceedings of the Royal Society, London, A430, 105-131.
Hertz, H. (1882), “Über die Berührung fester elastischer Körper”, J. reine und angewandte Mathematik, 92, 156-171.
Hicher, P-Y. (2001), “Microstructure influence on soil behaviour at small strains”, Prefailure Deformation Characteristics of Geomaterials, Jamiolkowski, Lancellotta & Lo Presti (eds), 1291-1297.
Ismail, M.A. and Hourani, Y. (2003), “An innovative facility to measure shear-wave velocity in centrifuge and 1-g models”, Deformation Characteristics of Geomaterials, Proceedings of the 3rd International Symposium ISLyon 2003, A.A. Balkema Publishers, 21-29.
Jia, X., Caroli, C. and Velicky, B. (1999), “Ultrasound propagation in externally stressed granular media”, Phys. Rev. Lett., 82(9), 1863-1866.
Jovicic, V., M.R. Coop, and M. Simic (1996), “Objective criteria for determining Gmax from bender
element tests”, Geotechnique, 46(2), 357-362.
Lings, M.L. and Greening, P.D. (2001), “A novel bender/extender element for soil testing”, Geotechnique, 51(8), 713-717.
Mancuso, C., Simonelli, A.L. and Vinale, F. (1989), “Numerical analysis of in situ S-wave measurements”, Proc. of the 12th International Conference on Soil Mechanics and Foundation
Engineering, Rio de Janeiro, 1, 277-280.
Mohsin, A.K.M. and Airey, D.W. (2003), “Automating Gmax measurement in triaxial tests”,
Deformation Characteristics of Geomaterials, Proceedings of the 3rd International Symposium
ISLyon 2003, A.A. Balkema Publishers, 73-80.
Pilbeam, C.C. and Vaisnys, J.R. (1973), “Acoustic velocities and energy losses in granular aggregates”, Journal of Geophysical Research, 78(5), 810-824.
Shirley, D.J. & Hampton, L.D. (1978), “Shear-wave measurements in laboratory sediments”, Journal of Acoustics Soc. Am., 63(2), 607-613.
Theron, M., Clayton, C.R.I. and Best, A.I. (2003), “Interpretation of side-mounted bender elements using phase shift and group velocity”, Deformation Characteristics of Geomaterials, Proceedings of the 3rd International Symposium ISLyon 2003, A.A. Balkema Publishers,
127-132.
Viggiani, G. and Atkinson, J.H. (1995), “Interpretation of bender element tests”, Geotechnique, 45(1), 149-154.
Warren, N. and Anderson, O.L. (1973), “Elastic properties of granular materials under uniaxial compaction cycles”, Journal of Geophysical Research, 78(29), 6911-6925.