HAL Id: hal-01816248
https://hal.inria.fr/hal-01816248
Submitted on 15 Jun 2018
HAL is a multi-disciplinary open access
archive for the deposit and dissemination of
sci-entific research documents, whether they are
pub-lished or not. The documents may come from
teaching and research institutions in France or
abroad, or from public or private research centers.
L’archive ouverte pluridisciplinaire HAL, est
destinée au dépôt et à la diffusion de documents
scientifiques de niveau recherche, publiés ou non,
émanant des établissements d’enseignement et de
recherche français ou étrangers, des laboratoires
publics ou privés.
Putting the Next 500 VM Placement Algorithms to the
Acid Test
Adrien Lebre, Jonathan Pastor, Anthony Simonet, Mario Südholt
To cite this version:
Adrien Lebre, Jonathan Pastor, Anthony Simonet, Mario Südholt. Putting the Next 500 VM
Place-ment Algorithms to the Acid Test: The Infrastructure Provider Viewpoint. IEEE Transactions on
Parallel and Distributed Systems, Institute of Electrical and Electronics Engineers, 2018, pp.1-14.
�10.1109/TPDS.2018.2855158�. �hal-01816248�
Putting the Next 500 VM Placement
Algorithms to the Acid Test
The Infrastructure Provider Viewpoint
Adrien Lebre, Jonathan Pastor, Anthony Simonet, Mario S ¨udholt
Abstract—Most current infrastructures for cloud computing leverage static and greedy policies for the placement of virtual machines.
Such policies impede the optimal allocation of resources from the infrastructure provider viewpoint. Over the last decade, more dynamic and often more efficient policies based, e.g., on consolidation and load balancing techniques, have been developed. Due to the underlying complexity of cloud infrastructures, these policies are evaluated either using limited scale testbeds/in-vivo experiments or ad-hoc simulators. These validation methodologies are unsatisfactory for two important reasons: they (i) do not model precisely enough real production platforms (size, workload variations, failure, etc.) and (ii) do not enable the fair comparison of different approaches. More generally, new placement algorithms are thus continuously being proposed without actually identifying their benefits with respect to the state of the art.
In this article, we show how VMPlaceS, a dedicated simulation framework enables researchers (i) to study and compare VM placement algorithms from the infrastructure perspective, (ii) to detect possible limitations at large scale and (iii) to easily investigate different design choices. Built on top of the SimGrid simulation platform, VMPlaceS provides programming support to ease the implementation of placement algorithms and runtime support dedicated to load injection and execution trace analysis. To illustrate the relevance of VMPlaceS, we first discuss a few experiments that enabled us to study in details three well known VM placement strategies. Diving into details, we also identify several modifications that can significantly increase their performance in terms of reactivity. Second, we complete this overall presentation of VMPlaceS by focusing on the energy efficiency of the well-know FFD strategy. We believe that VMPlaceS will allow researchers to validate the benefits of new placement algorithms, thus accelerating placement research and favouring the transfer of results to IaaS production platforms.
Index Terms—Cloud Computing, Infrastructure-as-a-Service, VM placement, simulation, energy
F
1
I
NTRODUCTIONDespite the ever more flexible and often more efficient ap-proaches to the Virtual Machine Placement Problem (VMPP) that have been developed, most popular Cloud Computing (CC) management systems [1], [2], [3], a.k.a. IaaS toolk-its [28], continue to rely on elementary Virtual Machine (VM) placement policies. Typically, a batch scheduling ap-proach is used: VMs are allocated according to user re-quests and tied to the nodes where they were deployed until their destruction [33]. Besides the fact that users of-ten overestimate their resource requirements, in particular for web-services and enterprise Information Systems [9], [32], such static policies are definitely not optimal for CC providers, since the effective resource requirements of each VM may significantly vary during its lifetime. In other words, elementary placement strategies prevent providers from finding the sweet spot that maximizes the usage of their resources and satisfies the requirements of their cus-tomers’ VMs defined by Service Level Agreements (SLAs).
• A. Lebre, J. Pastor and M. S ¨udholt are with Inria, IMT Atlantique, LS2N, Nantes, France.
E-mail: [email protected]
• A. Simonet is with the Rutgers Discovery Informatics Institute, Rutgers University, Piscataway, NJ 08854, USA.
E-mail: [email protected]
Initial version received on May 25th, 2017. Revision received on TODO
An important impediment to the adoption of more advanced strategies such as consolidation, load balancing and other SLA-proof algorithms that have been intensively investigated by the research community [16], [19], [22], [30], [36], [37] is related to their validation processes: most VMPP proposals have been evaluated either by leveraging ad-hoc simulators or small testbeds. In addition to raising accuracy issues, ad-hoc simulators do not allow researchers to per-form fair comparisons. Small-testbeds are not representative enough with respect to large-scale production systems. Im-plementing and evaluating each proposal on representative testbeds in terms of scalability, reliability, energy consump-tion and varying workloads would definitely be the most rigorous way to observe and propose appropriate solutions for CC production infrastructures. However, in-vivo (i.e., real-world) experiments, if they can be executed at all, are always expensive and tedious to perform [7]. Consequently, new placement algorithms often fail to compare to the state of the art and to identify their actual benefits.
To improve the experimental validation, we designed VMPlaceS, a dedicated simulation framework that enables in-depth investigations and fair comparisons of VM place-ment algorithms in order to help researchers measure and validate new proposals in an identical setup [26]. VMPlaceS allows users to study large-scale scenarios that involve tens of thousands of VMs, each executing a specific workload that evolves during the simulation. Such conditions are mandatory to perform simulations that are representative
enough of CC production platforms [8], [9], [32]. Although several studies has been conducted on top of CloudSim [11], VMPlaceS has been designed on top of the latest extensions of SimGrid [21], a distributed system simulator that enables researchers to conduct cloud investigations. More precisely, we chose SimGrid because it integrates an accurate live VM migration model which is a key element when studying dynamic placement strategies [20].
The accuracy of VMPlaceS has been discussed in our pre-vious work [26] in which we conducted a preliminary anal-ysis of three well-known VMPP approaches: Entropy [19], Snooze [16], and DVMS [30]. Besides being well-known from the literature, we initially chose these three systems because they demonstrate three different software archi-tectures: Entropy is centralized, Snooze is hierarchical and DVMS is fully distributed. In this article, we present an extended analysis of the capabilities of VMPlaceS to study VM placement strategies, in particular in order to identify major limitations and to investigate variants that can have a significant impact on the overall behavior.
The contributions of this article are the following:
• We introduce the design, implementation and key features of VMPlaceS that enable infrastructure providers to identify the best VM placement ap-proach according to their expectations (consolida-tion, load-balancing, . . . ).
• We complete our previous analysis regarding
En-tropy, Snooze, and DVMS. In particular, we analyze experimental results comparing the different place-ment mechanisms and variants in terms of scalabil-ity, computation time, reconfiguration and violation time. Although comparing these strategies is not the main goal of the article, this experimental analysis highlights the importance of (i) the duration of the reconfiguration phase compared to the computation phase; (ii) the high number of migrations overall; (iii) the size of the infrastructure partitions to handle the scheduling process; (iv) the advantages of a reac-tive strategy compared to a periodic one and (v) the moderate impact of node crashes for the hierarchical and distributed approaches.
• We show that with minimal modifications, VMPlaceS can estimate the energy consumption of a CC in-frastructure. We illustrate this feature with a study of the energy efficiency of Entropy and the First Fit Decreased algorithm and demonstrate the benefits of consolidation to minimize energy consumption. We underline that VMPlaceS allows researchers to ad-dress the VM Placement Problem from the infrastructure provider perspective. Several placement strategies have been proposed at the level of the application in order to guarantee application SLAs while mitigating the cost of pro-visioning resources. Although relevant, such optimizations are out-of-scope of VMPlaceS. To sum up, VMPlaceS aims at helping researchers on cloud infrastructures prototyping placement strategies and evaluating them through accurate and comparable simulations; it enables complex “in vivo” experiments to be limited to the most relevant ones.
The rest of the article is structured as follows. Section 2 highlights the importance of the scalability, reliability and
reactivity properties for the VM Placement problem. Sec-tion 3 gives an overview of SimGrid and its latest exten-sions on which our proposal is built. Section 4 introduces VMPlaceS and discusses its general functioning. The three algorithms implemented as use-cases are presented in Sec-tion 5 and evaluated in SecSec-tion 6. SecSec-tion 7 introduces the FFD algorithm and the energy consumption features of VMPlaceS. Section 8 and Section 9 present, respectively, related work as well as a conclusion and future work.
2
T
HEVM P
LACEMENTP
ROBLEMThe objective of a VM Placement stragegy is to find a configuration that satisfies a function (such as load bal-ancing or minimizing the number of nodes used to host VMs of a system), while ensuring that VMs can access all the resources they need. This problem has been largely described from a mathematical perspective (for recent refer-ence see [18]). In this section, we describe how VM place-ment managers are usually impleplace-mented. Understanding software programming patterns for these managers is a key element to propose a framework such as VMPlaceS.
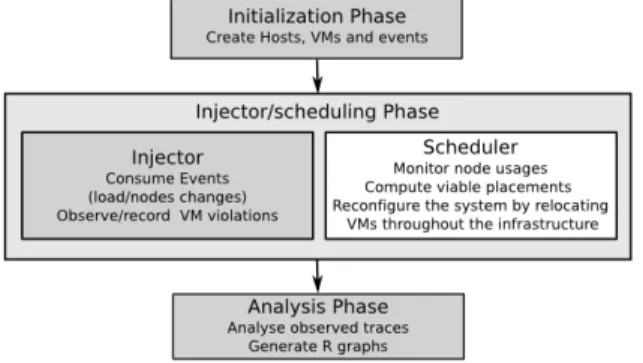
In most cases, VM placement managers are implemented through an autonomic loop composed of three steps (see Figure 1(a)): monitoring the resources usages, computing a new schedule each time it is needed and applying the result-ing reconfiguration plan (i.e., performresult-ing VM migration and suspend/resume operations to switch to the new placement solution). 1. Monitoring 3. Applying schedule 2. Computing schedule Service node Worker node Communication between nodes
(a) Scheduling steps (b) Workload fluctuations during scheduling
Fig. 1. VM scheduling Phases (from [30])
VMPP solutions stand and fall with their scalability, reliability and reactivity properties (i.e., the time to solve a SLA violations), because they have to maintain a placement that satisfies the requirements of all VMs while optimizing the usage of CC resources. For instance, a naive imple-mentation of a master/worker approach as described in Figure 1(a) would prevent workload fluctuations to be taken into account during the computation and the application of a schedule, potentially leading to artificial violations (i.e., re-source violations that are caused by the VMPP mechanism). In other words, the longer each phase, the higher the risk that the schedule may be outdated when it is computed or eventually applied (see the different loads during the three phases in Figure 1(b)). Similarly, server and network crashes can impede the detection and resolution of resource violations if the master node crashes or if a group of VMs is temporarily isolated from the master node. VMPP solutions can only be reasonably evaluated if experimental protocols
account for such unwanted events. Providing a framework that facilitates and increases the reproducibility of such studies is the main objective of VMPlaceS.
Section 6 and 7 present what such a study can be. While the goal of this article is not to provide an extensive evalu-ation of VM placement algorithms, we chose a small set of representative experiments for comparing different strate-gies and we showcase how VMPlaceS can perform them. These experiments evaluate the violation times (how much time the VMs consume more resources that are available on the hosts), reconfigurations (number of migrations, fault tolerance during the reconfigurations, the number of failed reconfigurations) and energy (KwH consumed, number of running hosts). We also evaluate variants of the hierarchical strategy, demonstrating how VMPlaceS can be used to finely tune VM placement algorithms.
3
S
IMG
RID,
AG
ENERICT
OOLKIT FORS
IMULAT-ING
D
ISTRIBUTEDS
YSTEMSWe now briefly introduce the toolkit on which VMPlaceS is based. SimGrid is a simulator for complex algorithms executed on large-scale distributed systems. Developed for more than a decade, it has been used in a large number of studies described in more than 100 publications. Its main characteristics are the following:
• Extensibility: after Grids, HPC and P2P systems, SimGrid has been extended with abstractions for virtualization technologies (i.e., Virtual Machines in-cluding a live migration model [21]) to allow users to investigate Cloud Computing challenges [27].
• Scalability: it is possible to simulate large-scale sce-narios; as an example, users demonstrated that Sim-Grid can simulate applications composed of 2 mil-lion processors and an infrastructure composed of 10,000 servers [13].
• Flexibility: SimGrid enables to run simulations on arbitrary network topologies under dynamically changing computations and network resources.
• Versatile APIs: users can leverage SimGrid through easy-to-use APIs for C and Java.
These characteristics allow SimGrid and VMPlaceS to simulate very complex use cases that are not covered in this article. These include elasticity, distributed cloud ap-plications, multiple geographically distributed data centers, Wide Area networks and the effect of varying Internet traffic (daily/weekly variations and one-time bursts).
To perform simulations, users develop a program, define a platform file and a deployment file. The program leverages, in most cases, the SimGrid MSG API that allows end-users to create and execute SimGrid abstractions such as processes, tasks, VMs and network communications. The platform file provides the physical description of each resource com-posing the environment and on which the aforementioned computations and network interactions will be performed in the SimGrid world. The deployment provides a mapping from the different SimGrid processes defined in the program to the different nodes. Finally, the execution of the program is orchestrated by the SimGrid engine that internally relies on an constraint solver to correctly assign the amount of
CPU/network resources to each SimGrid abstraction during the entire simulation.
SimGrid provides many other features such as model checking, the simulation of DAGs (Direct Acyclic Graphs), MPI-based applications and more recently an energy con-sumption model. In the following, we only give a brief description of the virtualization abstractions that have been implemented and on which VMPlaceS relies (for further information regarding SimGrid see [13]).
The VM support has been designed so that all operations that can be performed on a host can also be performed inside a VM. From the point of view of a SimGrid Host, a SimGrid VM is an ordinary task while from the point of view of a task running inside a SimGrid VM, a VM is considered as an ordinary host. SimGrid users can thus easily switch between a virtualized and non-virtualized infrastructure. Moreover, thanks to MSG API extensions, users can control the life cycle of VMs in the same manner as in the real world (e.g., create/destroy VMs; start/shutdown, suspend/resume and migrate them). For migration opera-tions, a VM live migration model implementing the pre-copy migration algorithm [14] of Qemu/KVM has been integrated into SimGrid. To the best of our knowledge, this is the only validated model that has been integrated in a simulator toolkit. This model simulates the behavior of live migrations by taking into account the competition arising in the presence of resource sharing as well as the memory refreshing rate of the VM, thus determining correctly the live migration time as well as the resulting network traf-fic [20]. These two capabilities were mandatory to build the VM placement simulator.
4
VMP
LACES
The purpose of VMPlaceS is to deliver a generic tool to evaluate and compare new VM placement algorithms. Concretely, it supports the management of VM creations, workload fluctuations as well as node apparitions/removals (churn). Researchers can thus focus on the implementation of new placement algorithms and evaluate how they behave in the presence of changes that occur during the simulation. VMPlaceS has been implemented in Java by leveraging the messaging API (MSG) of SimGrid. Although the Java layer has an impact of the efficiency of SimGrid, we believe its use is acceptable because Java offers important benefits to researchers for the implementation of advanced scheduling strategies, notably concerning the ease of implementation of new strategies. As examples we reimplemented Snooze [16] in Java and DVMS [30] using Scala and Java.
In the following we give an overview of the framework and describe its general functioning.
4.1 Overview
From a high-level view, VMPlaceS performs simulations in three phases: initialization, injection and trace analysis (see Figure 2). The initialization phase corresponds to the creation of the environment, the VMs and the generation of the queue of events, for example, load changes and faults. The simulation is performed by at least two Sim-Grid processes, one executing the injector and the other one executing the to-be-simulated scheduling algorithm. The
Fig. 2. VMPlaceS’s Workflow: gray parts correspond to the generic code while the white one must be provided by end-users. The current version is released with three (centralized, hierarchical, distributed) schedulers.
scheduling strategy is evaluated by taking into account the different events played by the injector during the simu-lation. Currently, the supported events are VM CPU load changes and VMs/PMs apparitions/removals that we use to, respectively, simulate dynamic VM provisioning and crashes of physical machines. The last phase consists in the analysis of the collected traces in order to gather the results of the simulation, notably by means of the generation of figures representing, for instance, resource usage statistics.
Regarding the non-generic part, users must develop their scheduling algorithm by leveraging the SimGrid mes-saging API and a more abstract interface that is pro-vided by VMPlaceS and consists of the XHost, XVM and SimulatorManager classes. The two former classes re-spectively extend SimGrid’s Host and VM abstractions while the latter controls the interactions between the different components of the VM placement simulator. Throughout these three classes users can inspect the current state of the infrastructure at any time (i.e., the load of a host/VM, the number of VMs hosted on the whole infrastructure or on a particular host, whether a host is overloaded, . . . ). We underline that the expression of the scheduling algorithm is only limited by the abstractions provided by VMPlaceS and SimGrid: a large range of scheduling algorithms can therefore be formulated and executed by our simulator.
4.2 Initialization Phase
In the beginning, VMPlaceS creates n VMs and assigns them in a round-robin manner to the first p hosts defined in the platform file. The default platform file corresponds to a cluster of h + s hosts, where h corresponds to the number of hosting nodes and s to the number of services nodes. The values n, h and s constitute input parameters of the simulations (specified in a Java property file). These hosts (h+s) are organized in form of topologies, a cluster topology being the most common one. It is possible, however, to define more complex platforms to simulate, for instance, scenarios involving several data centers and thus study geo-distributed or federated scenarios.
Each VM is created based on one of the predefined VM classes. A VM class is a template specifying its attributes and memory footprint. Concretely, it defines five parameters: the number of cores nb_cpus, the size of the memory ramsize, the network bandwidth net_bw, the maximum
bandwidth available to migrate it mig_speed (generally equal to net_bw) and the maximum memory update speed mem_speed when the VM is consuming 100% of its CPU resources. The memory update speed, see Sec. 3, is a critical parameter that governs the live migration time as well as the amount of transferred data. By giving the possibility to define VM classes, VMPlaceS allows researchers to simu-late different kinds of workload (i.e., memory-intensive vs non-intensive workloads), and thus analyze more realistic Cloud Computing problems. Available classes are defined in a specific text file that can be modified according to the user’s needs. Finally, all VMs start with a pre-defined CPU consumption that will evolve during the simulation depending on the injected load as explained below.
After creating and assigning the VMs to hosts, VMPlaceS spawns at least two SimGrid processes, the injector and the selected scheduler. The first action of the injector consists in creating the different event queues and merge them into a global one that will be consumed during the second phase of the simulation. The architecture of VMPlaceS allows to easily replace the Injector implementation to simulate any workload. We have used the default Injector that pseudo-randomly generates up to three kinds of event: CPU load, VM apparition/removal and physical machine crash events.
As to CPU loads, the event queue is generated in order to change the load of each VM every t seconds on average. t is a random variable that follows an exponential distribution with rate parameter λtwhile the CPU load of a VM evolves
according to a Gaussian distribution defined by a given mean (µ) as well as a given standard deviation (σ). t, µ and σ are provided as input parameters of a simulation. Although a recent study on the characterization of produc-tion cloud computaproduc-tion (CC) workloads [9] advocates the use of exponential distributions to capture both CPU usages and the temporal variability, we believe that a Gaussian distribution is more appropriate to simulate small periods of CC platforms (i.e., less than 2 hours). In addition to being more expressive for researchers (i.e., it is simpler to define µ and σ than finding the right λ), the exponential law does not allow VMPlaceS to concentrate the possible changes around a common value for a particular period, which corresponds to the normal behavior of CC workloads at a certain moment of the day [32]. In other words, the load of a CC workload significantly differs at the scale of the day but not at the scale of the hour. Finding the right distribution that will enable VMPlaceS to simulate CC production platforms over longer periods (i.e., days) is part of our future work. Getting back to the Gaussian, as the CPU load can fluctuate between 0 and 100%, VMPlaceS prevents the assignment of nonsensical values when the Gaussian distribution returns a number smaller than 0 or greater than 100. Although this has no impact on the execution of the simulation, we emphasize that this can reduce/increase the actual mean of the VM load, especially when σ is high. Hence, it is important for users to specify appropriate values.
Regarding VM apparition/removal and node crashes, the event queue is generated in order to turn off a VM, and reciprocally a physical machine, every f seconds on average for a duration of d seconds [8]. Similarly to the t value above, f follows an exponential distribution with rate λf. f and d
the VMs (and reciprocally for the PMs).
We underline that adding new events can easily be done by simply defining new Java event classes implementing the InjectorEvent interface and by adding the code in charge of generating the associated queue. This new queue will be merged into the global one and its events will then be consumed similarly to other ones during the injection phase. We are currently integrating new events in order to simulate network and disk usage events.
Finally, we highlight that every pseudo-random number generator used in VMPlaceS is initialized with a single seed defined in the configuration file. This way, we ensure that simulations are always reproducible and can be used to establish fair comparisons.
4.3 Injector Phase
Once the VMs and the global event queue are ready, the evaluation of the scheduling mechanism can start. First, the injector process iteratively consumes the different events that represent, for now, load changes of a VM, turning a VM or a PM off or on. Changing the load of a VM corresponds to creating and starting a new SimGrid task in the VM. Because the new task increases or decreases the current CPU load (and thus its memory update speed), it has a direct impact on the time that will be needed to migrate the VM. Turning a VM or PM off just consists in invoking the corresponding call in the VMPlaceS code.
As defined by the scheduling algorithm, VMs will be suspended/resumed or relocated on the available hosts to meet scheduling objectives and SLA guarantees. Note that users must implement the algorithm in charge of solving the VMPP but also the code in charge of applying re-configuration plans by invoking the appropriate methods available from the SimulatorManager class. As described in Section 2, this step is essential as the reconfiguration cost is a key element of dynamic placement systems.
Last but not least, note that VMPlaceS really invokes the execution of each scheduling strategy in order to get the effective reconfiguration plan: the computation time that is observed is not simulated but corresponds to the effective one, only the workload inside the VMs and the migration operations are simulated in SimGrid. The computation time therefore has to be propagated into the SimGrid engine.
4.4 Trace Analysis
The last step of VMPlaceS consists in analyzing the informa-tion that has been collected during the simulainforma-tion. This anal-ysis is done in two steps. First, VMPlaceS records several metrics related to the platform utilization throughout the simulation by leveraging an extended version of SimGrid’s TRACE module1. This way, visualization tools that have been developed by the SimGrid community, such as Pa-jeNG [4], may be used. Furthermore, our extension enables the creation of a JSON-formatted trace file, which is used to generate several figures using the R stats environment [10] about the resource usage during the simulation.
By default, VMPlaceS records the load of the different VMs and hosts, the occurrence and duration of each vio-lation of VM requirements in the system, the number of
1. http://simgrid.gforge.inria.fr/simgrid/3.12/doc/tracing.html
migrations, the number of times the scheduler has been invoked and the number of times it succeeds or fails to resolve non-viable configurations. Additionally, the TRACE API allows one to create and track custom variables (met-rics) to satisfy their particular use case. For example, in Section 7, in order to measure the effects of consolidation we create a variable NB_ON that stores the number of hosts that are turned on at any point during the simulation.
5
D
YNAMICVMPP A
LGORITHMSTo illustrate the interest of VMPlaceS, we implemented three dynamic VM placement mechanisms based on Entropy [19], Snooze [16], and DVMS [30]. These implementations are using the latest version of the VMPP solver provided by the Entropy [17] project, which gives up optimality of consoli-dation in favor of scalability, by providing a “repair mode” that enables the correction of VM requirement violations. In this mode, the algorithm considers that a host is overloaded when the VMs try to consume more than 100% of the CPU capacity of the host. In such a case, the algorithm looks for an optimal viable configuration until it reaches a predefined timeout. The optimal solution is a new placement that satisfies the requirements of all VMs while minimizing the reconfiguration cost. Once the timeout has been triggered, the algorithm returns the best solution among the ones it found and applies the associated reconfiguration plan by mean of live migrations.
Although using the Entropy VMPP solver implies a modification from the original Snooze proposal, we high-light that our goal is to illustrate the capabilities of VM-PlaceS and thus we believe this modification is acceptable as it does not change the general behavior of Snooze and as it does not impact properties of its hierarchical scheduling algorithm. Moreover by conducting such a comparison, we also investigate the pros and cons of the three architecture models on which these proposals rely on (i.e., centralized, hierarchical and distributed).
Before discussing the simulation results, we give an overview of the three systems that have been implemented. The extended abstractions for hosts (XHost) and VMs (XVM) as well as the available functions of the SimGrid MSG API enabled us to develop them naturally in a straightforward manner.
5.1 Entropy-based Centralized Approach
The centralized VM placement mechanism consists in one single SimGrid process deployed on a service node. This process implements a simple loop that iteratively checks the viability of the current configuration by invoking every p seconds the aforementioned VMPP solver. p is defined as an input parameter of the simulation.
As the Entropy proposal does not provide a specific mechanism for the collection of resource usage information but simply uses an external tool (namely Ganglia), there was two different ways to implement the monitoring process: either by implementing additional asynchronous transmis-sions, just like a real implementation of the necessary state updates would proceed or, in a much more lightweight manner, through direct accesses by the aforementioned pro-cess to the states of the hosts and their respective VMs.
While the latter differs from a real implementation, it can be harnessed to yield a valid simulation: overheads induced by communication in the “real” implementation, for instance, can be easily added as part of the lightweight simulation. We have implemented this lightweight variant for the mon-itoring
As to fault tolerance, similarly to the Entropy proposal, our implementation does not provide any failover mecha-nism.
Finally, as mentioned in Section 4.4 we monitor, for each iteration, whether the VMPP solver succeeds or fails. In case of success, VMPlaceS records the number of migrations that have been performed, the time it took to apply the reconfiguration plan and whether the reconfiguration led to new violations.
5.2 Snooze-based Hierarchical Approach
We now present Snooze [16] as a second case study of how to implement and simulate advanced algorithms. We present its architecture summarizing its main characteristics from its original presentation [16] and additional informa-tion stemming from personal communicainforma-tions of the Snooze developers and its implementation [5], [35].
The use of such a hierarchical approach is currently discussed in the context of the cell concept in OpenStack and is generally of interest at the IaaS level (to which VMPlaces is applicable) in the context of edge infrastructures.
5.2.1 Architecture
Snooze harnesses a hierarchical architecture in order to support load balancing and fault tolerance, cf. Figure 3.
Fig. 3. Overview of Snooze’s architecture (from [16])
At the top of the hierarchy, a group leader (GL) centralizes information about the whole cluster using summary data provided by the group managers (GMs) that constitute the intermediate layer of the hierarchy. GMs manage a number of local controllers (LCs) that, in turn, manage the VMs assigned to nodes. The GL and the GMs are deployed on service nodes while the LCs are executed on hosting nodes. We have used the Entropy placement engine in order to place VMs on local controllers; note that we could have used another local placement strategy because it does not impact the properties of hierarchical scheduling that we are interested in. During execution, higher-level components
periodically send heartbeats to lower-level ones; monitor-ing information, e.g., about the system load, is also sent periodically in the opposite direction. In order to propagate information down the hierarchy, Snooze relies on hardware support for multicast communication. Finally, a number of replicated entry points allows clients to contact the GL, e.g., in order to submit new VMs for integration into the system. The XHost, XVM and SimulatorManager classes have been harnessed to implement the core architectural ab-stractions (i.e., VM monitoring and manipulations); the remaining concepts and algorithms of Snooze have been implemented using SimGrid primitives and standard Java mechanisms. Communication between Snooze actors is implemented based on SimGrid primitives for —mainly asynchronous— event handling. Hardware supported mul-ticast communication that is used, e.g., to relay heartbeats, is implemented as a dedicated actor that manages a state representing GL and GM heartbeat groups and relaying heartbeat events. Finally, our Snooze simulation uses, as its original counterpart, a multi-threaded implementation (i.e., based on multiple SimGrid processes) in order to optimize reactivity even for large groups of LCs (or GMs) that have to be managed by one GM (or GL).
5.2.2 Algorithms
Apart from the handling of faults (described below), two types of algorithms are of major importance for the adminis-tration of the Snooze architecture: the algorithms that enable components to dynamically enter the system and the ones that propagate information between the components.
A GL is created, if it does not exist, by promotion of a GM that is selected through some leader election algorithm (e.g., implemented using Apache ZooKeeper). When a GM joins a cluster, it starts listening on a predefined channel for the heartbeat of the GL and registers once it has received the heartbeat. New LCs first also wait for the GL heartbeat, contact the GL in order to obtain a GM assignment (not shown in Figure 3), and finally register at the GM assigned to them.
Two kinds of (load) information are passed within the system: first, periodic heartbeat messages sent by the GL and the GMs; second, periodic load information sent from LCs to their respective GMs and summary load information sent by the GMs to the GL.
5.2.3 Fault tolerance
GLs, GMs and LCs may fail during the execution. System components identify that a node on the corresponding higher-level node has failed in an asynchronous fashion by using a timeout mechanism (through the absence of heartbeat messages). Note that a general notion of fault tolerance including VM image management is beyond the scope of this paper and constitutes future work.
In the case of a GL failure, one of the GMs becomes the new GL, stops its GM activities and informs the LCs it manages so that they can start rejoining the system. If a GM fails, the GL and the LCs it was managing will become aware of it (based on the absence of heartbeats), update their data structures and, for the LCs, rejoin the system. If an LC fails, its GM will eventually learn it due to the missing heartbeat and remove it from its data structures.
i (a) l i i (b) l l i i (c) i l
Partition related to the processing of a first event Partition related to the processing of a second event Worker node Initiator of an event Leader of a partition (d) Legend Fig. 4. Processing two events simultaneously (from [30])
5.3 DVMS-based Distributed Approach
As the third use-case, we have implemented the DVMS (Distributed Virtual Machine Scheduler) proposal for the co-operative and fully distributed placement of VMs [30]. 5.3.1 Architecture
A DVMS agent is deployed on each node in order to manage the VMs it is hosting and collaborate with other DVMS agents of neighboring nodes. Agents are defined on top of an overlay communication network, which defines the node-neighbor relation and can be structured (using, e.g., Chord [34]) or unstructured. For this study, we have implemented a simple but effective unstructured overlay that enables agents to collaborate without any side effect: when necessary, e.g., in case of node failures, the overlay provides nodes with a link to a neighbor.
When a server is overloaded, an Iterative Scheduling Procedure (ISP) is started: a partition initially containing only the overloaded node is created; the partition then grows by including free nodes until the resource requirements can be satisfied by a VM reconfiguration. This way, resource conflicts that appear at many different nodes can be handled in parallel using different partitions.
Each partition includes two special nodes, the initiator and the leader. The initial node (i.e., the overloaded node) is the initiator of a partition. The leader of a partition is the last added node in the partition: it manages the scheduling computations necessary to resolve the overload resource conflict. If a valid reconfiguration plan cannot be computed, a new node is inserted in the partition and becomes the new leader of the partition.
5.3.2 Iterative Scheduling Procedure
When a node Ni detects that it cannot provide enough
resources for its hosted VMs, it initiates a partition and reserves itself to solve the problem (see Figure 4(a)). Then, its closest neighbor, as defined by the network overlay, is contacted to continue the ISP process.
If its neighbor Ni+1, is already part of another partition,
the neighbor of the neighbor is considered. Otherwise, Ni+1
joins the partition (see Figure 4(b)). If the partition is not valid anymore (e.g., because the workload of the VMs in
the partition has decreased), Ni+1 cancels the reservations,
destroys the partition and its nodes become available for another potential ISP process. On the contrary, if the pro-cedure is still valid, Ni+1 notifies members of the partition
that it has become the new leader. The other nodes then send it information about their capacity and current load. The leader, in turn, starts a scheduling computation looking for a valid reconfiguration within the current partition. If no solution is found, the same algorithm is applied to the next node Ni+2. In the worst case, a partition may grow
until all resources in a cluster contribute to the resolution of its resource scheduling problem. This approach harnesses as few nodes as possible, thus accelerating the scheduling computations to the maximum possible.
5.3.3 Fault-tolerance
The main advantage of using overlay networks is that they have built-in fault tolerance mechanisms. DVMS therefore works on top of an overlay network such as Chord: when a node needs to rebalance its VMs workload, it uses the overlay network to find collaborators. For this study we implemented a simple overlay network as a flat list of agents: a typical request for collaborators includes the list of agents that are already collaborating with the requesting agent. A link to a new collaborator is then provided to the requesting agent. Communication is performed by exchang-ing messages containexchang-ing immutable data: our implementa-tion harnesses the principles of the actor model in order to ease the handling of concurrency and distributed issues.
Harnessing the fault tolerance mechanisms of the un-derlying overlay network is, however, not sufficient. If the leader of a partition crashes, a new leader must take over in order for the resource problem to be solved and the nodes of a partition to be finally freed. To avoid these issues, DVMS now relies on timeout mechanisms. Each node of a partition periodically checks whether the state of its partition changed recently (e.g., if a new node joined the partition) and can thus identify if the partition leader is not active anymore. In this case, each node leaves the partition and can be integrated in other partitions.
6
D
YNAMICVMPP U
SE-C
ASEIn this section, we discuss the results of the simulations we performed on the Entropy, Snooze and DVMS strategies. First, we present a general study analyzing the violation times, the duration of the computation and reconfiguration phases and the number of migrations performed for the standard implementations (a.k.a. vanilla code). Second, we examine some variants and improvements of Snooze and DVMS that VMPlaceS allowed us to study. We highlight that the accuracy of the results have been validated in our previous work [26].
6.1 Entropy, Snooze and DVMS (Vanilla Code)
6.1.1 Experimental Conditions
All simulations have been performed on the Grid’5000 testbed [6]. Grid’5000 provides researchers in distributed computing with bare metal servers. Grid’5000 users can reserve servers for a given period of time during which they can deploy a customized environment (i.e., an image
of a Linux operating system that has been customized with every software libraries needed to run the experimen-tation). Users get exclusive and administrative access to the resources, effectively isolating their experiments from other workloads. For our evaluations, all simulations were running on a dedicated server, enabling us to avoid inter-ferences between simulations and ensuring reproducibility between different runs of a same simulation. We also em-phasize that as each single simulation was running on a dedicated server, no communication between servers was required. As the only dependency for running the simula-tions is Simgrid, and as Simgrid is a deterministic simulation environment, running the simulation on any other platform would give the same trends.
VMPlaceS has been configured in order to simulate an homogeneous infrastructure of physical machines (PMs) composed of 8 cores, 32 GB of RAM and 1 Gpbs Eth-ernet NIC. To enable fair comparisons between the three strategies, the scheduling resolver only considered 7 cores (i.e., one was devoted to run the Snooze GL or the DVMS processes). Dedicating one core for the host OS and other administrative processes is common practice and, as we believe, acceptable as part of our experimental methodology. We conducted simulations in order to study infrastruc-tures composed of 128, 256, 512, 1024 PMs, each hosting 10 VMs. Additional simulated PMs have been provided to execute the Entropy and Snooze services on distinct nodes. For Snooze, one GM has been created for every 32 LCs (i.e., PMs). Entropy and Snooze are invoked every 30 seconds. Finally, it is noteworthy that no service node had to be provisioned for DVMS as a DVMS process is executed directly on top of the hosting nodes.
In order to cope with real data center conditions, we defined the parameters for node crashes to simulate a fault on average every 6 months for a duration of 300 seconds. These values correspond to the Mean Time To Failure and the Mean Time To Repair of a Google data center server [8, pp. 107-108]. We underline that at the scale we performed our simulations such a crash ratio was not sufficient to impact the behavior of the scheduling policies. Dedicated simulations were mandatory to study the influence of node crashes with a higher failure rate (see Section 6.2.3)
Regarding the virtual machines, ten VMs have been initially launched on each simulated PM. Each VM has been created as one of the 8 VM predefined classes. The following parameters have been used: 1 (core) - 1 GB (RAM) - 1 Gbps (network bandwidth) - 1 Gbps (migration bandwidth) - X (memory update speed), where the memory update speed X was a value between 0% and 80% of the migration bandwidth in steps of 10%. Starting from 0%, the load of each VM varied according to the exponential and the Gaussian distributions as described in Sec. 4.2. The parameters of the distribution have been chosen in a way that it generates a significant number of violations, concretely, λ = No. VMs/300 and µ= 60, σ = 20. The load of each VM varied on average every 5 min in steps of 10 (with a significant part between 40% and 80%). The stationary state was reached after 20 min of simulated time with a global load of 85% as depicted in Figure 5(a). To accelerate the simulations, we have chosen to limit the simulated time to 1,800 seconds. This result is rather satisfactory as it can
Infrastructure Size Algorithm
Centralized Hierarchical Distributed
128 nodes 23.30 ± 15.64 22.62 ± 15.27 9.47 ± 2.49
256 nodes 39.06 ± 26.89 24.03 ± 15.30 9.49 ± 2.28
512 nodes 60.67 ± 49.66 25.45 ± 25.18 9.56 ± 2.62
1024 nodes 87.62 ± 90.67 29.31 ± 35.55 9.67 ± 2.37
TABLE 1
Duration of violations in seconds (M ed ± σ)
explain why most production data centers target such an overall utilization rate.2
All configuration files used to perform the discussed simulations are available on the VMPlaceS repository.3
6.1.2 General Analysis
Figure 5(b) presents the cumulated violation time for each placement policy while Tables 1, 2 and 3 give more details by presenting the mean and the standard deviations of the duration of, respectively, the violations, the computation and reconfiguration phases. As anticipated, the centralized approach did not scale and became almost counterproduc-tive for the largest scenario in comparison to a system that did not use any dynamic scheduling strategy. The more nodes Entropy has to monitor, the less efficient it is on both the computation and reconfiguration phases. Regarding the computation, the VMPP is a NP-Hard problem and thus it is not surprising that it takes more time to resolve larger prob-lems. Regarding the reconfiguration, as Entropy has to solve much more violations simultaneously, the reconfiguration plan is more complex for large scenarios, including several migrations coming from and going to the same set of nodes. Such reconfiguration plans are non optimal as they increase the bottleneck effects at the network level of each involved PM. Such a simulated result is valuable as it confirms that reconfiguration plans should avoid such manipulations as much as possible.
Regarding Snooze, which performs better than Entropy, we may erroneously conclude that the hierarchical approach is not competitive compared to the distribued strategy at first sight. However, diving into details, we can see that both the computation and reconfiguration phases are almost of constant duration (around 3 and 10 seconds respectively)
2. http://www.cloudscaling.com/blog/cloud-computing/ amazons-ec2-generating-220m-annually/ 3. http://beyondtheclouds.github.io/VMPlaceS/ 0 1000 0% 20% 40% 60% 80% 100% 85% Time (s) Load (%) load 1000 0 Time (s) 0% 20% 40% 60% 80% 100% Load (%)
(a) Infrastructure load
128 nodes 1280 vms Infrastructure sizes 0 10000 20000 30000 40000 Time (s) ● ● ● ● 128 nodes 1280 vms 256 nodes 2560 vms 512 nodes 5120 vms 1024 nodes 10240 vms 0 10000 20000 30000 40000 ● ● ● ● Infrastructure sizes Time (s) ● ● Centralized Distributed Hierarchical Without scheduling 256 nodes 2560 vms 512 nodes 5120 vms 1024 nodes 10240 vms
(b) Cumulated Violation Time Fig. 5. Simulation Results - 10 VMs/PMs (VM load:µ = 60andσ = 20)
Infrastructure Size Algorithm
Centralized Hierarchical Distributed
128 nodes 5.01 ± 8.38 2.70 ± 4.86 0.03 ± 0.02
256 nodes 10.08 ± 16.96 3.32 ± 5.28 0.02 ± 0.02
512 nodes 16.41 ± 29.32 2.86 ± 4.92 0.01 ± 0.01
1024 nodes 27.60 ± 52.99 3.35 ± 5.28 0.01 ± 0.02
TABLE 2
Duration of computations in seconds (M ed ± σ)
Infrastructure Size Algorithm
Centralized Hierarchical Distributed
128 nodes 10.44 ± 1.95 10.02 ± 0.14 10.01 ± 0.10
256 nodes 11.10 ± 2.95 10.16 ± 1.22 10.00 ± 0.00
512 nodes 12.22 ± 5.26 10.15 ± 1.19 10.01 ± 0.12
1024 nodes 20.64 ± 9.87 10.22 ± 1.33 10.03 ± 0.41
TABLE 3
Duration of reconfigurations in seconds (M ed ± σ).
and not much longer than the corresponding phases for DVMS, especially for the reconfiguration phase, which is predominant. These results can be easily explained: the centralized policy adresses the VMPP by considering all nodes at each invocation, while the hierarchical and the distributed algorithms divide the VMPP into sub problems, considering smaller numbers of nodes (32 PMs in Snooze and 4 nodes on average with DVMS). These results raise the question of the influence of the group size, i.e., the ratio of LCs attached to one GM, on Snooze’s performance (a relationship we investigate in Section 6.2).
Last but not least, Table 4 presents the number of mi-grations that have been performed during each simulation. At a size of 128 nodes, the hierarchical and distributed strategies perform fewer migrations than the centralized strategy. However, as the size of the infrastructure increases, the number of migrations performed by the distributed and hierarchical strategies rise much faster than the cen-tralized strategy. This observation is explained by the fact that the distributed and hierarchical strategies can absorb the additional workload, while the centralized strategy is overloaded.
This metric is important : in addition to adding a significant overhead at the network level, migrations can negatively impact the performance of the workload running inside the VM. Hence, it is usually better to try to find the right trade-off between the reactivity criterion and the number of VM migrations like investigated by other VM placement strategies [15]. Diving into the details, VMPlaceS monitors how many times each VM has been migrated. This feature is also interesting as several schedulers, including the ones discussed in the present article, do not consider whether a VM has been previously migrated or not. Hence, it is possible to migrate the same VM a significant number of times while never relocating the others. VMPlaceS enables researchers to monitor such a metric.
Overall VMPlaceS enabled us to determine that DVMS possesses the best scalability properties, notably in terms of the duration of computations and violations, followed by Snooze. However, the number of migrations that is performed by DVMS can be an important drawback for the adoption of such dynamic strategies. Entropy is clearly the least scalable approach: due to the time it requires to
Infrastructure Size Algorithm
Centralized Hierarchical Distributed
128 nodes 103 70 93 256 nodes 135 164 194 512 nodes 163 267 344 1024 nodes 266 651 842 TABLE 4 Number of migrations.
compute and apply new scheduling decisions, it performs much less reconfigurations (and thus migration operations).
6.2 Exploring Variants and Possible Improvements
In the following, we present several variants of the algo-rithms introduced in Section 5 that have been discussed in the literature or come up during the implementation of their models using VMPlaceS. This section provides strong evidence that the modification and evaluation of existing al-gorithms are much facilitated by our simulation framework. 6.2.1 Varying group sizes
As a first example, we propose to clarify the influence of the group size observed during the general comparison. Concretely, we performed additional simulations aiming at investigating whether a smaller group size for Snooze can lead to performances similar to DVMS and reciprocally, whether DVMS can increase its reactivity by integrating more nodes at the first iteration of each ISP. We highlight that the use of VMPlaceS eased this study as it consisted in simply relaunching the previous simulation with a distinct assignment for Snooze and in slightly modifying the ISP algorithm for DVMS.
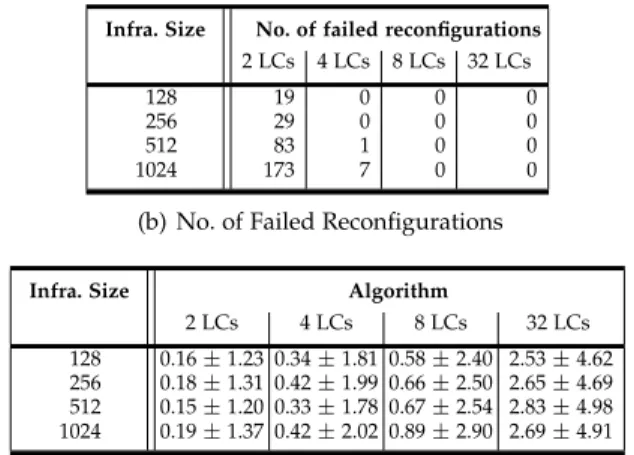
Figure 6 presents the simulated values obtained for the Snooze scenarios with 2, 4, 8 and 32 LCs per GM for four infrastructure sizes; note that Snooze ensures that groups are of essentially the same size by dynamically balancing LCs between GMs based on the load of each GM. The over-all performance (i.e., cumulated violation time) shown in Figure 6(a), shows that 2 LCs per GM result in significantly higher violation times. All other group sizes yield violation times that are relatively close, which indicates that a small group size does not help much in resolving violations faster. The relatively bad performance of the smallest group size can be explained in terms of the number of failures of the reconfiguration process, that is, overloading situations that are discovered but cannot be resolved because the GM managing the overloaded VM(s) did not have enough resources, see Table 6(b). Groups of 2 LCs per GM are clearly insufficient at our load level (60% mean, 20% stddev). Failed reconfigurations are, however, already very rare in the case of 4 LCs per GM and do not occur at all for 8 and 32 LCs per GM. This is understandable because the load is statistically evenly distributed among the LCs and the load profile we evaluated only rarely results in many LCs of a GM to be overloaded. Violations can therefore be resolved even in the case of a smaller number (4) LCs available for load distribution.
Conversely, we can see that the duration of the overall reconfiguration phases decreases strongly along with the group size. It reaches a value close to the computation times
● ● ● ● 128 nodes 1280 vms 256 nodes 2560 vms 512 nodes 5120 vms 1024 nodes 10240 vms 0 5000 10000 15000 20000 25000 ● ● ● ●
Cumulated violation time
Infrastructure sizes Time (s) ● ● periodic2LCs periodic4LCs periodic8LCs periodic32LCs ● ● ● ● 128 nodes 1280 vms 256 nodes 2560 vms 512 nodes 5120 vms 1024 nodes 10240 vms 0 5000 10000 15000 20000 25000 ● ● ● ●
Cumulated violation time
Infrastructure sizes Time (s) ● ● periodic2LCs periodic4LCs periodic8LCs periodic32LCs 128 nodes 1280 vms Infrastructure sizes 0 5000 10000 15000 20000 Time (s) 256 nodes 2560 vms 512 nodes 5120 vms 1024 nodes 10240 vms 25000
(a) Total Violation Times
Infra. Size No. of failed reconfigurations
2 LCs 4 LCs 8 LCs 32 LCs
128 19 0 0 0
256 29 0 0 0
512 83 1 0 0
1024 173 7 0 0
(b) No. of Failed Reconfigurations
Infra. Size Algorithm
2 LCs 4 LCs 8 LCs 32 LCs
128 0.16 ± 1.23 0.34 ± 1.81 0.58 ± 2.40 2.53 ± 4.62
256 0.18 ± 1.31 0.42 ± 1.99 0.66 ± 2.50 2.65 ± 4.69
512 0.15 ± 1.20 0.33 ± 1.78 0.67 ± 2.54 2.83 ± 4.98
1024 0.19 ± 1.37 0.42 ± 2.02 0.89 ± 2.90 2.69 ± 4.91
(c) Means±Std deviations of computation durations. Fig. 6. Hierarchical placement: influence of varying group sizes
of DVMS for a group size of 4-LCs per GM, see Figure 6(c). We thus cannot minimize computation times and violation times by reducing the number of LCs because larger group sizes are necessary to resolve overload situations if the VM load gets higher. Once again, this information is valuable as it will help researchers to design new algorithms favoring the automatic discovery of the optimal subset of nodes capable of solving violations under a given set of load profiles.
In contrast, DVMS resolves this trade-off by construc-tion, because of its automatic and dynamic choice of the partition size necessary to handle an overloaded situation. However, it can be interesting to directly add more than one node to form the first group, a.k.a. microcosm in the DVMS terminology, especially because having only two nodes seems to be insufficient as depicted by the previous Snooze scenarios.
Infrastructure Size
Violation time (s) No. migrations
flavour Original 4 nodes Original 4 nodes
128 nodes 9.47 ± 2.49 9.39 ± 3.08 93 106
256 nodes 9.49 ± 2.28 9.61 ± 2.35 194 182
512 nodes 9.56 ± 2.62 9.65 ± 2.62 344 315
1024 nodes 9.67 ± 2.37 9.95 ± 2.41 842 802
TABLE 5
Comparison of two DVMS flavours.
Table 5 presents the violation time and the number of migrations for the DVMS vanilla implementation and our variant that directly integrates four nodes at the first step of the ISP. In addition to having a similar violation time, it is noticeable that the number of migrations is slightly smaller in the DVMS variant for most cases (understanding why the 128 nodes leads to more migrations and a larger deviation requires more investigations). This gain in terms of migrations is due to the quality of reconfiguration plans: as more nodes can be used to rebalance the VMs workload, its efficiency is improved.
6.2.2 Hierarchical Scheduling: Periodic vs. Reactive Our vanilla implementation of Snooze [16] schedules VMs in a periodic fashion. Using VMPlaceS, we have also de-veloped and evaluated an alternative, reactive, strategy to scheduling: as soon as resource conflicts occur, LCs signals their GMs; the GMs then immediately initiate scheduling.
Using our framework, this reactive scheme can be imple-mented in two manners. First, by implementing additional asynchronous communication of the necessary state updates as a real implementation would proceed. Second, in a more lightweight manner through direct accesses by the GMs to the states of their respective LCs. In order to ensure that this lightweight implementation mimics a real implementation closely, delays induced by communication in the “real” implementation are accounted for explicitly (congestion is-sues are not relevant in this case because notification of a resource conflict implies little communication and conflict resolution blocks the GM and its LCs anyway). We have implemented this lightweight variant of reactive scheduling including an explicit model of communication delays. Using the VMPlaceS abstractions, reactive scheduling has been implemented by adding or modifying just 4 lines of code of the variant with periodic scheduling.
Infrastructure Size
Violation time (s) No. migrations
period 30 reactive period 30 reactive
128 nodes 20.92 ± 13.02 10.24 ± 4.48 62 107
256 nodes 23.33 ± 14.47 10.02 ± 3.32 124 201
512 nodes 23.57 ± 20.19 10.62 ± 7.21 269 421
TABLE 6
Snooze periodic vs. Snooze reactive.
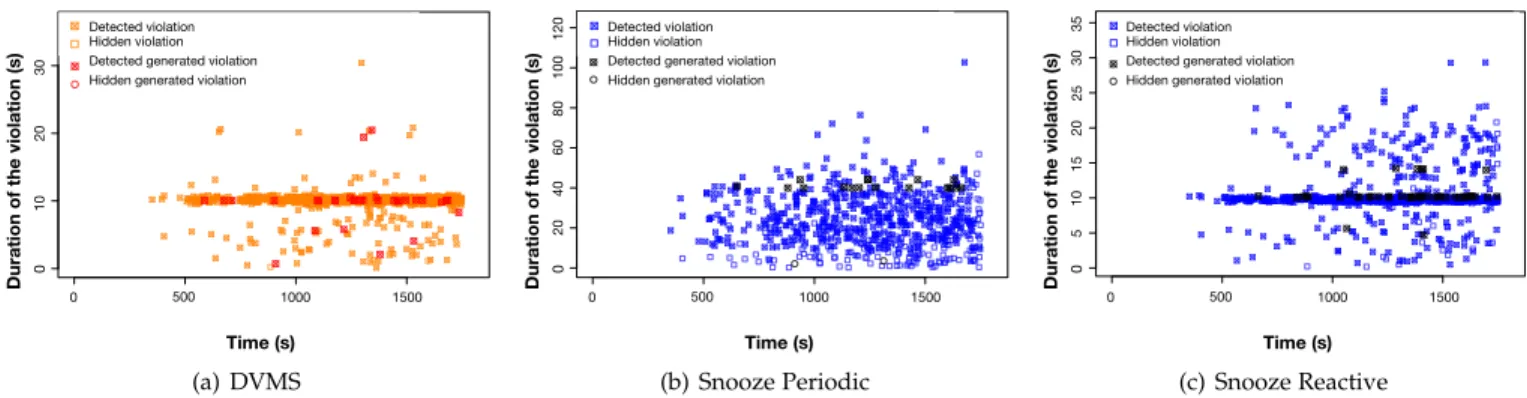
We have simulated a reactive scheduling algorithm and a periodic scheduling algorithm for configurations ranging from 128 to 1024 LCs. In each case the Entropy scheduler has been applied to groups of 8 LCs per GM, the variant of hierarchical scheduling that performs most efficiently and closely matches the efficiency of DVMS, see Section 6.2.1. These simulations have yielded the results shown in Table 6 and in Figure 7 for the largest test (Figure 7 being an output of the trace analysis module of VMPlaceS). They clearly show that, while a reactive strategy entails a much higher number of migrations (because the periodic one aggregates overload situations and misses some of them), reactive scheduling results in a significantly lower total violation time.
6.2.3 Analysis of Fault Tolerance Property
We now present how the fault tolerance properties of our placement strategies can be evaluated using VMPlaceS. Due
Time (s)
0
10
Duration of the violation (s)
0 20 30 0 500 1000 1500 0 10 20 30 Time (s) Dur
ation of the violation (s)
Distributed violation detected Distributed violation hidden
Distributed violation out detected Distributed violation out hidden
500 1000 1500 0 500 1000 1500 0 10 20 30 Time (s) Dur
ation of the violation (s)
Distributed violation detected Distributed violation hidden
Distributed violation out detected Distributed violation out hidden
0 500 1000 1500 0 10 20 30 Time (s) Dur
ation of the violation (s)
Distributed violation detected Distributed violation hidden
Distributed violation out detected Distributed violation out hidden
Detected violation Hidden violation Detected generated violation Hidden generated violation
(a) DVMS
Time (s)
0
20
Duration of the violation (s)
0 60 100 500 1000 1500 0 500 1000 1500 0 20 40 60 80 100 120 Time (s) Dur
ation of the violation (s)
Hierarchical violation detected Hierarchical violation hidden
Hierarchical violation out detected Hierarchical violation out hidden
0 500 1000 1500 0 20 40 60 80 100 120 Time (s) Dur
ation of the violation (s)
Hierarchical violation detected Hierarchical violation hidden
Hierarchical violation out detected Hierarchical violation out hidden
0 500 1000 1500 0 20 40 60 80 100 120 Time (s) Dur
ation of the violation (s)
Hierarchical violation detected Hierarchical violation hidden
Hierarchical violation out detected Hierarchical violation out hidden
40
80
120 Detected violationHidden violation
Detected generated violation Hidden generated violation
(b) Snooze Periodic
Time (s)
0
5
Duration of the violation (s)
0 15 25 500 1000 1500 10 20 30 0 500 1000 1500 0 5 10 15 20 25 30 35 Time (s) Dur
ation of the violation (s)
Hierarchicalbestfit violation detected Hierarchicalbestfit violation hidden
Hierarchicalbestfit violation out detected Hierarchicalbestfit violation out hidden
35 0 500 1000 1500 0 5 10 15 20 25 30 35 Time (s) Dur
ation of the violation (s)
Hierarchicalbestfit violation detected Hierarchicalbestfit violation hidden
Hierarchicalbestfit violation out detected Hierarchicalbestfit violation out hidden
0 500 1000 1500 0 5 10 15 20 25 30 35 Time (s) Dur
ation of the violation (s)
Hierarchicalbestfit violation detected Hierarchicalbestfit violation hidden
Hierarchicalbestfit violation out detected Hierarchicalbestfit violation out hidden
Detected violation Hidden violation Detected generated violation Hidden generated violation
(c) Snooze Reactive
Fig. 7. Details of violations (another view of the results collected by VMPlaceS) - 1024 PMs/10K VMs - Detected/Hidden: violations that have been considered, and respectively, not considered by the scheduler - Generated: violations that have been generated by a reconfiguration.
to space limitations, we only detail the analysis of Snooze. To the best of our knowledge, this is the first analysis of such properties for a placement strategy `a la Snooze.
In the case of Entropy, although the loss of the service node can be critical, its failure probability is so small that the single point of failure issue can be easily solved by a fail-over approach. Regarding DVMS, the crash of one node does not have any impact on the resolution as the composition of the microcosms is reevaluated immediately.
We leverage the possibility offered by VMPlaceS to de-terministically inject faults during a simulation (see Sec-tion 4) and we run two simulaSec-tions (one with no faults and another one with injected server faults). During both runs, we measure and observe the GM size (in terms of LCs) during reconfiguration and violation times. For the first run, we have 32 LCs per GM and periodic calls every 30s to the centralized solver. The second run is similar except we inject the following numbers of GM faults: 10 GM faults for 256 LCs/8 GMs, 20 GM faults for 512 LCs/16 GMs, and 40 GM faults for 1,024 LCs/32 GMs. This important fault rate allows us to study how Snooze performs under heavy stress, with numbers of faults much higher than what is expected in an actual data center.
●
●
●
256 nodes 512 nodes 1024 nodes
● ● ● ● ● faults period30 ● ● ● per iod30 faults period30 ● ● faults period30 Infrastructure sizes 0 10 20 30 40 Time (s) 256 nodes 2560 vms 512 nodes 5120 vms 1024 nodes 10240 vms (a) GM Size (#LCs) Infrastructure sizes 0 5000 10000 Time (s) 256 nodes 2560 vms 512 nodes 5120 vms 1024 nodes 10240 vms ● ● ● 256 nodes 2560 vms 512 nodes 5120 vms 1024 nodes 10240 vms 0 5000 10000 15000 20000 25000 ● ● ● Infrastructure sizes Time (s) ● ● faults period30 15000 20000 25000
(b) Cumulated Violation Time Fig. 8. Behavior in the presence of faults
Figure 8 plots the two metrics introduced above for the standard (non-faulty) and faulty executions: the average GM sizes during reconfigurations (left) and the violation times (right). The results show that the average GM sizes are moderately affected by faults: 32 LCs in the case of non-faulty executions, 39–46 LCs in the case of the faulty executions. However, the violation times are rather strongly affected: 3,453–18,998s for the non-faulty executions, 7,284–
28,636s in the presence of faults. This is very probably the case because the faults disturb on-going and future resolution actions that are triggered by violations.
However, the heartbeat-based strategy of Snooze enables the reconstruction of the hierarchy in a relatively short time and thus crashes on service nodes moderately impact the resolution of violations even in the case of high failure rates.
6.3 VMPlaceS Scalability
As highlighted in the introduction, being able to get in-dications regarding how placement algorithms behave at large scale is critical. Although the simulations that have been discussed are limited to 10K VMs, we succeeded to conduct DVMS and Snooze simulations at higher scale (per-forming large-scale experiments for Entropy was useless as its limitations in terms of scalability were already visible at the lower scale). For DVMS, we performed simulations including up to 8K PMs/80K VMs in a bit less than two days. Similarly, we achieved DVMS simulations for 10K VMs over a simulated period of 7,200 seconds (i.e., two hours). The duration to get the results was a bit more than 4 hours. Those values give a first idea of the scalability of VMPlaceS. In other words, it gives a first answer to the question: “what is the maximal size of the infrastructure VMPlaceS can simulate?”. It is noteworthy to underline that the time to simulate a large infrastructure is strongly dependent on the VM placement strategy researchers in-vestigate. For instance, conducting similar experiments for the hierarchical approach a la Snooze is much more time consuming. Actually, it was not possible to run a sufficient number of simulations at the 8K PMs/80K VMs scale. The Snooze protocol being more complex than the DVMS one (heartbeats, consensus, . . . ), the time to perform a similar experiment is much higher (around 7 days for the 80K VMs experiment). The time-consuming portions of the code are related to SimGrid internals such as sleep and send/recv calls. We are investigating these aspects with the SimGrid core developers with the goal of reducing the required time to perform such advanced simulations. However, we know that simulating all interactions of advanced algorithms is expensive because the simulator engine should care about all actions. We therefore underline that it might be required for certain algorithms to sacrifice accuracy of the imple-mentation in order to be able to perform simulations in an acceptable amount of time.
7
E
NERGYE
FFICIENCYU
SE-C
ASEBecause energy consumption of modern data centers has been one of the main motivation for advanced placement strategy proposals, we have added support in VMPlaceS for estimating pros and cons of placement algorithms under the perspective of the energy footprint. This new feature, developed using the latest extensions of SimGrid, allows VMPlaceS to automatically collect the energy consumption of the simulated infrastructure. VMPlaceS end-users enable it by initializing one or more p-states in the SimGrid plat-form file, matching the power consumption characteristics of the hosts composing the infrastructure. Thanks to this information, SimGrid then estimates the power consumed by a host proportionally to its current CPU load (in our case, to the effective usage of the VMs it is hosting). The energy consumption is fed to the TRACE module of SimGrid like any other metric, allowing easy post-mortem analysis.
To illustrate the relevance of this feature, we discuss in this section a first comparison between Entropy (see Section 5.1) and First Fit Decreased [24] (FFD), that we implemented for this purpose. Unlike the “repair mode” of Entropy, FFD favors consolidation (i.e., it tries to place the VMs on the fewer possible nodes) and allows some hosts to be freed of VMs and turned off when the overall load is sufficiently low. Due to space limit we do not compare the energy consumption of the hierarchical and distributed strategies which is of limited interest since they do not support energy consolidation. After giving a short overview of our implementation of the FFD algorithm, we discuss the experimental results we collected.
7.1 The FFD Algorithm
This centralized algorithm implements the classical First Fit Decreased heuristic for the bin packing problem. Like Entropy, it requires only a single process deployed on a service node, and it is invoked every p seconds.
This process first loops through all the hosts in order to construct a sorted list of overloaded hosts (the bins). In a second phase, it loops through the overloaded hosts and selects all their VMs for migration, sorted in decreasing order of CPU (higher priority) and RAM (lower priority) demands. This list of to-be-migrated VMs contains the items to pack and is also sorted in decreasing order. During the third phase, the process loops through the list of VMs to iteratively migrate, placing the largest one on the first host available. Further, we avoid unnecessary migrations by giving higher priority to the current host of the VM.
7.2 Energy Analysis
To compare our algorithms under different loads, we ran 24-hour simulations with Entropy and FFD on a cluster of 64 nodes, similar to the setup described in Section 6, except for the additional energy consumption configuration. In the cluster description, we specified that each node consumed 90W when idle, 240W under a 100% CPU load, and 10W when off, which corresponds to typical values observed of physical machines of Grid’5000. Then, for each algorithm, the simulation has been executed twice: once where all nodes were always on (legacy), and once where the sched-uler turned off nodes that were not hosting any VM after
each scheduling phase (every 30s). We created important load variations, by defining multiple periods during the simulation, each with different µ and σ values for the injector. These parameters, summarized in Table 7, mimic a low-demand period (periods 1 and 4), a base-load period (2) and a peak period (3).
# Time Mean Std. dev.
1 00:00 – 07:00 20 10
2 07:00 – 14:00 40 30
3 14:00 – 19:00 80 20
4 19:00 – 24:00 20 10
TABLE 7
Time periods and associated random law parameters for VM load generation during the 24-hour simulation.
Entropy FFD 0 50 100 150 200 Energy (KwH)
Not turning off hosts Turning off hosts No. VM migrations 0 1,000 2,000 3,000 4,000 5,000 Number of migrations 466 4731
(a) Total energy consumption (in Joules) and number of migrations.
(b) Number of live hosts during the simulation.
Fig. 9. Energy consumption, no. of migrations and live hosts for both centralized algorithms on a 64-node cluster simulated over 24 hours.
We have executed these four simulations: the cumulated energy consumption of the whole cluster is shown in Fig-ure 9(a). During this simulation, the First Fit Decreased algorithm allowed to save over 40 Kilowatt Hours of energy, which is four times more than can be saved using Entropy only, at a cost of a tenfold increase in VM migrations. It is noteworthy that the energy spent for migrating VMs is also accounted for, so from this plot we can safely conclude that FFD is significantly more energy efficient than our version of Entropy. The reason FFD performs better is because it allows more hosts to have a null load at any point in time and be turned off. This is shown in Figure 9(b) that plots the number of live hosts for both algorithms during the two simulations where hosts with null load were turned off. The plot shows that after Entropy performed a good initial placement during the first period, it has been only able to turn on more hosts when demand increases at the beginning of the second period, quickly turning on all of the 64 hosts. When the load decreases (fourth period), it was not able to consolidate and all the hosts remained on, but underloaded. On the contrary, FFD decreased the number
![Fig. 1. VM scheduling Phases (from [30])](https://thumb-eu.123doks.com/thumbv2/123doknet/11509654.294083/3.918.475.832.569.767/fig-vm-scheduling-phases-from.webp)
![Fig. 3. Overview of Snooze’s architecture (from [16])](https://thumb-eu.123doks.com/thumbv2/123doknet/11509654.294083/7.918.115.403.635.873/fig-overview-of-snooze-s-architecture-from.webp)