HAL Id: hal-00421813
https://hal.archives-ouvertes.fr/hal-00421813
Submitted on 3 Oct 2009
HAL is a multi-disciplinary open access archive for the deposit and dissemination of sci-entific research documents, whether they are pub-lished or not. The documents may come from teaching and research institutions in France or abroad, or from public or private research centers.
L’archive ouverte pluridisciplinaire HAL, est destinée au dépôt et à la diffusion de documents scientifiques de niveau recherche, publiés ou non, émanant des établissements d’enseignement et de recherche français ou étrangers, des laboratoires publics ou privés.
Some Considerations on the Integration of Geophysical
Data into Archaeological Research
Christophe Benech, Albert Hesse
To cite this version:
Christophe Benech, Albert Hesse. Some Considerations on the Integration of Geophysical Data into Archaeological Research. Internationale Archäologie Naturwissenshaft und Technologie. Geophysik und Ausgrabung. Einsatz und Auswertung zerstörungsfreier Prospektion in der Archäologie, Verlag Marie Leidorf GmbH, Rahden, pp.175-186, 2007, Band 6. �hal-00421813�
Some Considerations on the Integration of Geophysical Data into
Archaeological Research
Christophe Benech1 and Albert Hesse2
1. UMR 5133 Archéorient, Maison de l’Orient et de la Méditerranée, Université Lyon 2 2. UMR 7619 Sisyphe, Université Paris 6
Contact : [email protected]
Introduction
The interest of geophysical survey for archaeology needs no further justification; its use is an integral part of any broad approach to most archaeological sites. Beyond the interest of the geophysical map for the location of further excavations, the geophysical survey opens new and interesting perspectives of research, particularly in the domain of the spatial analysis of archaeological sites. However, geophysical mapping still encounters some difficulties in finding its proper place in archaeological documentation.
The aim of this paper is to present reflections concerning geophysical mapping, both as regards its intrinsic nature and the type of information which it provides for archaeological research using a multidisciplinary approach. After a short history of geophysical mapping, we discuss the complementary approach of both geophysicists and archaeologists in the context of such geophysical mapping.
History of geophysical mapping
Even if the interest of geophysical methods for archaeological research was proven long ago1, the
integration of geophysical information into archaeological documentation took longer and has of course changed with the technical development of geophysical tools. The first geophysical surveys were carried out on small areas because the output was rather slow and the maps were drawn by hand from coarse sampling data. The maps used contour lines, presented sometimes with different symbologies (colour, hatching…) for a more readable result. Most of the time, the result was not particularly “visual” and difficult for a “non-specialist” to interpret. This interpretation of the geophysical map remained the domain of the geophysicist, with the archaeologist rarely getting involved in this work. He would normally follow the conclusions of the geophysicist.
This period was marked by important research concerning the interpretation of geophysical data with the aim of obtaining a maximum of information from the measurements in regard, for example, to the nature of anomalies, the adequacy of physical measurement of contrast between the target and its surrounding material, identification of parasites and the physical properties of materials.
This research concerns of course geophysics in general but the studies dedicated more especially to the domain of archaeology has also been important. It would be too long to give an exhaustive biblio-graphy but the papers published in journals like Archaeometry, Archaeo-physika or Prospezioni Archeologiche are representative of the increasing interest of some geophysicists in this domain. The implication of geophysical study in archaeological research is still relatively limited in comparison with other methods of archaeological survey and ‘prospection’ (in particular, field or aerial surveys) and it has been used on
1 M. J. Aitken, Physics and Archaeology. Interscience Publishers Inc. (New York 1961). – A. Hesse, Prospections géophysiques à faible profondeur - Applications à l'archéologie. (Paris 1966).
small areas to determine the presence or absence of archaeological features and to locate more precisely requirements for further excavations.
At that time, the tentative surveys sought to bring new and secure information to the archaeologist rather than to check the efficiency of instruments and methods for an appropriate description of the content of the subsoil. Shape, width and amplitude of the anomalies compared with characteristics such as the nature, size and depth of the targets in relation to their environment, were a constant pre-occupation. A major expectation was also to convince the operators of the surveys as well as users of the real interest of geophysical methods by providing clearly documented examples. This last aim was obviously not established in advance!
One of the main difficulties was to find appropriate targets for these trials, that is well-known features with relatively simple shapes in convenient situations. Features left in situ in previously excavated zones for instance, were clearly inconvenient since the refilling by itself may produce an anomaly as important or even more so than the target. Features detected by aerial surveys were obviously better since they could be studied in their original, undisturbed, stratigraphic situation.
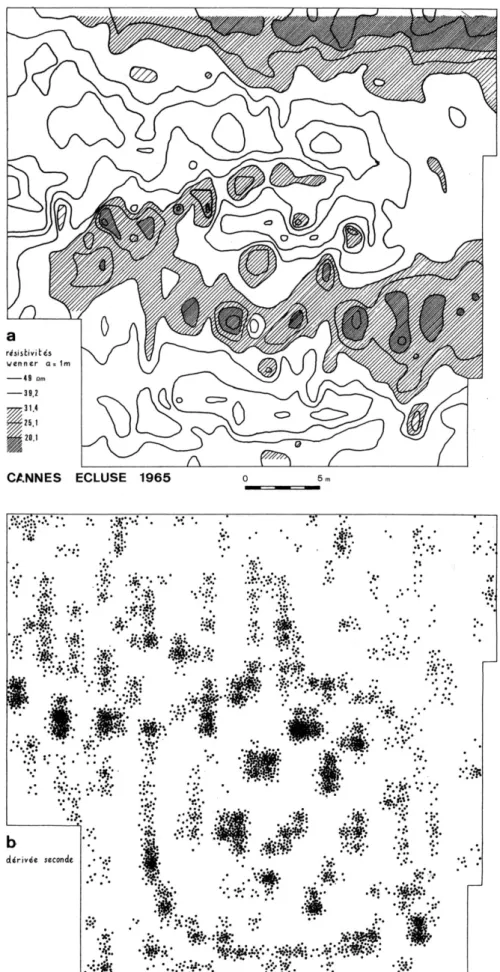
The resistivity map obtained over a Neolithic ring ditch at Cannes-Ecluse constitutes a good example of a typical operation at that time: the map is small (less than 30 x 30 m). It concerns, according to an aerial photograph, the presumed position of the feature, which normally consists of a ditch filled with earth and cut into in an alluvial subsoil of silt, sand and pebbles. The aims of the survey were, first, to locate more precisely the ditch, secondly to verify the shape and amplitude of the subsequent anomaly of resistivity (wenner, a = 1 m) which, of course, was expected to be at a minimum. Initially, the plot of the readings obtained was at first thoroughly disappointing for the operator as well as for the archaeologist since, at first glance, the ditch does not appear (fig. 1a, top). The stronger anomalies, with a large spatial wavelength, mainly showed variations of resistivity in the alluvial background with conductive fine sandy materials (hatching for resistivities under 31.4 Ω.m) and coarse gravel (in white). A careful analysis of the map, however, showed that the ditch, despite its low contrast, shows tiny minimum responses of resistivity with shorter spatial wavelengths.
Consequently, it was necessary to process the data of the geophysical map in order to enhance these small anomalies. A kind of second derivative was obtained by calculating and representing the difference between each measurement and the average of the surrounding ones. In this way a satisfactory image was obtained: on this map (fig. 1b, bottom) the ring ditch and several small filled-in pits in the shape of black spots can be clearly distinguished. It is hardly necessary to add that the drawing of isoresistant lines, as well as the calculations which involved near one thousand measurements, were made by hand, since almost no data processing technology was available at that time.
This result suggests another few comments which will be a little more developed below. First, it should be emphasised that the original map, which was initially so disappointing, objectively contains all the available information and that consequently the deduced image contains less, since it was im-poverished by losing all the information related to the geological subsoil. In this case, this has relatively little importance, but one should never a priori disregard or eliminate detail without a careful attention to this type of information.
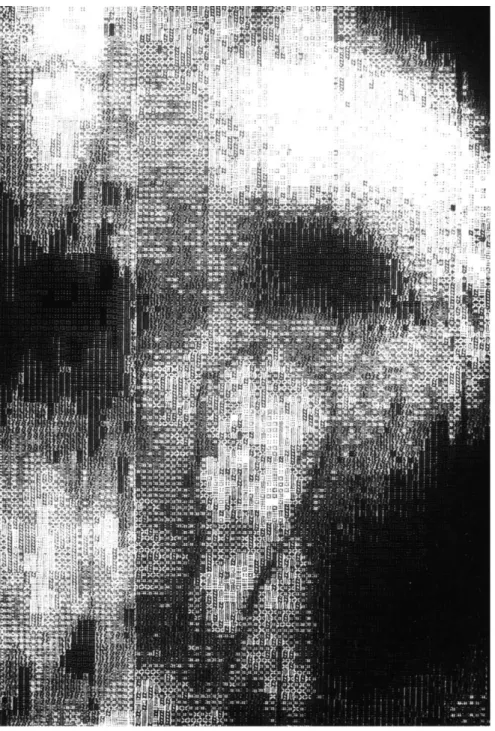
This interweaving of two types of information (archaeological and geological) together with several other forms of disturbance often occurs on resistivity maps. Magnetic surveys suffers from many other types of disturbances but are less affected by geology since the method relatively favours the anomalies of short wavelength produced by superficial features under a homogeneous ploughing layer. Another example of electrical survey, which then did not need any such specific data processing, was encountered on the first resistivity map which was realised with the prototype of the so called automatic recording system RATEAU at Balloy in 1987. The two complete Neolithic enclosures which lain under the surveyed area were clearly detected (fig. 2). The alluvial background is relatively complex with well
defined but rather large areas of low resistivity (in white) corresponding to thicker or nearer layers of fine, muddy or sandy material. The two enclosures are located on the resistant areas which normally reveal a presence of coarse sand or gravel (in grey and black). One cannot exclude the possibility that this location could correspond to a real choice of Neolithic people to settle their structures on the better drained and drier areas. Then the double information obtained by means of geophysical survey, which would be expensive, if not difficult, to get by standard excavation, is entirely archaeological since it informs us about possible cultural and technical conditions of the settlement.
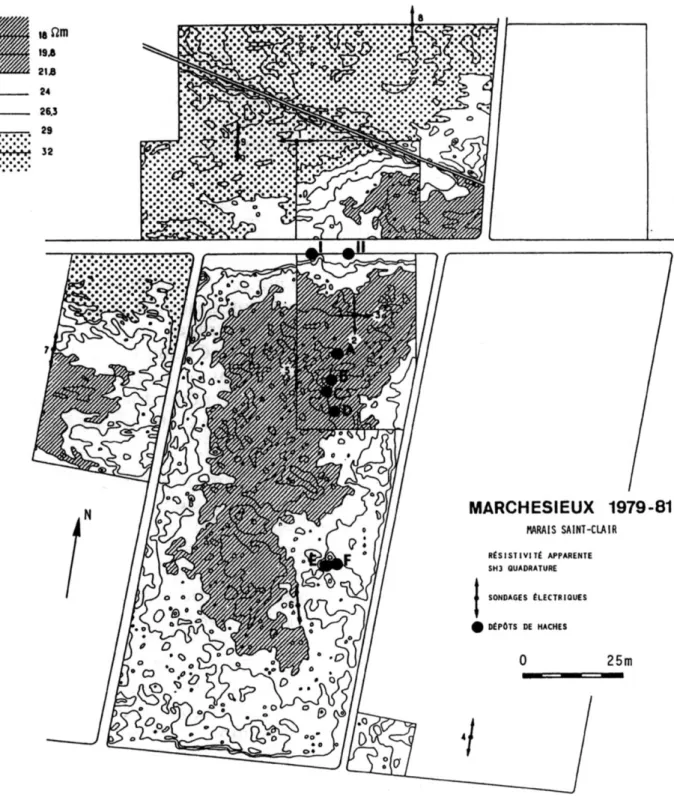
Several other situations with multiple archaeological information can exist. It is particularly the case when different instruments with different responses are used on the same ground or when a unique instrument is able alone to deliver a double reading. With the electromagnetic device SH3 designed by
Alain Tabbagh for example, at Marchésieux in 1979-812, we were able to locate, surprisingly but very
clearly, on the ‘in-phase’ map (showing responses of abnormal magnetic susceptibility), the exact po-sition of six Bronze age deposits of axes. On the ‘quadrature’ plot (using electrical conductivity) we got an excellent contour map showing resistance along the shore of the marsh in which the axes had been immersed in the ancient times. The resulting image obtained by superposition of both types of information constitutes a good example of a result combining archaeological methods (fig. 3).
From the map to the image
The research described below into geophysical apparatus has aimed to automate systems for a finer and faster survey; the developments in EDP allow us to produce faster geophysical maps and to explore different ways of representation of geophysical: gridding methods, symbol plots, dot density plots,
colour scales, 3D views and so on3. These improvements considerably changed the role of geophysics in
the strategy of archaeological surveys for the study of sites. The possibility of covering larger areas and even, in certain cases, the whole site in a minimum of time has enabled geophysical surveying to play a central role in archaeology even if, as we will see below, the quality of geophysical data may be variable. Geophysical maps are more visual and therefore more “accessible” for non-specialists; they become the document around which geophysicists and archaeologists can engage in discussion and share their impressions about interpretation. Geophysical survey has become a more interdisciplinary research. The increasing facility of use of different geophysical apparatus and ease in producing maps has opened the discipline to a wider scientific community, not originally trained as geophysicists. Recent developments in geophysics have made possible more and more impressive results: the geophysical map is a little forgotten in favour of the geophysical image.
The terms of map and image are often used in geophysics without distinction. In fact, these terms refer to two specific parts of the treatment and the interpretation of geophysical data. The basis of a geophysical survey is the cartography of different properties of the soil (in accordance with the method used): this is the geophysical map. From this cartography, the aim is to obtain an image, that of archaeological structures. This image is the “crowning achievement” of the efforts of the geophysicists. They have succeeded in obtaining a visual representation which enables them to share their results with the archaeologists. The image involved specific developments in terms of treatment and interpretation
which are opening interesting perspectives4. This type of work is more focused on visual representation,
on the pixel rather than the intrinsic nature of the geophysical data. It could not replace the joint
2
A. Tabbagh/G. Verron, Etude par prospection électromagnétique de trois sites à dépôts de l’âge du Bronze, Bulletin de la S.P.F., Etudes et travaux, no. 10-12, tome 80, 1983, 375-389.
3
For an overview see I. Scollar/A. Tabbagh/A. Hesse/I. Herzog, Archaeological Prospecting and Remote Sensing. Cambridge University Press (Cambridge 1990).
4 For example, see recently K. L. Kvamme, Integrating multidimensional geophysical data. Archaeological Prospection 13,1, 2006, 57-72.
interpretation method by method but it may be complementary, particularly concerning pattern recognition.
Is there a “final map”?
At first sight, that the final map may be considered as the one which gives the best image of archaeological features. This view would hold that the image – that is, the visual appearance of the geophysical map – is the only valuable result we can obtain from geophysical data, neglecting the in-formation from the measurement of physical properties of the soil. Moreover, we have today the possi-bility of producing a multitude of maps from the same dataset, by using different treatments or different ways of visualization for highlighting different aspects (and not only the visual one) of geophysical data. It is often difficult to present on a single map all the geophysical information which will usually requires different ways of treatment or visual representation.
A typical case is the rendering of the geometry of the detected features and of wider information usually concerning the environmental context.
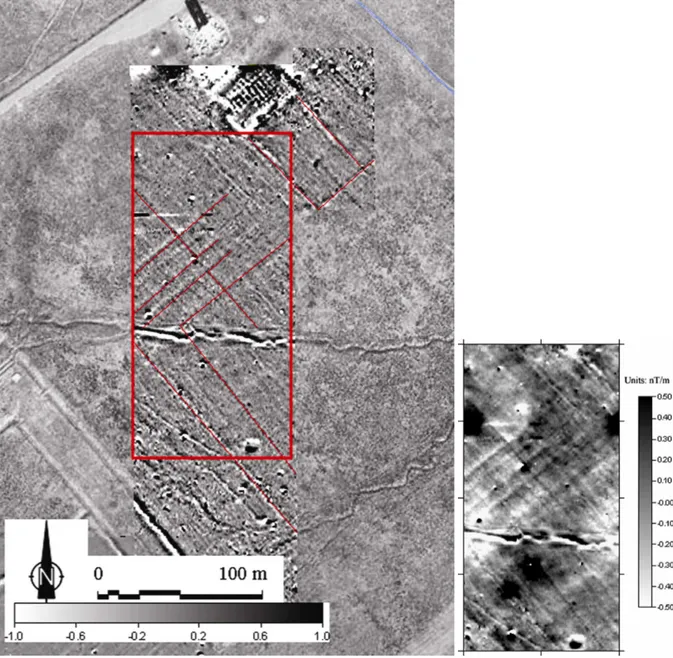
In the case of the study of the royal gardens of Pasargades5, the first magnetic map (fig. 4a and b)
shows different channels and ditches linked to the organization and the distribution of water inside the garden but it is difficult to differentiate them from the magnetic anomalies due to ploughing. An upward continuation at 0.50 m allows us to highlight a division of the space of the gardens which may correspond to different sectors; a complementary interpretation between both maps also permits identification of the ditches and links between them. The key to the interpretation is not to attempt to have a better image of the archaeological features but to connect them with more environmental information, also included in the geophysical data of the magnetic survey.
Bearing in mind that every ‘treatment’ removes information from the geophysical map, we have to consider that only the original map contains all the geophysical information and must therefore con-stitute the document of reference. From this original map, it is possible to produce an infinity of other maps, including the image of archaeological features; any of these is potentially useful, depending on the archaeological context and the problematic which has to be resolved (fig. 5).
The geophysical image in the archaeological documentation
Archaeologists are used to working with plans and images but these documents have specific and different roles in archaeological documentation. A plan enables us to locate precisely archaeological structures and to characterize and describe them geometrically. The plan can be completed by a set of symbols for distinguishing, for example, different types of material or differences in level. The image, which is in this context a photograph, provides an objective view of the archaeological structures because we must keep in mind that the plan is already an interpretation of the reality. The photograph enables also to see the structure in its archaeological environment, to estimate the state of conservation and to distinguish different colours in the materials. This is the best way of recording all the visual information of an excavation.
The geophysical map can be considered as a third type of documentation, even if it contains some characteristics of a plan and a photograph. The geophysical map enables us to locate archaeological features of which it produces (only) an image through one of its physical properties and provides useful
5 R. Boucharlat/Chr. Benech, Organisation et aménagement de l’espace à Pasargades. Reconnaissance archéologique de surface, 1999-2001, ARTA.001, 2002. – Chr. Benech, A new vision of the royal gardens of Pasargades. Actes du colloque. 6th International Symposium of Archaeological Prospection, 12-15 septembre 2005, Rome (Italie), 39-42.
information about the environment (e.g. geology, sediments, hydrology). The question is: where should the geophysical map be classified in the archaeological documentation and, first of all, how geophysical information be exploited beyond the “simple” location of archaeological features?
Consequently, the question of the integration of geophysical data into archaeological information is today an important point of discussion6.
Concerning this question, it is interesting to consider the type of information carried out by the excavations and the geophysical surveys in order to arrive at a better understanding of their complementarities. Modern excavation brings information on a rather restricted area (from a few square meters up to some tens of square meters, depending on the type of excavation). Large excavated areas do exist: they may date from the beginning of the 20th century but often suffer from important gaps in the documentation, mainly due to the methods of excavation. Modern excavation offers detailed information about the architecture, the characteristics of the materials, the stratigraphy and of course the archaeological objects and all the archaeometric measurements. In terms of spatial analyses, the archaeologist generally proceeds by extrapolation (except for very small sites which can be entirely excavated) and will try to propose a logic, a theoretical concept of the spatial organization of the site. The variations of the density of occupation on a site are always difficult to study using only information from the excavations and would require numerous archaeological soundings for an uncertain result. Many cases in rescue archaeology demonstrate that archaeological soundings with an excavator give a less good estimate of the importance of the site than would a geophysical survey7. Nevertheless, excavation gives important information about the chronology of the density of occupation, comple-mentary to the geophysical survey.
Indeed, geophysical survey generally provides a rich and detailed information which allows a good understanding of the spatial organization of archaeological structures and of its “logic”, and may permit placing it in an environmental context about which the geophysical map can also provide suitable information. This information is available for the last level of occupation (by using electrical, magnetic or electromagnetic methods) and possibly for deeper levels using the GPR method. The questions of density of occupation can be discussed from a better-informed viewpoint, including in particular the factor of non-built areas, which may have an important role in the organization of space. In this view, excavation is an interesting complement concerning the evolution of this organization and may also characterize and differentiate different levels which could be confused on the geophysical map. We have therefore an essential “articulation” between space and time.
For instance, in the case of the study of city planning, geophysical information can be a crucial step in this research, allowing the passage between the theoretical concept and its technical realization: through the geophysical map, we can therefore consider how a theoretical concept, which generally recovers social, cultural and economic factors, has evolved during the occupation of the site. These different points, closely linked to the geophysical information, open new and interesting perspectives in the study of city planning8.
More generally, we can consider that archaeological themes need to be reconsidered from a point of view taking better account of the “nature” of the geophysical information.
6 W. Neubauer, GIS in Archaeology. The interface between Prospection and Excavation. Archaeological Prospection 11,3, 2004, 159-166.
7
E. Marmet/C. Best/A. Tabbagh, Prospection systématique par sondages à la pelle mécanique : limites liées à la probabilité de découverte. Revue d’Archéométrie 26, 2003, 12-21.
8 Chr. Benech, New approach for the study to the city planning and domestic dwellings in the ancient Near East. Archaeological Prospection, 14, 2007, 87-103.
Discussion
Archaeology is a very specific field of application of geophysics because it concerns both earth and human sciences and involves the meeting of both scientific communities. The global strategy of a geophysical survey may concern various specialists: if the choice of a geophysical method is governed by environmental conditions, it will depend also on archaeological questions9. The definition of the archaeological approach is a crucial point in the strategy of a geophysical survey: the archaeologist (it may be more relevant to use here the word “excavator”) is used to define his approach in terms of the documentation issuing from excavation, but the use of a geophysical survey could involve consideration of the same approach from another point of view, more in keeping with the nature of the geophysical data10.
The treatment and the interpretation of geophysical maps is essential to this common reflection. Even if part of a treatment, specific to the method used, is independent of the archaeological context, other methods have to be considered, beyond the production of the best image of archaeological features, even if this aspect constitutes an important part – the visual one – of the geophysical information.
Interpretation of the geophysical map must be done in common by the archaeological team, even if it belongs to the geophysicist’s role to propose a set of maps with different types of treatment or visualization. This part of the work may be developed following discussion of the interpretation. It is crucial not to separate the interpretation between both disciplines and avoid a situation where the geophysicist would “draw” on the geophysical map the archaeological features revealed by the geo-physical anomalies and the archaeologist would make an “archaeological interpretation” based on this drawing. He or she would be necessarily limited in his interpretation because he would have no contact with the original source of information: the geophysical map.
Some other considerations must be added to the preceding discussion and the answer to the question “Is there a final map?” Obviously the answer is “No!” because “Yes” would mean that no place would be is left for present or later discussion. Even if at a certain point one must stop processing the data for realistic reasons, the way must be left open to further interpretation. If we do not accept this assess-ment, this would mean that obtaining a perfect document or at least a better one in terms of the archaeological picture is an aim in itself. Obtaining such an image is not obvious on all archaeological sites or when dealing with a large panel of different problems in archaeology. Mapping a city network with regularly laid out walls and streets at shallow depth in a flat alluvial ground or searching for hidden entrances of possible prehistoric caves under a mass of fallen rocks and earth at the bottom of a limestone cliff cannot lead to the same type of spectacular image. In this respect, looking exclusively for spectacular images can lead to a non-scientific selection of appropriate sites in order to obtain this kind of result. Selecting sites in an appropriate environment also leads to a selection among the available geophysical methods in such a way that some of our colleagues may be heard stating that magnetic survey or radar ‘time-slices’ are the only really appropriate methods for archaeological surveying. This clearly constitutes an impoverishment of the range of available methods and reduces considerably the number of archaeological sites to be considered as suitable for geophysical investigation. Another consequence is that basic research and studies may then run the risk of being disregarded, since they often provide us with complicated and rather unreadable maps unless a careful interpretation is paid to
9 A. Hesse,. Multi-parametric survey for archaeology: how and why, or how and why not? Journal of Applied Geophysics, Proceedings of the 1st International workshop "Electric, magnetic and electro-magnetic methods applied to cultural heritage", EMEMACH 97, sept.29 - oct.1, Ostuni, Italie, no. 2-3, march, 1999, 157-168.
10
A. Hesse, Les dix commandements du bon petit prospecteur en archéologie, Bulletin du Centre Interdisciplinaire de Recherches Aériennes 22, 4ème trimestre, 1999, 89-90. (English translation: A. Hesse, The ten commandments of the genuine surveyor in archaeology, 3d International conference on archaeological prospection, Münich, 9-11 september 1999, 40.
them.
The interest of explicit geophysical interpretation of anomalies on the basis of measurements and of exact representation of the data must be emphasised. Particularly significant examples can be found notably in magnetic and electromagnetic surveying where the purpose of the survey consists less in a schematic description of an orthogonal network of walls than in a comprehensive description of the
detected features and their exact position in relation with the anomalies11. It is all the more true when
looking for more or less round-shaped features like kilns or different kinds of filled-in tips. Only the consideration of the width, the amplitude, the shape and the orientation of the anomaly can allow differentiating with a reasonable security those produced by archaeological features from those due to disturbing elements such as erratic metallic objects, concentrations of volcanic material12.
Conclusion
Whatever the domain of research, the thinking is closely affected by the tools used for this research. Archaeological research is mainly based on the information issuing from excavation. The integration of geophysical maps into archaeological documentation will depend on the interest and the will to redefine archaeological research in accordance with the nature of the information available through geophysical data and therefore to put a process of interpretation in accordance with this new perspective of an archaeological approach.
The key to such a development is the development of interdisciplinary research in archaeological and geophysical training. The dialogue between archaeologists and geophysicists is mainly based on geo-physical maps which need to be understood from both a geogeo-physical and an archaeological point of view. In this way we can hope to break down the difficulties and sometimes misunderstandings which exist between both communities.
11
A, Hesse/L. Barba/K. Link/A. Ortiz, A magnetic and electrical study of archaeological structures at Loma Alta, Michoacan, Mexico. Archaeological Prospection 4,2, 1997, 53-67.
12 J. Y. Empereur/A. Hesse/N. Tuna, Les ateliers d’amphores de Datça, péninsule de Cnide. Actes d colloque « Production et commerce des amphores anciennes en Mer Noire », Istanbul 25-28 mai 1994, Publications de l’Université de Provence, 1999, 105-115.
Fig. 1. A manual resistivity map at Cannes-Ecluse (Seine et Marne, France) shows a Neolithic ring ditch initially hidden among the traces of an alluvial background; handmade drawing and data processing by A. Hesse (1965).
Fig. 2. Automatic resistivity survey at the Neolithic site of Balloy (France): two large oval enclosures (in white-grey) can be recognized in a black and white geological background of a gravel and clayey outcrops.
Fig. 3. An electromagnetic survey at Marchésieux (Manche, France) reveals thanks to the in phase component of the signal, the position of six bronze axes deposits (black dots A to F). They add to two other ones (I and II) previously discovered in a non random position on a north south line. They are all located inside the traces of an ancient marsh as delimited by the low conductivities measured on the quadrature component (hatched and white areas).
Fig. 4. Magnetic map in the royal gardens of Parsargades (Iran). Original magnetic map: channels and ditches are visible but mixed with ploughing effect. Upward continuation at 0.50 m of the magnetic map: different sectors of the garden are recognizable and allow to identify the archaeological structures in accordance with the delimitation of these sectors.
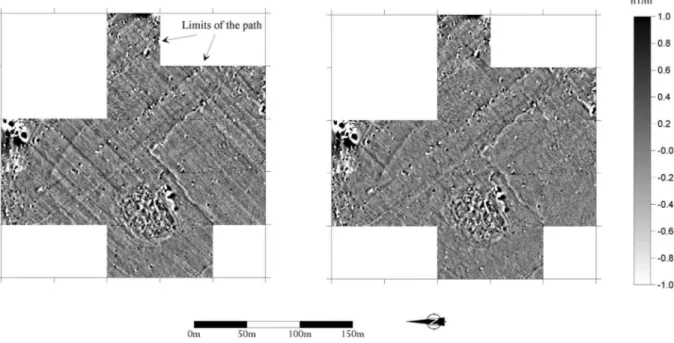
Fig. 5. Magnetic map of a path in the royal gardens of Pasargades (Iran). Original magnetic map where the path is visible but disturbed by ploughing effect. Directional filtering on the previous map: the limits of the path are highlighted but the archaeological structures with the same orientation as ploughing have disappeared.