HAL Id: hal-00490501
https://hal-mines-paristech.archives-ouvertes.fr/hal-00490501
Submitted on 8 Jun 2010
HAL is a multi-disciplinary open access
archive for the deposit and dissemination of
sci-entific research documents, whether they are
pub-lished or not. The documents may come from
teaching and research institutions in France or
abroad, or from public or private research centers.
L’archive ouverte pluridisciplinaire HAL, est
destinée au dépôt et à la diffusion de documents
scientifiques de niveau recherche, publiés ou non,
émanant des établissements d’enseignement et de
recherche français ou étrangers, des laboratoires
publics ou privés.
Constitutive modelling of the creep behaviour of single
crystal superalloys under non-isothermal conditions
inducing phase transformations
J. Cormier, Georges Cailletaud
To cite this version:
J. Cormier, Georges Cailletaud. Constitutive modelling of the creep behaviour of single crystal
su-peralloys under non-isothermal conditions inducing phase transformations. Technische Mechanik,
Magdeburger Verein für Technische Mechanik e.V., 2010, 30, pp.56-73. �hal-00490501�
TECHNISCHE MECHANIK
, 30, 1-3, (2010), 56 - 73 submitted: November 13, 2009Constitutive modelling of the creep behaviour of single crystal
superalloys under non-isothermal conditions inducing phase
transformations
J. Cormier, G. Cailletaud
The prediction of the viscoplastic behaviour of Ni-based single crystal superalloy is still a challenging issue due to the non-isothermal loadings which can be encountered by aeronautic engines components such as high pressure turbine blades and vanes. Under particular in-service conditions, these materials may experience temperature cycles which promote the dissolution of the strengthening g’-phase of the material on (over)heating, and subsequent precipitation on cooling, leading to a transient viscoplastic behaviour.
New internal variables representing the microstructural changes under those specific thermal loadings have been introduced in the framework of crystal plasticity using a macroscopic approach (no representation of the
g/g’ microstructure of the alloy) to account for the transient creep behaviour induced by microstructure changes. This modelling approach captures first order effects on the creep behaviour due to (a) g’ precipitates volume fraction evolution of each kind of particles of a bimodal distribution of precipitates (which evolves according to thermal history), (b) recovery of the dislocation density and, (c) material orientation.
In addition, a damage law keeping in memory all the thermal history and recovery processes has been introduced to account for the unconventional post-overheating creep life.
This model is calibrated on non-isothermal creep experiments on [001] oriented single crystals made of MC2 alloy. It is able to predict creep strain (primary, secondary, tertiary), whatever the temperature history of the material.
1 Introduction
Single crystal Ni-based superalloys are widely used for the design of aircraft engine components such as turbine blades and vanes due to their superior fatigue and creep properties at temperatures up to 1,100°C (Reed, 2006). The constitutive equations used by the designers to calculate stress/strain fields are often empirical and based on isothermal experiments. The models are mainly formulated at a macroscopic level, without taking into account microstructural characteristics.
Recent “microstructural sensitive models” for superalloys take into account grain size, g’ precipitate size and volume fraction (Shenoy et al., 2008), g’ morphology evolution under directional coarsening conditions (Fedelich et al., 2009), g’ precipitate spacing (Dyson, 2009) or dislocation mechanisms to account for either large primary creep amplitude under high stress/low temperature creep conditions (Dye et al., 2008; Fedelich, 2002; Ma et al., 2008) or material anisotropy (Preussner et al., 2009). However, from authors' best knowledge, no one is designed to account for temperature history. This is a weak point in case of thermal loadings inducing microstructural changes, especially fast ones such as g’ dissolution during temperature peaks representative of helicopters in-operation emergency ratings (Cormier et al., 2007b; Cormier et al., 2008a; Cormier et al., 2008c). Under such circumstances, the material microstructure is out of equilibrium, so that the properties for a given temperature differ from the steady state (Cailletaud, 1979; Cormier et al., 2008c). For example, in case of IN 100 fatigue testing under load-controlled conditions, introducing an overheating leads to a reduction of the loop width Dep just after the overheating compared to the reference loop at the same temperature (Cailletaud, 1979). This is illustrated in Figure 1 for a 120 s overheating at 1000°C applied during a stress controlled fatigue test (Ds = 685 MPa) performed at 900°C. This hardening mechanism in linked to the intragranular precipitation of a fine population of “secondary” g’ precipitates in the g matrix channels during cooling, due to the supersaturation of the matrix in g’-elements (Al, Ti …). Such a hardening process was also evidenced by Rowe and Freeman (1963). This hardening gradually disappears due to the coalescence of those hyper-fine g’ particles with the largest ones, leading to wider g channels and therefore to easier dislocation motion.
In previous studies, the effect of transient microstructural changes on the superalloys viscoplastic behaviour has been based on additional state variables accounting for the evolution of the precipitate volume fraction and size (Cailletaud, 1979; Cormier et al., 2008c). This technique provides reasonable predictions of macroscopic creep and fatigue behaviour (see Figure 1). However it does not take into account (i) the actual state of the g channel where the dislocations are confined, and where fine precipitates may appear on cooling, (ii) the material orientation.
Figure 1. Measured (circles) and calculated (lines) loops of IN 100 superalloy before and after an overheating at 1000°C lasting 120s in the course of a fatigue test performed at 900°C, with Ds = 685 MPa and R = -1 (Cailletaud and Chaboche, 1979). A decrease of the loop width is observed just after the overheating (black circles). The calculated loop without additional variables (dotted line) is not predictive of the post-overheating loop compared to the model with additional variables (continuous line).
The aim of the present article is to propose viscoplastic constitutive equations able to account for the non-isothermal creep behaviour under g’-dissolution/precipitation conditions. A classical crystal plasticity framework will be used to account for material orientation effect (Cailletaud, 1992; Cailletaud, 2009; Meric et al., 1991). Specially tailored internal variables will be introduced to represent microstructure evolution. They will be used together with a phenomenological damage variable to predict the mechanical behaviour and the creep life under non isothermal loading.
The paper is organized as follows: Section 2 describes both the microstructure evolutions occurring during non-isothermal loading including an overheating and their consequences on the creep behaviour. Section 3 shows the constitutive equations of the model focussing on the newly introduced internal variables. Finally, Section 4 illustrates the capabilities of the model for the prediction of non-isothermal creep behaviour and lives.
2 Material Description and Non-Isothermal Creep Behaviour With Changing Microstructure Nomenclature
Latin
*
a : Temperature dependant recovery variable
B: Burgers vector magnitude
s c
d : Damage scalar on slip system s
equ
f : Volume fraction of the g’ phase at thermodynamic equilibrium
l
f : Large g’ precipitates volume fraction
s
G: Shear modulus (=C44)
sj
h : Components of the hardening matrix
s
l : Slip direction in the slip plane s
m : Orientation tensor s
n : Normal to the slip system plane
Q : Dislocation hardening which cannot be recovered during an overheating
*
Q : Dislocation hardening which can be recovered during an overheating
s
r : Isotropic hardening on slip system s
·
T : Heating/Cooling rate
] [001
W : g channel width along the [001] direction
s
x : Kinematic hardening on slip system s Greek
s
a : Kinematic state variable on slip system s Dep: plastic strain amplitude
Ds: stress amplitude p
e : Viscoplastic strain tensor
s
g : Viscoplastic shear on slip system s
s
r : Isotropic state variable on slip system s u: Accumulated viscoplastic strain
s : Applied stress tensor
s
t : Resolved shear stress on slip system s
s 0
t : Critical resolved shear stress on slip system s
or
t : Orowan stress
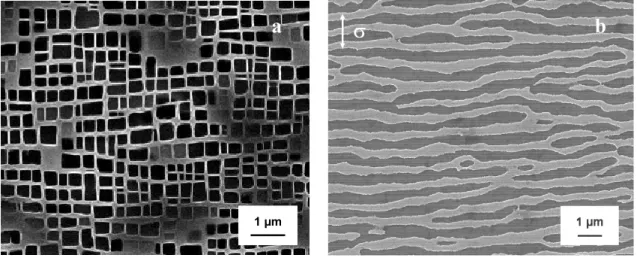
The material of the study is MC2 single crystal. Due to its chemical composition without rhenium (see Table 1), this is a first generation superalloy but often considered as a second generation due to its rather good creep properties around 1050°C, comparable to or even better than second generation materials such as CMSX-4 alloy (Caron, 2000). As-received material was homogenized at high temperature (3h at 1305°C) then air quenched (AQ) to dissolve all the g’ phase particles formed either by eutectic reaction during solidification or by precipitation during cooling. The material was then aged during 6h at 1080°C (AQ) and 20h at 870°C (AQ) to control both size (≈ 0.45 µm) and volume fraction, fvg’ (≈ 70%), of the g’ phase. After such thermal treatments, this alloy exhibits the classical g/g’ microstructure of a monocrystalline superalloy with initially cuboidal g’ precipitates (see Figure 2a).
Figure 2. As-received (a) and rafted (b) microstructures of MC2 alloy (g’-phase in dark) 1 µm
1 µm 1 µm
Ni Cr Co Mo W Al Ti Ta
Bal. 8 5 2 8 5 1.5 6
Table 1. Composition of MC2 single crystal superalloy (in wt. %)
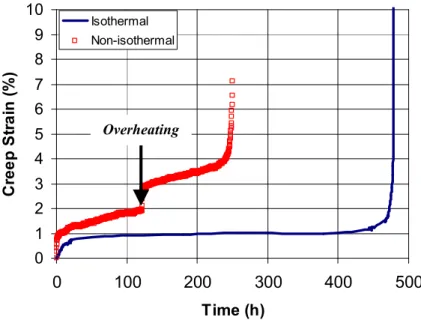
The isothermal creep behaviour in various temperature and stress conditions is well documented in the literature (Caron et al., 1986; Caron, 2000; Caron et al., 2000; Diologent, 2002; Drew et al., 2004; Maclachlan and Knowles, 2000; Maclachlan and Knowles, 2001b; Matan et al., 1999; Reed et al., 1999). Two temperature/stress domains can be distinguished: (1) at low temperature (T < 950°C) and high stress, no significant evolution of the initial cuboidal microstructure occurs during the creep experiment. (2) At higher temperature and lower stress, a great modification of the microstructure is observed during primary creep with the rafting of the g’ phase and a widening of the g channels. The resulting microstructure is illustrated in Figure 2b after 24h in creep at 1050°C/120 MPa where the g’ precipitates are elongated perpendicularly to the direction of the applied stress. It is well known from the literature that very high temperature ranges (T > 1100°C) lead to the dissolution of the g’-strengthening phase (Caron, 2000; Grosdidier et al., 1994; Royer et al., 1999; Schmidt and Feller-Kniepmeier, 1992; Serin et al., 2004). Therefore, creep strength in this temperature range is mainly dependent on the amount of remaining g’-phase. However, the isothermal behaviour turns out to be insufficient for a prediction of the deformation and durability of the material for a number of thermomechanical loadings. Indeed, during in-service conditions, the material can be exposed to temperature jumps, like during emergency situations such as One Engine Inoperative events (denoted as OT - Overheating Time - in the following of the article) possibly encountered on bi-turbine helicopters. During those engine ratings, some blades sections can be heated from 1000-1050°C up to 1200°C in 3 to 5 s. To achieve representative testing conditions, a specific test bench allowing fast thermal loadings (heating and cooling rates as high as 80°C.s-1) has been developed to mimic the OT conditions (Cormier et al., 2008a). The way the heating procedure (heating and cooling rates, heating equipment) is applied has a large influence on creep behaviour, due to the dissolution of the g’-phase. A typical non-isothermal creep behaviour with an overheating at 1200°C using this specific test bench is presented in Figure 3 and compared to the isothermal creep curve.
Figure 3. Typical non-isothermal creep behaviour of the material with a 90s overheating occurring after 122h at 1050°C/s0 compared with the pure isothermal creep behaviour at 1050°C/s0.
The effects of the introduction of a transient overheating during creep loading are the following (Cormier et al., 2007b; Cormier et al., 2008b; Cormier et al., 2008c):
1) A creep strain jump is observed during the overheating due to both g’ dissolution and dislocation density decrease at the g/g’ interfaces.
0
1
2
3
4
5
6
7
8
9
10
0
100
200
300
400
500
Time (h)
C
re
e
p
S
tr
a
in
(
%)
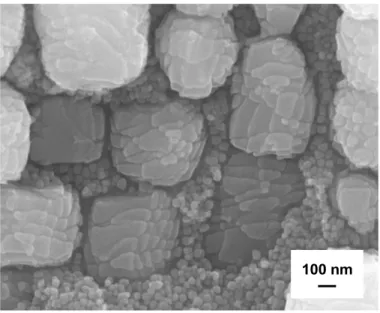
Isothermal Non-isothermal Overheating2) A fine precipitation occurs on cooling in the g channels between the coarse g’ particles not fully dissolved during the overheating (see Figure 4). These two kind of g’ particles will be denoted in the following as “small” and “large” g’ precipitates, respectively.
3) A new primary stage during the first hours of post-overheating creep due to the recovery of both the g’ volume fraction ( f ) of coarse precipitates and dislocation density at the l g/g’ interfaces. The recovery of the f l
arises from the coalescence of the fine precipitation with the coarser ones during post-OT creep. 4) An increased post-overheating minimum creep rate, leading to a decrease of creep life.
In addition, these effects depend on the overheating duration: the longer the OT, the higher the amplitude of the strain jump, the greater the amplitude of the post-OT primary stage and the lower the post-OT minimum creep rate and amazingly, due to this last fact, the longer the post-OT creep life.
Figure 4. g/g’ microstructure of MC2 alloy after a 150s overheating applied to the as-received microstructure (g’-phase appears in light grey). “Large” precipitates and a fine dispersion of g’ particles in g corridors can be observed.
Based on all these microstructural characterisations, additional variables accounting for the effect of the evolution of the g’-particles distribution and of the dislocation activity will be introduced in a crystal plasticity model (Cailletaud, 1992). Contrary to several models in which the g/g’ microstructure is modelled (Busso et al., 2000; Forest et al., 2000; Glatzel and Feller-Kniepmeier, 1989; Preussner et al., 2009), and which need a micro-macro transition to capture the mechanical behaviour of the “composite”, an homogeneous field approach will be undertaken to allow integration in finite element (FE) codes and viscoplastic calculations of components such as turbine blades. It is therefore emphasized that no attempt is made to model and to mesh the actual g/g’ microstructure of the alloy and all the microstructural parameters required to account for the non-isothermal creep behaviour (g’ volume fraction of large and small precipitates, Orowan stress, dislocation recovery variables) will be introduced in the constitutive equations.
3 Model Description
3.1 Basic single crystal model and hardening modifications
The model used for the simulation of the non-isothermal creep behaviour through additions of physically motivated internal variables is a crystal plasticity model that has been applied to numerous structural calculations of components such as tubular testing samples (Meric and Cailletaud, 1991) or single crystalline turbine blades made of superalloys (Cailletaud et al., 2003). The basic equations of this model under small strain assumption are recalled below. gs is the viscoplastic shear on a given slip system s, u is the accumulated viscoplastic strain, e the viscoplastic strain tensor, p tsthe resolved shear stress on a given slip system s. The slip rate is
100 nm 100 nm 100 nm
determined (equation (1)) by means of ts, the isotropic hardening r and the kinematic hardening s x . s m is s the orientation tensor calculated according to equation (3) knowing the normal to the slip system plane n and s the slip direction in this plane l . Knowing the applied stress tensor s s , the resolved shear stress is calculated according to equation (4) and then the viscoplastic strain tensor is determined using equation (5). The damage evolution has been considered to occur at the slip system level. The damage scalar s
c
d is therefore introduced in
equation (1) using a concept of effective resolved shear stress. The damage evolution equation will be presented in a next section of this article.
(
)
(
s s)
n s c s s s s x d 1 K r x -÷ ÷ ÷ ø ö ç ç ç è æ -= · t t g sign (1) 2 1 3 2 ÷÷ ø ö çç è æ ÷÷ ø ö çç è æ = · · · p p :ε ε u (2)(
s s s s)
s n l l n 2 1 m = Ä + Ä (3) s m : σ = s t (4) s p m ε s så
· · = g (5)Since the only loadings available are monotonic, isotropic and kinematic hardening cannot be discriminated. It was then decided to suppress the kinematic variable x from the model. Equation (1) then transforms into s
equation (6):
(
)
( )
s n s c s s s d 1 K r t t g sign ÷ ÷ ÷ ø ö ç ç ç è æ -= · (6)As a second assumption, only octahedral slip systems will be considered (cubic slip systems ignored).
To introduce the above mentioned microstructure evolutions occurring during temperature changes, a new form of the isotropic hardening r is proposed in equation (7). s r depends on s rs (equation (8)) and s
0
t , the critical resolved shear stress, as usually. A non-linear saturating form of rs is chosen to account for the transition from primary to secondary creep stage corresponding to a critical dislocation density that can enter g channels (Dlouhy et al., 2001; Probst-Hein et al., 1999). In addition, two new characteristics appear in the formulation of rs:
· An Orowan contribution ] 001 [ GB 3 2 W or =
t has been added to account for the structural hardening brought by the g’-phase, whatever its kind of population (large or fine precipitation). G is the shear modulus (=C44 for orthotropic materials such as single crystal superalloys), B the Burgers vector magnitude (= 0.254 nm), and W[001] the g-channel width along the [001] direction (i.e: in a (100) or a (010) plane). Since dislocations under high temperature conditions are mainly gliding in the matrix on octahedral slip systems, the
3 2 correction factor is added when calculating the Orowan stress using g corridors width along the [001] direction (Benyoucef et al., 1993). This value was assume to be 0.5 by Fedelich (Fedelich et al., 2009) and 0.85 (i.e: close to our value) by Tinga (Tinga et al., 2009). Linking W[001] with the volume fractions of large and fine g’ precipitates (see next section) will enable the modelling of the g’ dissolution/precipitation effects upon the viscoplastic behaviour.
· The second term of equation (7), represents dislocation hardening through the isotropic state variable
s
r and cross hardening by means of the interaction matrix [h]. For a given dislocation state, defined by a set of
s
r on each slip system, the hardening will consist of a steady-state contribution, given by Q , and a transient contribution, defined by Q . The material parameter Q depends on temperature only, meanwhile * Q is a * variable that depends on temperature and ageing (see section 3.2.2).
(
)
] 001 [ 0 GB 3 2 W h Q Q b r j j sj s s =t + + *å
r + (7)(
)
s s s b 1 · · -= r n r (8)From a metallurgical point of view, equation (7) can therefore be described as the sum of, from left to right, solid solution hardening brought by the matrix ( s
0
t ), dislocation hardening and structural hardening coming from the precipitates.
3.2 Microstructural Evolutions 3.2.1 g’-phase evolutions
The evolution of large g’ precipitates during heating/cooling periods in a temperature range inducing g’ dissolution (T > 950°C) is described by equation (9). An exponential expression is then obtained for the evolution of this kind of g’ particles, as observed in IN 100 polycrystalline superalloy (Huff and Pillhofer, 1988) or more recently in MC2 alloy (Cormier et al., 2007a). The same kind of evolution was chosen in recent phase field simulations performed by Wang to analyse the effect of their initial size on precipitate dissolution (Wang et al., 2009). al is the time constant for the dissolution/coalescence process depending on temperature. The temperature dependent values of al and fequ (the g’-volume fraction at thermodynamical equilibrium) were measured from microstructural investigations performed previously (Cormier, 2006; Cormier et al., 2007a; Cormier et al., 2008c). l l equ l f f f a -= · (9)
A challenging issue was to model the evolution of the fine g’ precipitation occurring in the g channels on cooling (see Figure 4). Indeed, it would have been easy to assume that fl + fs = fequ, f being the volume fraction of s
small precipitates. Nevertheless, this equation is only valid when the secondary precipitation occurs (cooling after a dissolution time). Indeed, the small precipitates may not have the chemical composition of the largest ones. It was even shown that the kinetics of dissolution or coalescence is different for large and small precipitates (Cormier, 2006). The following evolutions of the fine precipitates volume fraction f are then s
defined, considering isothermal conditions without overheating or during first overheating equation (10), cooling after an overheating equation (11) and re-heating after an overheating equation (12):
if
(
fequ- fl)
£0, fs=0 · (10) if(
fequ- fl)
>0 and <0 · T , s 1 m s s s s l equ s K f T f f f f ÷÷ ø ö ç ç è æ -= · · a (11) if(
fequ- fl)
>0 and T·³0, s 2 m s s s K f f ÷÷ ø ö ç ç è æ -= · (12)The time constant as is smaller than alfor the largest precipitates. In particular, the dissolution is quasi-instantaneous for temperatures over 1000°C.
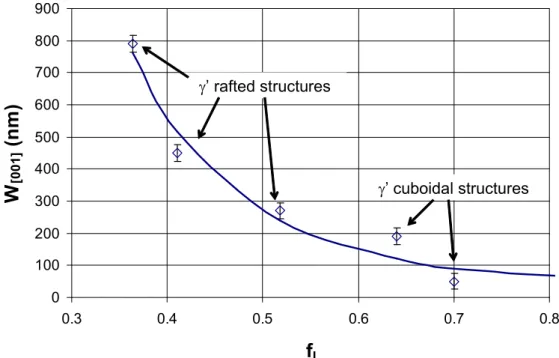
Finally, the average g channel width along the [001] direction has been determined empirically, knowing the g’ volume fractions ( f and l f ) according to equation (13): s
(
lm tp s)
0 001 f d f a W = 1 -d ] [ (13)where a is the initial average edge length of the 0 g’ cubes (= 0.45 µm) and m , l d and tp d material parameters.
] [001
W dependence on f was determined using image analysis technique and standard metallographic l
preparation on various crept and un-crept samples exhibiting either cubic or rafted microstructures (see Figure 5). A linear dependence of W[001] on f has been introduced since the fine precipitation filling the s g channels on cooling is very effective in narrowing the channels (g channel width can be as low as 10 nm). It should be
admitted at this point of the study that the dtp parameter is not yet determined experimentally due to difficulties
in image analyses of these ultrafine particles. It is also pointed out that an experimental evolution of W[001] on the g’ volume fractions has been chosen rather than physical models based on geometrical considerations (Chen and Immarigeon, 1998; Fedelich et al., 2009) since our model should take into account rapid changes of volume fraction under a wide range (from 0 to 0.7) and whatever the precipitates morphology (cuboidal or rafted).
Figure 5. Dependence of the average g channel width on the volume fraction of large g’ precipitates. The nature of the analyzed g’ structures (whether cuboidal or rafted) is indicated for each measurement.
3.2.2 Dislocation/precipitate interactions
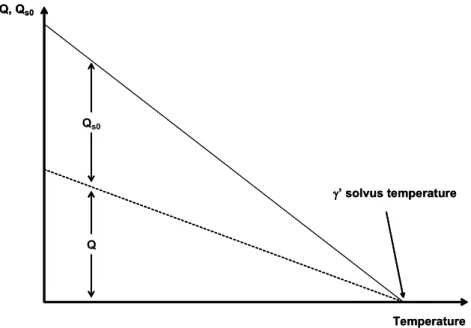
The dislocation density evolutions occurring during OT have been modelled through a decomposition of the work hardening (second term in equation (7)): Q is a material parameter corresponding to the dislocation pinned at the g/g’ interfaces which cannot vanish during the OT due to recovery processes (dislocation climb or g’ cutting/annihilation process), while Q is a variable describing the effect of microstructure changes. * Q * depends on a state variable *a (equation (14)) whose evolution range is [0,1]. Q is then the maximum S0 recoverable dislocation hardening. Figure 6 provides an illustration of Q and Q evolutions as a function of the S0
temperature. *a evolution is presented in equation (15): the metallurgical steady-state (maximum recovery) is
obtained for a*=0. The first term of equation (15) accounts for the recovery effects upon temperature changes while the second one represents the (re)establishment of dislocation structures after temperature peak. *a and
*
b are the time constants for those processes with a*<<b* (for example, =3300
* * a b at 1200°C). The * * a b ratio is proportional to 1/T. 0 S Q a Q* = * (14) * * b a * · * * · -= a T a a , a*
(
t=0)
=1 (15) 0 100 200 300 400 500 600 700 800 900 0.3 0.4 0.5 0.6 0.7 0.8f
lW
[00 1](
n
m)
g’ rafted structures
g’ cuboidal structures
0 100 200 300 400 500 600 700 800 900 0.3 0.4 0.5 0.6 0.7 0.8f
lW
[00 1](
n
m)
g’ rafted structures
g’ cuboidal structures
Figure 6. Illustration of Q and Q evolutions as a function of the temperature. S0
3.3 Damage law
For the considered alloy and conditions, critical cracks are very small and the creep life of the material is mainly spent in the initiation stage (Maclachlan and Knowles, 2001a). For example, in case of MC2 alloy, tertiary creep stage lasts for 2 to 5% of the creep life at 1050°C under low stress conditions (Cormier et al., 2007b). For that reason, only a continuum damage model will be used to give an estimation of the non-isothermal creep life. The damage evolution is formulated at a microscopic level, on each slip system (equation (16)). This damage evolution has been given a Rabotnov – Kachanov formulation (Kachanov, 1958). Nevertheless, instead of using the applied stress, a kinematic variable x is chosen as critical variable. s
After a nucleation period defined by a threshold nd (the cumulated slip on system s must reach a given value
d s n
n > before damage starts), the damage rate is defined as a power function of
(
s)
c s d 1 x - , which produces a catastrophic softening and tertiary creep on a macroscopic level (equation (16)). The use of x instead of s ts is motivated by the fact that a high frequency fatigue loading must not generate creep damage. This is naturally verified if x is the critical variable since the plastic strain amplitude remains negligible, and so s x does. s
if n >nd,
(
)
x m s c x s s c d 1 K x d ÷ ÷ ÷ ø ö ç ç ç è æ -= · (16) This evolution is somewhat identical to previous models where multiplication of mobile dislocations is a mechanism that produces softening (Hou et al., 2009; Matan et al., 1999; Mclean and Dyson, 2000).Pore growth is also a source of damage in this alloy, but this is a relevant damage mechanism only in the last stage of life, in the very steep tertiary creep when creep strains are greater than 5 % (Komenda and Henderson, 1997). This would create a viscoplastic volume change that is not taken into account in our model.
Based on the experimental observation that tertiary regime under non-isothermal loading always initiates after a 1% creep strain, one chooses nd =1% (Cormier et al., 2008c).
The evolution of x is classically defined on each slip system by means of the variables s as (equation (17)), that has a non linear evolution with respects to the plastic slip on system s, gs (equation (18)).
s s C x = a (17)
(
)
(
)
s s s s s d x · · -= t a g a sign (18) Temperature Q, Qs0 g’ solvus temperature Qs0 Q Temperature Q, Qs0 g’ solvus temperature Qs0 QThe material parameter C in equation (17) characterises the amount of internal stress produced by a given as
value, meanwhile d in equation (18) influences the non linearity of the evolution and the saturation of as (the asymptotic value is 1/d).
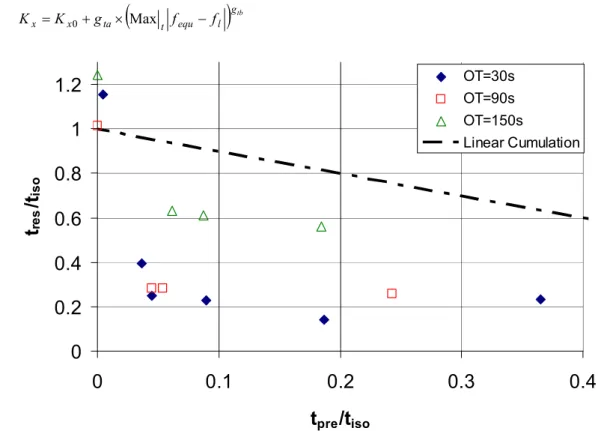
Finally, the overheating length dependence of the post-OT creep life has to be modelled. Surprisingly, it has been observed (Cormier et al., 2007b) that the longer the OT, the longer the subsequent creep life. This is illustrated in Figure 7, where the post-OT creep life tres (normalized by the isothermal creep life at 1050°C/s0, tiso) is plotted as a function of the creep time at 1050°C/s0 before the overheating tpre (also normalized by tiso) for various overheatings at 1200°C/s0. To capture this tendency, an empirical dependence of K in equation (16) is x
proposed (equation (19)), where the difference ( fequ- fl) must be seen as a measure of the overheating length.
0 x
K , g and ta g are material parameters which depend on temperature. th
(
)
gtb l equ t ta x x K g f f K = 0+ ´Max - (19)Figure 7. Evolution of the post-overheating creep life at 1050°C/s0 (tres/tiso) as a function of creep time 1050°C/s0 before overheating (tpre/tiso) for various overheating lengths at 1200°C/s0. Note the increase of tres/tiso as a function of the OT duration, for a given(tpre/tiso).
4 Identification and Simulation 4.1 Identification
The material parameters have been identified on a large database composed of both isothermal experiments (tensile and creep tests) and non-isothermal creep tests performed on [001] oriented MC2 samples. A step by step optimisation process using the optimiser module Z-opt of Zébulon (Besson et al., 1998) was performed to identify the flow rule parameters ( n ,K) as well as s
0
t , b and (Q+QS0). These parameters were identified from a set of three tension tests at 1050°C with different strain rate (1.10-3 s-1, 1.10-4 s-1, 1.10-5 s-1) and four isothermal creep experiments at 1050°C under 140 MPa, 181 MPa, 200 MPa and 230 MPa.
Subsequently, ten non-isothermal creep experiments with various overheating lengths and positions in the isothermal creep life at 1050°C/s0 were used to identify *a , a*, *b , b*. The experiments used for the identifications have been chosen so that the temperature spikes were always performed once a rafted microstructure has been generated before the OT (experiments with tpre/tiso > 0.05 in Figure 7).
0
0.2
0.4
0.6
0.8
1
1.2
0
0.1
0.2
0.3
0.4
t
pre/t
isot
res/t
iso OT=30s OT=90s OT=150s Linear CumulationDamage evolution parameters (K ,x0 g , ta g , C , d , th m ) were identified from both isothermal and non-x
isothermal creep tests using the same process.
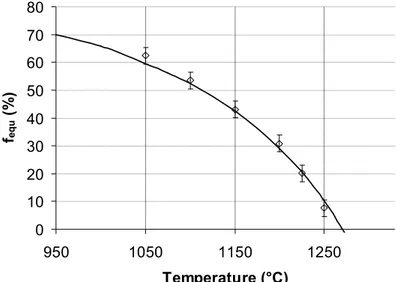
Microstructural parameters were identified from either dissolution experiments or interrupted creep experiments, as already presented for W[001] in section 3.2.1. The temperature dependences of al and fequ were identified
using the procedure presented by Cormier et al. (2007a). The temperature dependence of fequ is presented in Figure 8. Parameters as, K , s1 K and s2 ms, accounting for the evolutions of the fine g’ precipitation, were identified using interrupted non-isothermal creep tests and subsequent image analysis in the early stages of the post-OT creep life. Another possible technique for identification of the evolution law of the hyperfine precipitation is to perform an inverse identification, considering only the macroscopic mechanical behaviour. It has already been performed in the past for the case of non-isothermal LCF tests under stress control (Cailletaud, 1979): the evolution of the strain range after overheating (see Figure 1), and the time needed for the loops to recover their reference width give an access to the strengthening coming from the fine g’ precipitates and to the time constant for dissolution during subsequent cycling.
Figure 8. Evolution of the g’ volume fraction versus temperature in MC2 alloy at thermodynamic equilibrium as a function of temperature.
In the simulations presented in the next section, d has been fixed to zero since no noticeable effect of the fine tp
precipitation on the macroscopic non-isothermal creep behaviour has been noticed. Indeed, if a strengthening would have been introduced by the fine precipitation, a smaller creep strain rate just after the overheating would have been obtained rather than a new primary creep regime (see Figure 3).
4.2 Behaviour simulation
The following initial conditions were applied for each simulations:gs
(
t=0)
=0, u(
t=0)
=0, a*(
t=0)
=1,(
t 0)
0fs = = , fl
(
t=0)
= fequ, dcs(
t=0)
=0, as(
t=0)
=0, rs(
t=0)
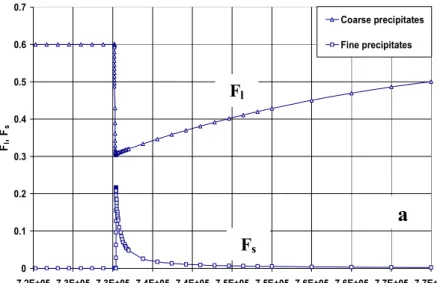
=0. It can be observed in Figure 9, which considers a 150s overheating applied after 200h in creep at 1050°C, that the g’ evolution and the creep behaviour (i.e: without damage evolution) are well predicted. It is clearly illustrated in Figure 9a that coarse and fine population of g’ phase do not have the same kinetics of evolutions after the OT according to the difference of their respective time constants as and al in equations (9) and (11). Focussing on the creep strain, both thenew primary stage and the increased stationary creep strain rate are also well predicted (Figure 9b). Considering now the whole database used for the identification, it can be observed (Figure 10) that the non-isothermal creep behaviour is well predicted. The reference creep temperature is 1050°C, meanwhile the overheating temperature is 1200°C. The specimens were not unloaded during the overheating. All the desired evolutions are well captured. The post-OT stationary creep strain rates are all well predicted, with less than a 1.5 factor between experiments and modelled curves. Moreover, the strain jumps induced by the overheatings are also well predicted, except for one case (100h in creep at 1050°C followed by a 150s overheating), that remains unexplained. Some other small discrepancies between model and experiment can also been observed:
0 10 20 30 40 50 60 70 80 950 1050 1150 1250 Temperature (°C) fequ ( %)
· In general, during post-OT primary stage, the model exhibits rather slow creep rates.
· During the primary creep stage before overheating, some differences in the amount of creep strain can be observed. Some of the experiments exhibit higher primary creep strain compared to the model.
The possible origins for these differences can be the slight misorientations of the gage axis of the samples with respects to the [001] direction (no more than 7°) which has not been taken into account in the model (only pure [001] orientation was considered). One could also suspect slight variations of the chemical compositions of the alloy, since the samples were machined out from two different batches of rods.
Figure 9. Non-isothermal creep experiment with a 150s overheating applied after 200h creep at 1050°C/s0. (a) – Simulation of the evolution of the g’ volume fraction due overheating (b) Comparison of the simulation with the experimental creep deformation. Note that damage evolution is not considered in the present simulation.
The model was also used to simulate isothermal creep behaviour at 1050°C for close [101] and [102] oriented MC2 single crystals. The exact orientations of the single crystals are presented in standard inverse poles figures appearing as inserts in Figures 11a and 11b for [101] and [102] orientations, respectively. It can be observed in Figures 11a that very a good agreement is obtained between experiments and simulations, especially under 200 MPa where experimental and model curves are coincident. For [102] oriented samples, the comparison is not too satisfactory: except for the early stages of creep deformation at 140 MPa, the model over-estimates creep strain. It should be noted that these simulations have been performed using a set of parameters identified from an experimental database containing only [001] oriented specimens. The orientation effect is then only taken into
0 0.01 0.02 0.03 0.04 0.05 0.06 0.07 0.08 0.09 0.1
0.00E+00 2.00E+05 4.00E+05 6.00E+05 8.00E+05 1.00E+06 1.20E+06 1.40E+06 1.60E+06 1.80E+06 Time (s) C ree p s tra in Experiment Model 0 0.1 0.2 0.3 0.4 0.5 0.6 0.7
7.2E+05 7.3E+05 7.3E+05 7.4E+05 7.4E+05 7.5E+05 7.5E+05 7.6E+05 7.6E+05 7.7E+05 7.7E+05
Time (s) Fl , F s Coarse precipitates Fine precipitates
a
b
F
lF
smodelling: one could consider a different interaction matrix (in our case, all the h interaction coefficients sj
between octahedral slip systems have been fixed equal to one) or introduce cubic slip systems (Preussner et al., 2009).
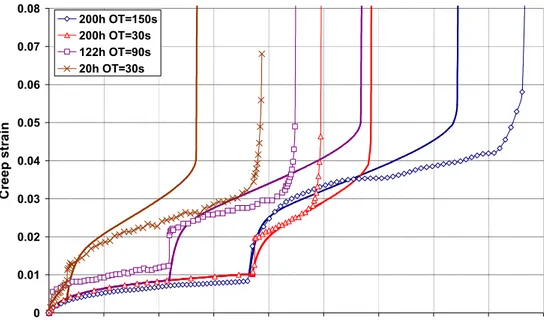
Figure 10. Model simulations (bold lines) compared to experimental results (dotted lines) for a wide range of creep conditions (creep at 1050°C, OT at 1200°C). Only primary and secondary creep stages are considered in the model (damage excluded).
Figure 11. Model predictions (bold lines) compared to experiments (dotted lines) under isothermal creep conditions at 1050°C for [101] (a) and [102] (b) oriented single crystals (see standard inverse poles figure in inserts)
4.3 Non-isothermal creep life prediction
Damage is now introduced in the simulations, in order to predict tertiary creep and time to failure. Figure 12 shows a very good agreement between experiments and model simulation for the steep tertiary stage of the creep deformation. In this alloy, the transition from secondary to tertiary stage at 1050°C/low stress (s0 < 150 MPa) is very abrupt and corresponds to the transition from stable dislocation networks at the g/g’ interfaces, preventing any dislocation glide in the g’ phase, to a local instability linked to a massive shearing of the g’-phase (Caron et al., 2000). Therefore, using a damage evolution localized on each slip systems, based on a kinematic-like
0 0.01 0.02 0.03 0.04 0.05 0.06 0.07 0.08
0.0E+00 2.0E+05 4.0E+05 6.0E+05 8.0E+05 1.0E+06 1.2E+06 1.4E+06 1.6E+06 1.8E+06
Time (s) C ree p s tr ain 200h OT=150s 200h OT=30s 122h OT=90s 100h OT=150s 60h OT=90s 20h OT=30s 0.E+00 1.E-03 2.E-03 3.E-03 4.E-03 5.E-03 6.E-03 7.E-03 8.E-03 9.E-03 1.E-02
0.E+00 1.E+04 2.E+04 3.E+04 4.E+04 5.E+04 6.E+04 7.E+04 8.E+04 9.E+04 1.E+05
Time (s) C re ep S tr ain Experiment_140MPa Model_140MPa Experiment_200MPa Model_200MPa 0.E+00 1.E-03 2.E-03 3.E-03 4.E-03 5.E-03 6.E-03 7.E-03 8.E-03 9.E-03 1.E-02
0.E+00 1.E+04 2.E+04 3.E+04 4.E+04 5.E+04 6.E+04 7.E+04 8.E+04 9.E+04 1.E+05
Time (s) C re ep S tr ain Experiment_140MPa Model_140MPa Experiment_200MPa Model_200MPa 0.E+00 1.E-03 2.E-03 3.E-03 4.E-03 5.E-03 6.E-03 7.E-03 8.E-03 9.E-03 1.E-02
0.E+00 1.E+04 2.E+04 3.E+04 4.E+04 5.E+04 6.E+04 7.E+04 8.E+04 9.E+04 1.E+05
Time (s) C re ep S tr ain Experiment_140MPa Model_140MPa Experiment_200MPa Model_200MPa 0.0E+00 2.0E-03 4.0E-03 6.0E-03 8.0E-03 1.0E-02 1.2E-02 1.4E-02
0.E+00 1.E+04 2.E+04 3.E+04 4.E+04 5.E+04 6.E+04 7.E+04 8.E+04 9.E+04 1.E+05
Time (s) C re ep S tr a in Experiment_140MPa Model_140MPa Experiment_200MPa Model_200MPa 0.0E+00 2.0E-03 4.0E-03 6.0E-03 8.0E-03 1.0E-02 1.2E-02 1.4E-02
0.E+00 1.E+04 2.E+04 3.E+04 4.E+04 5.E+04 6.E+04 7.E+04 8.E+04 9.E+04 1.E+05
Time (s) C re ep S tr a in Experiment_140MPa Model_140MPa Experiment_200MPa Model_200MPa 0.0E+00 2.0E-03 4.0E-03 6.0E-03 8.0E-03 1.0E-02 1.2E-02 1.4E-02
0.E+00 1.E+04 2.E+04 3.E+04 4.E+04 5.E+04 6.E+04 7.E+04 8.E+04 9.E+04 1.E+05
Time (s) C re ep S tr a in Experiment_140MPa Model_140MPa Experiment_200MPa Model_200MPa
a
b
hardening (i.e: on a dislocation back-stress), is a reliable way to capture this tertiary creep regime. From our best knowledge, this is the first time that such an approach is employed in a damage evolution law.
Figure 12. Model simulations (bold lines) including tertiary stage compared to experimental results (dotted lines) for a wide range of non-isothermal creep conditions.
A comparison between the predicted creep life and the experiment is done in Figure 13. It can be observed (Figure 13a) that the total non-isothermal creep life (creep time before the OT + OT + post-OT creep time to reach failure) is well predicted by the model. All the points lie in between the straight dotted lines which define a factor 2 (or 1/2) between the two curves.
In order to get a better view of the model ability to capture the unconventional dependence of the post-OT creep life on the overheating length, the numerical results (open symbols) are superimposed to the experimental ones (bold symbols) in the plot already presented in Figure 7. The result of the procedure, presented in Figure 13b, shows that the global trend is captured, i.e: the longer the OT, the longer the post-OT creep life. This result has been achieved by means of equation (19). The agreement is rather good, even if the numerical results overestimate the experimental ones for 90s OTs while they underestimate 150s ones. More tests would be needed to confirm the experimental values.
5 Summary and Conclusions
A microstructure sensitive model has been developed in the framework of crystal plasticity in order to be predictive of the non-isothermal creep behaviour of Ni-based single crystal superalloys, especially when rapid microstructure evolutions occur (dissolution of the g’ phase and recovery of the dislocation density on heating close to the solvus temperature, hyperfine precipitation in the matrix on cooling after an overheating and g’ coalescence during subsequent creep). In addition, this model is coupled with a damage evolution on each slip system to account for the non-isothermal creep life of the alloy.
The modelling approach is based on the introduction of new internal variables such as the g’ volume fraction of coarse and small particles or a temperature dependent aging variable to account for dislocation recovery on (over)heating.
It has been demonstrated that all the desired non-isothermal characteristics are well predicted by our model: new primary-creep stage after an overheating, increased post-overheating creep strain rate, non-isothermal creep life, very steep strain evolution during tertiary creep stage.
0 0.01 0.02 0.03 0.04 0.05 0.06 0.07 0.08
0.0E+00 2.0E+05 4.0E+05 6.0E+05 8.0E+05 1.0E+06 1.2E+06 1.4E+06 1.6E+06 1.8E+06
Time (s) C reep s tr a in 200h OT=150s 200h OT=30s 122h OT=90s 20h OT=30s
Acknowledgements
The authors are grateful to Turboméca – SAFRAN group for collaboration over many years.
Figure 13. Total non-isothermal creep life predictions compared to experimental ones (a) and post-overheating creep life predictions (open symbols) compared to experimental ones (bold symbols) (b).
References
Benyoucef, M.; Clement, N., Coujou, A.: Transmission electron microscopy in situ deformation of MC2 superalloy at room temperature. Mat. Sci. Eng., A164, (1993), 401-406.
Besson, J.; Riche, R.L.; Foerch, R., Cailletaud, G.: Oriented Programming Applied to the Finite Element Method - Part II: Application to Material Behavior. Rev. Eur. Eléments Finis., 7, (1998), 567-588.
0
0.1
0.2
0.3
0.4
0.5
0.6
0.7
0.8
0.9
0
0.1
0.2
0.3
0.4
t
pre/t
isot
res/t
iso OT=30s OT=90s OT=150s OT=30s model OT=90s model OT=150s model Linear cumulationb
100 1000 100 1000 Experimental life (h) M o d el lif e ( h)a
Busso, E.P.; Meissonnier, F.T., O'dowd, N.P.: Gradient-dependent deformation of two-phase single crystals. J.
Mech. Phy. Sol., 48, (2000), 2333-2361.
Cailletaud, G.: Modélisation mécanique d'instabilités microstructurales en viscoplasticité cyclique à température
variable. PhD Thesis, ONERA, Paris (1979).
Cailletaud, G., Chaboche, J.-L.: Macroscopic description of the microstructural changes induced by varying
temperature: example of the IN 100 cyclic behaviour. In: Miller K.J., Smith R.F. (Eds), Proceedings of Third
International Conference on Mechanical Behaviour of Materials (ICM-3), Cambridge (G.B.), pp. 23-32 (1979).
Cailletaud, G.: A micromechanical approach to inelastic behavior of metals. Int. J. Plast., 8, (1992), 55-73. Cailletaud, G.; Chaboche, J.-L.; Forest, S., Remy, L.: On the design of single crystal turbine blades. La Revue de
Métallurgie, (2003), 165-172.
Cailletaud, G.: An overview of the anatomy of crystal plasticity models. Adv. Eng. Mat., 11, (2009), 710-716. Caron, P.; Henderson, P.J.; Khan, T., Mclean, M.: On the effects of heat treatments on the creep behaviour of a
single crystal superalloy. Scripta Met., 20, (1986), 875-880.
Caron, P.: High g' solvus new generation nickel-based superalloys for single crystal turbine blade applications.
In: Pollock, T.M., Kissinger, R.D., Bowman, R.R., Green, K.A., Mclean, M., Olson, S., Schirra, J.J. (Eds), Proceedings of Superalloys 2000, Seven Springs, Champion, PA, USA, pp. 737-746 (2000).
Caron, P.; Benyoucef, M.; Coujou, A.; Crestou, J., Clement, N.: Creep behaviour at 1050°C of a Re-containing
single crystal superalloy. In: Raj, B., Bhanu, K., Rao, S., Jayakumar, T., Dayal, R.K. (Eds), Proceedings of
International Symposium on Materials Ageing and Life Management (ISOMALM 2000), Kalpakkam (India), pp. 148-156 (2000).
Chen, W., Immarigeon, J.-P.: Thickening behaviour of g' precipitates in nickel base superalloys during rafting.
Scripta Mat., 39, (1998), 167-174.
Cormier, J.: Comportement en fluage anisotherme à haute et très haute température du superalliage
monocristallin MC2. PhD Thesis, LMPM/ENSMA, Université de Poitiers (2006).
Cormier, J.; Milhet, X., Mendez, J.: Effect of very high temperature short exposures on the dissolution of the g' phase in single crystal MC2 superalloy. J. Mat. Sci., 42, (2007a), 7780-7786.
Cormier, J.; Milhet, X., Mendez, J.: Non-isothermal creep at very high temperature of the Nickel based single crystal superalloy MC2. Acta Mat., 55, (2007b), 6250-6259.
Cormier, J.; Milhet, X.; Champion, J.-L., Mendez, J.: Simulation of very high temperature overheating during isothermal creep of single crystal Ni-base superalloy. Adv. Eng. Mat., 10, (2008a), 56-61.
Cormier, J.; Milhet, X., Mendez, J.: Anisothermal Creep at very high temperature of a second generation Ni-based single crystal superalloy. Mat. Sci. Eng., A483-484, (2008b), 594-597.
Cormier, J.; Milhet, X.; Vogel, F., Mendez, J.: Non-isothermal creep behavior of a second generation Ni-based
single crystal superalloy: experimental characterization and modeling. In: Reed, R., Green, K., Caron, P.,
Gabb, T., Fahrmann, M., Huron, E., Woodard, S. (Eds), Proceedings of Superalloys 2008, Seven Springs, Champion, PA, USA, pp. 941-949 (2008c).
Diologent, F.: Comportement en fluage et en traction de superalliages monocristallins à base de nickel. PhD Thesis, Université de Paris Sud, Centre d'Orsay (2002).
Dlouhy, A.; Probst-Hein, M., Eggeler, G.: Static dislocation interactions in thin channels between cuboïdal particles. Mat. Sci. Eng., A309-310, (2001), 278-282.
Drew, G.L.; Reed, R.C.; Kakehi, K., Rae, C.M.F.: Single crystal superalloys: the transition from primary to
secondary creep. In: Green, K.A., Pollock, T.M., Harada, H., Howson, T.E., Reed, R.C., Schirra, J.J.,
Walston, S. (Eds), Proceedings of Superalloys 2004, Seven Springs, Champion, PA, USA, pp. 127-136 (2004).
Dye, D.; Ma, A., Reed, R.C.: Numercial modelling of creep deformation in a CMSX-4 single crystal superalloy
Turbine Blade. In: Reed, R., Green, K., Caron, P., Gabb, T., Fahrmann, M., Huron, E., Woodard, S. (Eds),
Proceedings of Superalloys, Seven Springs, Champion, PA, USA, pp. 911-919 (2008).
Dyson, B.F.: Microstructure based creep constitutive model for precipitation strengthened alloys: theory and application. Mat. Sci. Tech., 25, (2009), 213-220.
Fedelich, B.: A microstructural model for the monotonic and the cyclic mechanical behavior of single crystals of superalloys at high temperature. Int. J. Plast., 18, (2002), 1-49.
Fedelich, B.; Kunecke, G.; Epishin, A.; Link, T., Portella, P.: Constitutive modelling of creep degradation due to rafting in single crystals Ni-base superalloys. Mat. Sci. Eng., A510-511, (2009), 273-277.
Forest, S.; Barbe, F., Cailletaud, G.: Cosserat modelling of size effects in the mechanical behaviour of polycrystals and multi-phase materials. Int. J. Sol. Struct. 37, (2000), 7105-7126.
Glatzel, U., Feller-Kniepmeier, M.: Calculations of internal stresses in the g/g' microstructure of a nickel-base superalloy with high volume fraction of g'-phase. Scripta Met., 23, (1989), 1839-1844.
Grosdidier, T.; Hazotte, A., Simon, A.: On the dissolution mechanisms of g' precipitates in nickel-based superalloys. Scripta Met. Mat., 30, (1994), 1257-1262.
Hou, N.X.; Wen, Z.X., Yue, Z.F.: Creep behavior of single crystal superalloy under temperature gradient condition. Mat. Sci. Eng., A510-511, (2009), 42-45.
Huff, H., Pillhofer, H.: Quantitative microstructure analysis to determine overheating temperature in IN100
turbine blades. In: S. Reichman, D.N.Duhl, G. Maurer, S. Antolovich, C. Lund (Eds), Proceedings of
Superalloys 1988, pp. 835-843 (1988).
Kachanov, L.M.: Time of the rupture process under creep conditions. Isv. Akad. Nauk. SSR. Otd. Tekh. Nauk., 8, (1958), 26-31.
Komenda, J., Henderson, P.J.: Growth of pores during the creep of a single crystal nickel-base superalloy.
Scripta Mat., 37, (1997), 1821-1826.
Ma, A.; Dye, D., Reed, R.C.: A model for the creep deformation behaviour of single-crystal superalloy CMSX-4.
Acta Mat., 56, (2008), 1657-1670.
Maclachlan, D.W., Knowles, D.M.: Creep-behaviour Modelling of the Single-Crystal Superalloy CMSX-4. Met.
Mat. Trans., 31A, (2000), 1401-1411.
Maclachlan, D.W., Knowles, D.M.: The effect of material behaviour on the analysis of single crystal turbine blades. Fat. Fract. Eng.. Mat. Struct. 25, (2001a), 385-409.
Maclachlan, D.W., Knowles, D.M.: Modelling and prediction of the stress rupture behaviour of single crystal superalloys. Mat. Sci. Eng., A302, (2001b), 275-285.
Matan, N.; Cox, D.C.; Carter, P.; Rist, P.A.; Rae, C.M.F., Reed, R.C.: Creep of CMSX-4 superalloy single crystals: effects of misorientation and temperature. Acta Mat., 47,(1999), 1549-1563.
Mclean, M., Dyson, B.F.: Modelling the effects of damage and microstructural evolution on the creep behaviour of engineering alloys. J. Eng. Mat. Tech., 122, (2000), 273-278.
Meric, L., Cailletaud, G.: Single crystal modelling for structural calculations: Part 2 - Finite element implementation. J. Eng. Mat. Tech., 113, (1991), 171-182.
Meric, L.; Poubanne, P., Cailletaud, G.: Single crystal modelling for structural calculations: Part I - Model Presentation. J. Eng. Mat. Tech., 113, (1991), 162-170.
Preussner, J.; Rudnik, Y.; Brehm, H.; Volkl, R., Glatzel, U.: A dislocation density based material model to simulate the anisotropic creep behavior of single-phase and two-phase single crystals. Int. J. Plast., 25, (2009), 973-994.
Probst-Hein, M.; Dlouhy, A., Eggeler, G.: Interface dislocations in superalloy single crystal. Acta Mat., 47, (1999), 2497-2510.
Reed, R.C.; Matan, N.; Cox, D.C.; Rist, M.A., Rae, C.M.F.: Creep of CMSX-4 superalloy single crystals: effects of rafting at high temperature. Acta Mat., 47, (1999), 3367-3381.
Reed, R.C.: The Superalloys - Fundamentals and Applications. Cambridge University Press, Cambridge, UK (2006).
Rowe, J.P., Freeman, J.W.: Relation between microstructure and creep resistance in nickel-base alloys. In: Proceedings of Joint International Conference on Creep, T.A.S.O.M., London, pp. 65-72 (1963).
Royer, A.; Bastie, P., Veron, M.: Temperature dependence of the structural order in the g' phase of nickel base superalloy. Scripta Mat., 40, (1999), 955-961.
Schmidt, R., Feller-Kniepmeier, M.: Equilibrium composition and volume fraction of the g' - phase in a nickel-base superalloy as a function of temperature. Scripta Met. Mat., 26, (1992), 1919-1924.
Serin, K.; Gobenli, G., Eggeler, G.: On the influence of stress state, stress level and temperature on the g-channel widening in the single crystal superalloy CMSX-4. Mat. Sci. Eng. A387-389, (2004), 133-137.
Shenoy, M.; Tjiptowidjojo, Y., Mcdowell, D.: Microstructure-sensitive modeling of polycrystalline IN 100. Int.
J. Plast., 24, (2008), 1694-1730.
Tinga, T.; Brekelmans, W.A.M., Geers, M.G.D.: Time-incremental creep-fatigue damage rule for single crystal Ni-base superalloys. Mat. Sci. Eng., A508, (2009), 200-208.
Wang, G.; Xu, D.S.; Ma, N.; Zhou, N.; Payton, E.J.; Yang, R.; Mills, M.J., Wang, Y.: Simulation study of effects of initial particle size distribution on dissolution. Acta Mat., 57, (2009), 316-325.
Adresseses: Dr. Jonathan Cormier, Laboratoire de Mécanique et Physique des Matériaux, UMR CNRS 6617,
ENSMA, BP 40109, Futuroscope Chasseneuil, Cedex 86961, Poitiers, France. Pr. Georges Cailletaud, Centre des Matériaux, UMR CNRS 7633, MINES Paris Tech, BP 87, 91003 Evry Cedex, France
![Figure 11. Model predictions (bold lines) compared to experiments (dotted lines) under isothermal creep conditions at 1050°C for [101] (a) and [102] (b) oriented single crystals (see standard inverse poles figure in inserts)](https://thumb-eu.123doks.com/thumbv2/123doknet/7756385.254263/14.892.95.804.629.885/predictions-compared-experiments-isothermal-conditions-oriented-crystals-standard.webp)