TRACE MINERALS DEFICIENCY DIAGNOSIS IN RUMINANTS
H. Guyot1 1
University of Liege, Faculty of Veterinary Medicine, Clinical Department of Production Animals, Bovine Ambulatory Clinic, Liège, Belgium.
Correspondence: [email protected]
Introduction
Trace elements are essential in human and animal’s nutrition. They play a major role in health, immunity and reproduction. The production of milk or meat as well as the housing and management conditions of high-performing animals can generate oxidative stress and health troubles in cattle. Some trace elements and vitamins have an anti-oxidative action and increase immunity. The most important trace elements in cattle are selenium (Se), copper (Cu), zinc (Zn), iodine (I), cobalt (Co), molybdene (Mo), manganese (Mn) and iron (Fe). Co is associated with vitamin B12 synthesis in the rumen, so the assessment of Co deficiency can also be done by measuring vitamin B12 blood concentration. The Mo is particularly known for his antagonist effect on Cu absorption. Regarding Mn and Fe, these two elements are generally not deficient in cattle but often in excess in the feed.
Are trace elements deficiencies important in cattle practice?
During the last 20 years, a discrepancy has been observed between the animals’ need and the amount of trace elements given by the ration. The progresses in genetics and cattle performance, as well as the impoverishment of soils have accentuated this disequilibrium. This has consequences on animal’s health, reproduction and productivity. Numerous papers have described the negative effects of trace elements deficiencies on cattle’s health (Graham, 1991). In Europe, trace elements deficiencies are nowadays widely spread in cattle. A recent study (Guyot et al., 2009) presented the Belgian epidemiology of Se, Zn, Cu and I deficiencies in herds with health problems, compared to healthy herds. As expected, lower blood trace elements concentrations were found in unhealthy herds. These concentrations in Belgian herds were compared to those in Ireland and France with similar values (Mee and Rogers, 1994; Enjalbert et al., 2006). These results can be extrapolated to other European countries, as the depletion in the soils and the nutrition of cattle is similar.
Why to diagnose?
There is a wide range of symptoms associated with trace element deficiencies and thus the clinical signs are not pathognomonic. The laboratory is needed to confirm the diagnosis. Moreover, most of the time, the deficiencies are multiple (Guyot et al., 2009) and it is important to know the elements that are deficient in order to adequately correct and avoid competition between minerals. Finally, some trace elements are synergetic, thus the situation might be exacerbated if only one of the 2 minerals is given to face the deficiency (Guyot et al., 2011).
How to diagnose?
*Samples
As previously mentioned, the clinic signs are not sufficient to make a diagnosis. Laboratory analyses are needed to confirm the diagnosis of deficiency. Moreover, samples must be taken
directly from the animals rather than from feedstuffs because the availability and absorption of minerals as well as amounts fed to cattle can widely vary.
Different type of samples can be taken from animals: blood, milk, urine, hair or tissues (principally liver). Blood is the most frequently taken and analysed. Blood samples are easily taken and the modern techniques of assay are accurate, precise, sensitive and fast enough to make a good diagnosis. The inductively coupled plasma – mass spectroscopy (ICP-MS) has recently proven its efficacy at this point of view. Most of the time, blood is centrifuged and plasma or serum are used for ICP-MS assays. Except for Cu (plasma > serum), plasma and serum values are similar. The blood is generally an early indicator of the deficiency phase as serum/plasma represents the transport pool of the mineral. Milk can give an idea of the trace mineral status of a lactating herd. It is very easy to sample but limited to certain elements (Se, I). Urine samples are of low interest, mainly due to the disparity of urine density and thus, concentration within a day. Furthermore, reference ranges are missing. Hair is may be the easiest sample to collect however the accuracy of trace elements determination in this sample is poor and subject to external contaminations. Finally, for some elements (Cu, Co), liver biopsies can be helpful in precisely determining trace elements status of animals. Nevertheless, the liver biopsy is often considered as complicated and risked for patients by numerous European practitioners. Farmers are also generally reluctant to this procedure.
*Sampling
It is not the goal to remind the blood sampling procedure or liver biopsy, but to focus on the misinterpretation that can be made from wrong samples. The major risk is of course the haemolysis that can falsely increase Se, Cu and Zn plasma/serum concentrations. The delay between sampling and analysis may also lead to false results. A long delay will increase the risk of haemolysis but also the diffusion of Se from erythrocytes (contained in glutathione-peroxidase) to serum/plasma. The activity of enzymes (e.g. glutathione-peroxidase or superoxide dismutase) may also decrease with the time. Finally, some tubes with rubber plugs may contain Zn, leading to a false increase of plasma/serum Zn concentration. Specific plastic tubes, without rubber and free of trace of minerals should be used.
Diagnosis of trace elements deficiencies in cattle should be done at a herd level because this is clearly a herd disease. The diagnosis consists in evaluating the nutritional status of the herd. For determining a disease, sick animals should be tested. Thus, for assessing nutritional status, healthy animals should be taken. At a herd level, several healthy animals must be chosen for sampling. The number depends on the deficiency prevalence and the intra-herd variation of trace elements concentration. According to different authors, this number fluctuates from 7 to 15 (Herdt, 2000; Herdt et al., 2000; Guyot and Rollin, 2007). Animals to be sampled must be selected to form a homogeneous group in the target population. Analysis can be made individually or by pool. The pool has the advantage to be less expensive. It is accurate if the number of selected animals is sufficient (about 15 animals) and if the group of sampled animals is homogenous. One pool per target population is necessary. Nevertheless, pool is effective on plasmatic Se, Zn, Cu, I, but is useless for determining activity of glutathione-peroxidase in erythrocytes (GPX), superoxide-dismutase (SOD) or thyroid hormones. While using pool, attention must be paid in the interpretation of results if outliers (heterogeneous group) are present in the sampled population. In general, if the group is homogeneous, an “all-or-nothing” rule is applied as the majority of sampled animals (>70%) are either deficient or healthy (Guyot et al., 2009).
*Source of variation
Haemolysis is a huge source of variation as it artificially increases plasmatic Cu, Zn and Se concentrations. GPX and SOD in the red blood cells contain various amounts of these trace
elements. Inflammation and diseases, as the Cu-containing ceruloplasmine, an inflammatory protein, will secondarily increase plasmatic Cu concentration, acting like a positive acute-phase protein. Concomitantly, a decreased plasmatic Zn concentration will occur while inflammation is present. Inflammation has also an impact on Se metabolism and thyroid hormones (e.g. Euthyroid Sick Syndrome). Other factors, such as gestation, range of lactation, age (calves versus dams) may influence blood trace elements levels. Teat-dipping with I-containing products of I interfere with the diagnosis of I deficiency (in milk or plasma) by trans-cutaneous absorption of I. The administration of some deworming drugs (closantel, nitroxinil) in cattle will also increase, for a quite long period, the plasmatic I. The concentration of Se in milk can vary depending on the form of Se given in the ration with more Se transferred to colostrum or milk while cows fed selenomethionine compared to Na-Selenite. Moreover, at equal dosage of Se in the feed, plasmatic Se and, in a lesser extend, the activity of GPX, reaches higher concentrations if selenomethionine is given in the ration, compared to Na-Selenite. The correlation between GPX and plasmatic Se is well described in the literature; however this correlation may change according to the form of Se as well. In any form of Se, following an oral supplementation, plasmatic Se will increases gradually to reach a steady state between 30-60 days, while GPX will continue to progressively increase at least up to 120 days (Guyot et al., 2007c).
*Analyses and interpretation
Evaluating trace mineral status on blood or animal’s tissues is subject to some limitations and variations. Two different ways are often present: determining nutritional status (e.g. plasmatic or hepatic concentration of the trace element) or functional status (e.g. thyroid hormones, GPX, SOD). Even the thresholds are often discussed. The table 1 proposes different thresholds for assessing nutritional and functional status of the major trace elements Se, Zn, Cu, I and Co. According to the Fig.1, they have been chosen considering the concentration of trace elements needed in order to optimize health, welfare, food quality and productivity and not just avoiding clinical diseases or barely reaching N.R.C. requirements (NRC, 2000 and 2001). Beside this, the blood or tissue (e.g. liver) represents different pools of trace elements in the body. When dietary intakes are not sufficient, the pools of storage and transport will decrease, respectively, but they must be depleted before seeing dysfunction and disease (Fig.2). Ideally for the diagnosis, the storage pool must be sampled but in practice, it is not always accessible.
___________________________________________________________________________
Fig.1: Threshold for determination of correct Fig.2: Representation of the kinetic of the trace element status in cattle (adapted from pools of trace elements, according to the
Chung, 2003). mineral level (from Underwood & Suttle,
1999).
___________________________________________________________________________
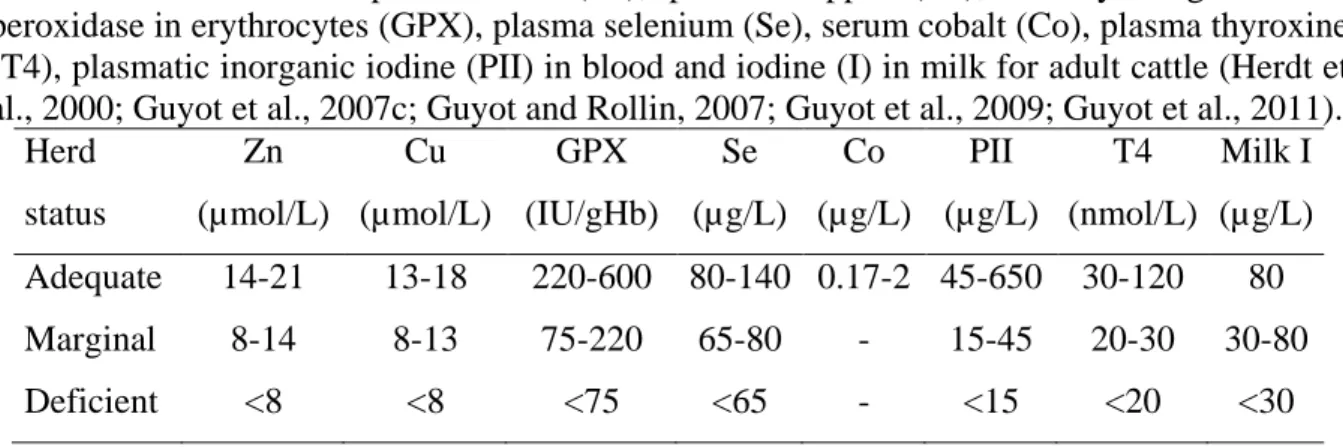
Table 1: Threshold for plasma zinc (Zn), plasma copper (Cu), activity of glutathione peroxidase in erythrocytes (GPX), plasma selenium (Se), serum cobalt (Co), plasma thyroxine (T4), plasmatic inorganic iodine (PII) in blood and iodine (I) in milk for adult cattle (Herdt et al., 2000; Guyot et al., 2007c; Guyot and Rollin, 2007; Guyot et al., 2009; Guyot et al., 2011).
Herd status Zn (µmol/L) Cu (µmol/L) GPX (IU/gHb) Se (µg/L) Co (µg/L) PII (µg/L) T4 (nmol/L) Milk I (µg/L) Adequate 14-21 13-18 220-600 80-140 0.17-2 45-650 30-120 80 Marginal 8-14 8-13 75-220 65-80 - 15-45 20-30 30-80 Deficient <8 <8 <75 <65 - <15 <20 <30 ___________________________________________________________________________
*Specific diagnosis for Se, Cu, Zn, I and Co ° Selenium
Serum/plasma Se is good indicator of dietary intake. Plasma Se is a nutritional marker that quickly increases (within 2-6 days) after oral supplementation (Ellis et al., 1997). For functional marker, or long-term marker, the assay of GPX in red blood cells is often used. Because the Se-containing GPX is formed at the time of erythrocyte’s development, the GPX activity allows determining Se status of the 100-120 previous days (mean of half-life of red blood cells). As Se is well transferred from dam to calf, the cow in late gestation will show lower Se plasma concentration. After calving, Se levels will progressively increase in the dam. In calves, a higher proportion of Se is in the GPX rather than the plasma, so the GPX activities are higher and plasma Se lower, compared to their dams (Guyot et al., 2011). I supplementation has an impact on Se metabolism with low Se status while animals fed supplementary I, compared with I-deficient diets (Pavlata et al., 2005; Guyot et al., 2011). Liver biopsy is also a good means to assess Se status, if realisable. Finally, milk Se can also be assessed but is widely influenced by the form of Se given in the ration (Guyot et al., 2007c).
° Copper
For Cu, the storage pool is the liver. It reflects the long-term availability of dietary Cu. A decreased liver Cu concentration is an early marker of insufficient Cu dietary intake. The most sensitive way to assess Cu deficiency is therefore the liver biopsy, even if in Europe, practitioners and farmers are unenthusiastic to this method of sampling. Instead, plasma/serum Cu is more often used. The transport pool is constituted by the blood and, in a certain extent, also the functional pool. In fact, the ceruloplasmin, a protein of inflammation produced by the liver, contains about 80% of the Cu in the blood. Plasma Cu assessment seems to be better rather than serum because a variable amount of Cu may be captive in the clot. There is a curvilinear relationship between liver and blood Cu concentration. However, hepatic Cu concentration must fall drastically before a decreased blood Cu concentration can be seen (Underwood and Suttle, 1999). Plasma Cu is thus a late (long-term) marker of Cu deficiency but remains useful to be performed at a herd level, with at least 10-15 animals sampled per herd (Herdt, 2000). The SOD is a Cu-containing enzyme sometimes used in determining Cu status but it is very delicate to interpret. Milk Cu does not present interest as Cu milk concentration is usually poor.
° Zinc
The storage pool for Zn is not well-defined, making the evaluation of Zn status tricky. Even if hepatic Zn concentration decreases after a long inadequate Zn dietary intake, the liver Zn is not a good means for assessing Zn status in cattle. Thus, the plasma/serum Zn concentration is preferred because it is reduced in Zn deficiency. However, there might be dysfunctions (e.g. reduced feed efficiency) before observing a decreased serum Zn concentration. A low serum Zn concentration is indicative of a deficiency while a normal serum Zn does not necessarily plead for a deficiency (Underwood and Suttle, 1999).
° Iodine
I deficiency can also be assessed by nutritional or functional markers. For the nutritional ones, the most used is the plasmatic inorganic iodine (PII). The PII reflects the dietary I intake and its concentration fluctuates very quickly according to the I fed in the ration. For functional markers, the hypothalamus-pituitary-thyroid axis is investigated with thyroid stimulating hormone (TSH) and total thyroid hormones (thyroxine T4 or tri-iodo-thyronine T3) (Guyot et al., 2011). Huge variations can physiologically exist (pregnancy, circadian rhythm, birth, age) and are important to be included in the interpretation of the status. Clinical pathology laboratories can easily assay thyroid hormones while there is no laboratory able to measure bovine TSH at the moment. TSH, T4 and T3 are usually taken for diagnosing hypothyroidism, originates, in cattle, mainly from I deficiency (Guyot et al., 2007a,b). Total blood I is constituted with PII and I from thyroid hormones, setting the interpretation of a short-term and long-term marker not obvious. Milk I can be used for assessing herd I status. It also vary quickly with dietary I, but in a lesser extent than PII. On the field, weighing thyroid gland in (stillborn or goitrous) calves is useful to appreciate I status. The maximal weight of the gland has been determined as follows (Hernandez et al., 1972): Y (weight of thyroid gland, in grams) = 0.348 x Z0.944 (Z is the body weight, in kg).
° Cobalt
Co status in ruminants can be determined by Co or vitamin B12 blood concentration. Vitamin B12 is constituted with 4% of Co. The blood concentration of these two elements is very low, necessitating highly-performing techniques of dosage (ICP-MS, radioimmunoassay, chemiluminescence, high-performance liquid chromatography). As liver contains the largest concentration of Co, it is the sample of choice and represents the storage pool of Co. Nevertheless, there is a variable proportion of Co that is not associated with vitamin B12, inducing misinterpretation of Co status either in liver or in blood. Correlation between serum Co and serum vitamin B12 is low. According to these elements, the assessment of Co status in ruminants, either in liver or blood, is complicated and poorly reliable with routine laboratory assays (Underwood and Suttle, 1999: Herdt et al., 2000).
Conclusions
Trace elements deficiencies are frequent in Europe in cattle. As there are no pathognomic signs, clinical pathology diagnosis is necessary. Sampling at a herd-level increases the reliability of the diagnosis, if samples are taken from a homogeneous group of healthy animals. Blood is most often used because of its higher feasibility on the field. But the storage pool, that is the most effective one for assessing mineral status, is not always represented by the blood. Specific herd thresholds for determining trace elements status in cattle must include health, welfare, food quality and productivity.
References
Chung TK. Make the most of vitamin supplementation. Poultry Int. 2003;1:28-32. Ellis RG, Herdt TH, Stowe HD. Physical, hematologic, biochemical, and immunologic effects of supranutritional supplementation with dietary selenium in Holstein cows. Am J Vet Res. 1997;58:760-764.
Enjalbert F, Lebreton P, Salat O. Effects of copper, zinc and selenium status on performance and health in commercial dairy and beef herds: Retrospective study. J Anim Physiol Anim Nutr. 2006;90:459-466.
Graham TW. Trace elements deficiencies in cattle. Vet Clin North Am Food Anim Pract 1991;7:153-215.
Guyot H, Sulon J, Beckers J-F, Closset J, Lebreton P, Alves de Oliveira L, Rollin F. Development and validation of a radioimmunoassay for thyrotropin in cattle. J Vet Diagn Invest. 2007a;19:643-651.
Guyot H, Lebreton P, Alves de Oliveira L, Sulon J,Beckers J-F, Rollin F. Thyrotropin in newborn calves as a tool for diagnosing hypothyroidism. Cattle Pract. 2007b;15:271-275.
Guyot H, Spring P, Andrieu S, Rollin F. Comparative responses to sodium selenite and organic selenium supplements in Belgian Blue cows and calves. Livestock Sci. 2007c;111:259-263.
Guyot H, Rollin F. Le diagnostic des carences en Iode et Sélénium chez les bovins. Ann Med Vet. 2007;151:166-191.
Guyot H, Saegerman C, Lebreton P, Sandersen C, Rollin F. Epidemiology of trace elements deficiencies in Belgian beef and dairy cattle herds. J Trace Elem Med Biol. 2009;23:116-123.
Guyot H, Alves de Oliveira L, Ramery E, Beckers J-F, Rollin F. Effect of a combined iodine and selenium supplementation on I and Se status of cows and their calves. J Trace Elem Med Biol. 2011;25:118-124.
Herdt HT. Variability characteristics and test selection in herd-level nutritional and metabolic profile testing. Vet Clin North Am Food Anim Pract. 2000;16:387-383.
Herdt HT, Rumbeiha W., Braselton WE. The use of blood analyses to evaluate mineral status in livestock. Vet Clin North Am Food Anim Pract. 2000;16:423-444.
Hernandez MV, Etta KM, Reineke EP, Oxender WD, Hafs HD. Thyroid function in the prenatal and neonatal bovine. J Anim Sci. 1972;34:780-785.
Mee JF, Rogers PAM. Base-line survey of blood trace element status of 50 dairy herds in the south of Ireland in the spring and autumn of 1991. Irish Vet J. 1994;47:115-122.
National Research Council (NRC). Nutrient requirements of beef cattle. 7th ed. Washington DC: National Academy Press; 2000: 248p.
National Research Council (NRC). Nutrient requirements of dairy cattle. 7th ed. Washington DC: National Academy Press; 2001:408p.
Pavlata L, Slosarkova S, Fleischer P, Pechova A. Effects of increased iodine supply on the selenium status of kids. Vet Med.-Czech. 2005;50:186-194.
Underwood EJ, Suttle NF. The Mineral Nutrition of Livestock. 3rd ed. Oxon: CABI Publishing; 1999.