2nd International Engineering Mechanics and Materials Specialty Conference
le 2èCongrès international de mécanique et des matériaux
Ottawa, Ontario
June 14-17, 2011 / 14 au 17 juin 2011
A Two Degree of Freedom Kinematic Model for Predicting the
Deformations of Deep Beams
B. Mihaylov, E.C. Bentz, and M.P. Collins
Department of Civil Engineering, University of Toronto, Toronto, Ontario, Canada.
Abstract: In modern construction, it is not unusual to require a short span member to carry a very large load such as with a transfer girder. These members generally have high shear strengths with strut-and-tie models being able to predict these strengths generally in a conservative manner. For serviceability checks, cracked stiffness estimates, and seismic design, however, it is also important to be able to predict the deformations of the member accurately. In this paper a set of eight large and heavily instrumented reinforced concrete deep beams subjected to monotonic or cyclic loading are summarized. The displacements of these tests are explained in detail with particular attention paid to the development of deformations over the full load history. From these deformations, the paper notes that a simple 2 degree of freedom (DOF) kinematic model can be developed to predict the entire displacement field for a beam after diagonal cracking has occurred. These two degrees of freedom are the average longitudinal strain in the flexural reinforcement, and the vertical distortion of the critical loading zone near the applied load. When the results of the measured displacements of the beam tests are compared to the pattern of deformations from the 2 DOF model, excellent agreement is obtained. In addition, it is shown that the width of the main diagonal crack can also be explained well using the same 2 DOF model once these parameters are known. A forthcoming paper will explain how these parameters themselves can be predicted.
1. Introduction
The behaviour of reinforced concrete structures is most accurately predicted when the analytical model includes equilibrium equations, conditions for compatibility of deformations, and constitutive relations for the cracked concrete and the reinforcement. An example of such an approach is the Modified Compression Field Theory (MCFT) (Vecchio and Collins 1986) which, when combined with compatibility conditions derived from the plane sections hypothesis, provides elegant and accurate equations for analysis and design of slender beams, columns, and slabs (Collins et al. 2002). Similarly simple and accurate equations are not available for deep beams as in these members plane sections do not remain plane. Deep beams are usually modeled by strut-and-tie (or truss) models which are based on the lower bound theorem of plasticity and usually provide conservative strength predictions. These strut-and-tie models do not provide predictions of deformations, however. Deformation predictions are important for serviceability checks, stiffness value predictions for complex structural analyses, and seismic design
freedom similar to the curvature and longitudinal strains used for slender beams. This paper will explain the process used to develop such a kinematic model for deep beams based on two general degrees of freedom (DOF).
2. Experimental Program
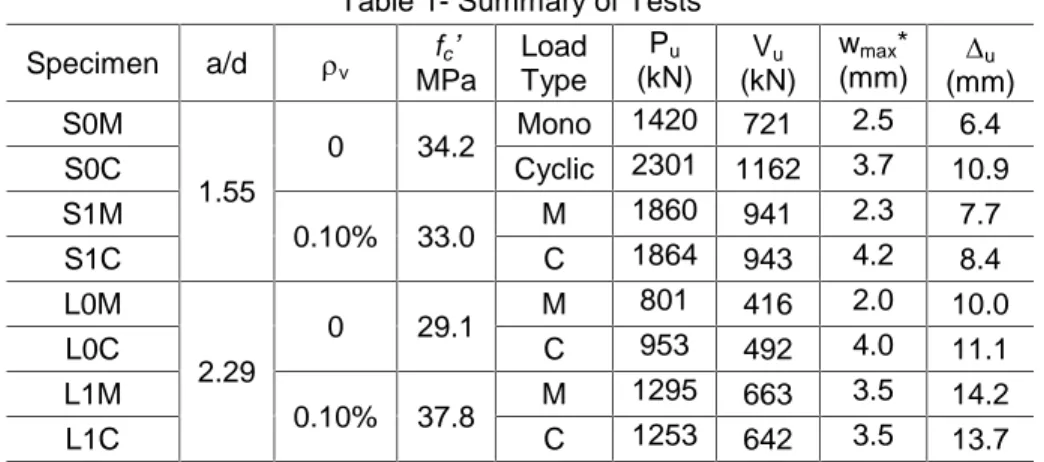
The theory presented in this paper was developed with the help of an experimental program performed at University of Toronto (Mihaylov 2008, Mihaylov et al. 2010). The program included 8 tests of deep reinforced concrete beams subjected to symmetrical three-point bending applied in either a monotonic or a fully-reversed cyclic manner. The beams had a 400 mm by 1200 mm rectangular cross section with symmetrical top and bottom reinforcement of 6#8 headed steel deformed bars. In addition to the type of loading, experimental variables were also the shear-span-to-depth ratio (a/d=1.55 or 2.29) and the amount of transverse web reinforcement (v=0% or 0.1%). Table 1 summarizes the properties of the specimens together with important test results such as the maximum applied load Pu, the shear strength Vu, the ultimate midspan displacement u, and the maximum width of the diagonal cracks wmax. In the names of the specimens S/L stands for short/long, 0/1, stands for 0%/0.1% of transverse reinforcement, and M/C stands for monotonic/cyclic loading. Figure 1 shows the geometry of the specimens, material properties and other details of the tests. Figure 2 shows a photograph of specimen S1C in the test setup for reversed cyclic loading. The downward (positive) load was applied on the top face of the beam and was reacted by roller supports on the bottom face, while the upward (negative) load was applied on the bottom face and was reacted by steel sections placed on top.
Figure 3 shows the envelopes of the measured load-displacement responses of the eight specimens. All beams failed in shear with crushing of the concrete in the vicinity of the top loading plate prior to yielding of the longitudinal reinforcement. As evident from Fig. 3, load reversals had almost no effect on the response of specimens with transverse reinforcement as the curves for S1C and L1C almost overlap with the curves for S1M and L1M, respectively. Somewhat surprisingly, specimens without stirrups S0C and L0C subjected to cyclic loading were stronger than their companion specimens S0M and L0M tested monotonically. Particularly striking were the results from the two short beams without stirrups as specimen S0C was 62% stronger than its companion specimen S0M. This and other interesting results from the experimental program are discussed elsewhere (Mihaylov et al. 2010).
Table 1- Summary of Tests
Specimen a/d v fc’ MPa Load Type Pu (kN) Vu (kN) wmax* (mm) u (mm) S0M 1.55 0 34.2 Mono 1420 721 2.5 6.4 S0C Cyclic 2301 1162 3.7 10.9 S1M 0.10% 33.0 M 1860 941 2.3 7.7 S1C C 1864 943 4.2 8.4 L0M 2.29 0 29.1 M 801 416 2.0 10.0 L0C C 953 492 4.0 11.1 L1M 0.10% 37.8 M 1295 663 3.5 14.2 L1C C 1253 642 3.5 13.7
400/300/51 steel plate 47 47 47 47 175 350 Specimens S1M/C Specimens S0M/C a=2500 2500 5500 Specimens L1M/C Specimens L0M/C 1200 250 250 heads 400 1120 320 64 85 60 64 6#8 6#8 #3@350mm 510 500 510 1100 400/150/51steel plate 340 400 320 64 85 64 6#8 6#8 stirrups 400 1120 320 64 85 60 64 6#8 6#8 #3@350mm stirrups 1200 heads a=1700 1700 3900 250 250 2 lifting hooks 15M 400/150/51 steel plate 400/300/51 steel plate 2 lifting hooks 15M 175 350 340 f '=37.8 MPac f '=29.1 MPac f '=33.0 MPac f '=34.2 MPac d= 109 4 400 320 64 85 64 6#8 6#8 d= 109 4 a =20 mm f =652 MPag y f =490 MPavy All specimens: 1 0 2 3 4 5 6 7 0 0.05 0.10 0.15 0.20 0.25 a/d bdf 'c f '=27.2MPa (3.95ksi)c d=538mm (21.2in) =2.73% l f =372MPa (54.0ksi)y a T d interlock Aggregate Critical crack
action Dowel T=0 zones Crushing T = Tma x V V V V Tests: Beam action Arch action T T d a T FT FB 2 LS1 6 8 10 3 4 5 7 9 11 0 1 shear cracking st F 8 f =862 MPau f =600 MPavu
Figure 1: Details of Specimens
Figure 2: Specimen S0C and test setup Figure 3: Load-displacement response
0 2 4 6 8 10 12 14 16 0 500 1000 1500 2000 2500 , mm P, k N 0 0.1 0.2 0.3 0.4 0.5 0.6 0 100 200 300 400 500 , in P, k ip 1st diag. cracking diag. cracking near support L0M L0C L1M L1C S0M S0C S1M&S1C
the failed beam. The crack diagrams correspond to load stages (LS) with increasing downward load (LS0 to LS26) while the deformed shapes drawn between the crack diagrams give the incremental change of deformations in the beam between two load stages. These deformed shapes were obtained from the readings of demountable displacements transducers (Zurich gauges) used on a 300 mm by 300 mm square grid of Zurich targets. The dashed lines on the crack diagrams in Fig. 4 depict the variation of bottom reinforcement stress determined with strain gauges at a number of locations along the length of the beam. The crack diagram at LS26 and the deformed shape underneath it show the state of deformations in the specimen under maximum load. All deformed shapes in Fig. 4 were magnified to produce a maximum vertical displacement of 200 mm, while the real displacement increments are indicated on the diagrams as fractions of the ultimate displacement, e.g.u=8.4 mm.
Specimen S1C behaved linearly up to a load of about 500 kN when flexural cracks began to occur at midspan as evident from LS1 in Fig. 4. Initially the deformations were predominantly flexural with a concentration of curvature at the cracked portion of the beam (see the incremental deformed shape between LS0 and LS1). The stresses in the bottom reinforcement were largest at the midspan section (125 MPa) and decreased to zero near the supports (see the dashed line on the crack diagram at LS1). This stress profile indicates a change in reinforcement stress between the supports and midspan and, thus, the presence of significant bond stresses between the bars and the surrounding concrete which is characteristic of beam action. As the load increases, the bond stresses force diagonal cracks to propagate from the bottom part of the section to the vicinity of the loading plate (see LS2 in Fig. 4). The diagonal cracking results in a more uniform distribution of the tension along the bottom reinforcement (see the stress profile at LS2) and engages the transverse reinforcement in tension. When the load has sufficiently increased that the cracking reaches the supports, the load-bearing mechanism has transitioned from beam action to truss action. Truss action is characterized by a significant portion of the shear force being carried above the diagonal cracks through direct compression between the loading and support points. In specimen S1C this transition took place between LS1 and LS2 at a load of about 1000 kN. The truss action in S1C under a load of 1300 kN is demonstrated schematically through the simple strut-and-tie model drawn on the crack diagram at LS2. It can be seen from this model that the stirrups (vertical ties), which yielded upon diagonal cracking, reduced the tension in the bottom reinforcement (horizontal tie) towards the supports. In contrast, deep beams without web reinforcement develop constant tension in the bottom reinforcement from support to support in which case the load is carried as in a tied arch (arch action) (Mihaylov et al. 2010).
The strut-and-tie model in Fig. 4 also shows that a large portion of the shear force in S1C had to be resisted above the diagonal cracks in the relatively shallow zone near the edge of the loading plate. This zone will be referred to as the critical loading zone (CLZ). The incremental deformed shapes following the formation of the major diagonal cracks (at LS2 and beyond) clearly show significant shear distortions of the CLZ accompanied by large shear deformations along the major diagonal cracks. It can also be seen that the load increment of 184 kN between LS16 and LS22 caused larger shear distortion than the previous increment of 380 kN between LS2 and LS16. Prior to failure, the beam sustained three fully-reversed load cycles at maximum load with load stages LS22 and LS26 in Fig. 4 corresponding to the peak positive load on the first and third of these cycles. It can be seen that the cyclic load caused further distortion of the CLZ and widening of the critical diagonal crack from 3 mm at LS22 to 4.2 mm at LS26. Eventually, the crushing of the CLZ on the right hand side of the loading plate caused the failure of specimen S1C at a load of 1864 kN and a midspan displacement of 8.4 mm.
The Shear Kinematic Theory (Mihaylov et al. 2011) concerns the behaviour of deep beams after the formation of truss action. This paper focuses on a key aspect of the theory, namely the description of the deformations in deep beams (kinematics of deep beams) after the formation of major diagonal cracks.
P=0kN LS0 Zurich targets Strain gauges P=650kN LS1 P=1300kN LS2 East end P=1680kN LS16 P=1864kN LS22 P=1864kN LS26 P=0kN LS0 Zurich targets Strain gauges P=650kN LS1 P=1300kN LS2 East end P=1864kN LS26 P=1300kN LS2 CLZ strut tie P=1680kN LS16 LS22 P=380kN /u=0.24 P=650kN /u=0.09 P=650kN /u=0.43 /u=0.09 P=0kN P=Pu=1864 kN u=8.4 mm
3. Kinematics of Deep Beams
At low applied loads in a non-deep slender member, the kinematics can be elegantly summarized by the basic rule that plane sections remain plane. That is, at any location, a transverse line drawn on the surface of the beam prior to bending will remain as a straight line after bending. This is the assumption upon which beam theory is based which allows the full load deformation of the beam to be predicted. For deep beams such as those in this paper, the “plane sections” rule will be approximately true prior to beam action breaking down but after the major diagonal cracks have formed, it will be significantly in error. In Fig. 4 between LS0 and LS1, the vertical lines on the incremental displaced shape are approximately straight lines consistent with beam action. Between LS2 and LS16, by contrast, the vertical lines are shown to be significantly warped demonstrating that the plane sections rule no longer applies. If a rule could be developed that describes the deformed shape of deep beams after the main diagonal cracks had formed, it would be possible to predict the full load-deformation history of these beams just as it is for cracked slender beams. These deformation predictions can be important for serviceability checks and seismic design considerations.
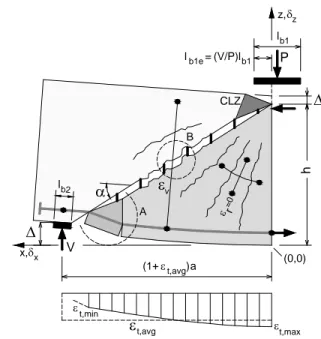
A careful examination of the crack diagrams and deformed shapes in Fig. 4 reveals deformation patterns which can be used to establish the kinematics of deep beams. The widest diagonal crack in specimen S1C at LS2 divided the critical shear span of the beam into a cracked bottom triangular zone and an uncracked triangular top zone. At higher positive loads, the top triangular zone had become cracked due to load reversals, but the widths of these cracks can be seen to be small. As a result of the different degrees of cracking of the bottom and top zones, the top concrete block remained relatively rigid in comparison to the bottom zone. This is evident from the greyscale map in Fig. 4 which shows the distribution of the generalized deformation |1|+|2| across the side face of specimen S1C at failure. In this map the block above the critical crack is mostly white, indicating small deformations, while the zone below the critical crack is gray, indicating larger deformations. Also note in the same diagram that the right-hand edge of the beam and the top edge away from the CLZ remained straight compared to the visibly curved bottom edge of the beam. Since the block above the critical crack remained mostly undeformed, it can be represented by a rigid body which undergoes translations in the horizontal and vertical directions, and a rotation about the loading point. Furthermore, the horizontal translation of the top block can be neglected as it is very small compared to the vertical translation. The rotation of the top block around the loading point will be proportional to the elongation of the bottom reinforcement. The vertical translation of the top block will equal to the transverse displacement in the critical loading zone. The average strain along the bottom reinforcement,t,avg, and the shear displacement of the CLZ,c, are the two degrees of freedom of the kinematic model presented in this paper.
Figure 5 shows the two degrees of freedom in the kinematic model. In this model the cracked concrete below the critical crack is represented by a series of rigid struts (r=0) connected to the bottom reinforcement and the loading point. These struts represent the concrete between the approximately radial cracks which occur in deep beams. The strain along the bottom reinforcement is assumed constant and equal to the average strain t,avg. The rigid block above the critical diagonal crack and the cracked concrete below the crack are connected by the CLZ at the top of the beam and by the flexural reinforcement at the inner edge of the support along with the stirrups. It can be seen that the CLZ is modeled by a single triangular element which has large compressive strains parallel to the critical crack and zero horizontal strains. The modeling of the critical loading zone represents a very important component of the Shear Kinematic Theory as it is the critical mechanism of shear resistance in deep beams. Detailed information about the modeling of the CLZ can be found elsewhere (Mihaylov et al. 2011).
Based on the above assumptions, the displacement of any given point on the beam outside the CLZ and away from the inner edge of the support can expressed by the two DOFs of the kinematic model as follows:
d
P
b1 l
c z,zh
c t a t,avg (1+ ) d DOFt,avg DOF c c D l D l a t,avg V P b1 (V/P)l b1 l
c r
v b2 l t,min t,max (1+ ) B CLZ =0 b1e l = A
t,avg x, z, x z
h (0,0)
2 .5 (h -d ) slip w B D l A 2 .5 (h -d ) slip w B D l A Figure 5: 2DOF Kinematic model
- Points under the critical crack - Points above the critical crack
[1]
x
t,avgx
[2]
z
h
x
avg t z
2 ,
[3]
h
z
h
l
a
b avg t x
2 ,5
.
0
[4] z tavg bx
ch
l
a
2 ,5
.
0
These equations were applied to the critical shear spans of the beams from the experimental study at the last load stages performed under positive and negative applied load. The two degrees of freedom of the model,t,avgandc, were calculated using a genetic algorithm which minimized the sum of the squares of the error between the measured target displacements and Eqns. 1-4. Figure 6 compares the measured deformed shapes illustrated by displaced grids to the calculated location of the Zurich targets shown with circles. It can be immediately seen that the kinematic model with only two DOFs provides an excellent fit to the apparently complex pattern of deformations in deep beams under both monotonic and reversed cyclic load. Along the diagonal crack itself, a few points can be seen to be poorly predicted often due to relative location of the somewhat random diagonal crack compared to the targets. The model seems to be slightly less accurate for the cases of negative load (see for example S1C) which can be explained by the fact that the wide critical diagonal cracks caused by positive load do not close perfectly upon load reversal. In addition, the impact of the additional reinforcement provided by the lifting hooks (See Fig. 2) can be seen for the negative load cases. It is interesting to note that the shape of the flexural tension side of the beams is indeed parabolic as suggested by Eq. 2.
[5]
1
cos
sin
2
,
n
l
w
tavg D c
In the first term the length lD is the distance between the kinks in the bottom reinforcing bars near the support (See Detail A, Fig. 5). It is assumed that the elongation of the bars over this distance causes the widening of the crack associated with DOFt,avg. Length lDcan be estimated from:
[6]
l
D
2
.
5
h
d
cot
s
maxwhere 2.5(h-d) is the approximate depth of well-controlled cracks at the bottom of the section and smaxis the maximum distance between these cracks along the length of the bottom reinforcement (CEB-FIP Model Code 1990).
In the second term of Eq. 5 quantity n denotes the number of diagonal cracks above the critical diagonal crack which occur if the beam contains a sufficient amount of transverse reinforcement. These cracks reduce the width of the critical crack for the same shear displacement c (crack control). An expression for n can be derived based on the crack-spacing equations of the CEB-FIP Model Code 1990.
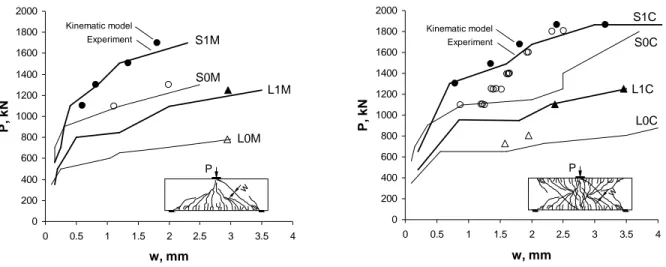
In Fig. 7 the results from Eq. 5 are compared to the measured maximum width of the critical diagonal cracks in the specimens from the experimental program. The values of DOFst,avgand care the same as those used in Fig. 6, length lDequals 355 mm for the short beams and 530 mm for the long beams, and n equals zero for all specimens. It can be seen that the kinematic model provided excellent predictions for all beams except for S0C subjected to reversed cyclic load. It is suspected that the discrepancy for this specimen came mainly from the inaccurate prediction of length lD. In reality this length is very sensitive to the pattern of the cracks near the supports which can differ significantly even between nominally identical members. Note that there are no crack predictions at the early stages of loading where the load is carried by beam action and the kinematic model does not apply.
4. Shear Resisting Mechanisms in Deep Beams
The kinematic model described above can be used to examine the shear resisting mechanisms in deep beams and to formulate simple conditions for the compatibility between the deformations associated with these mechanisms. For example, it can be seen from Fig. 5 that DOF c, associated with the shear carried in the critical loading zone, is equal to the transverse displacement in the flexural reinforcement near the support, associated with dowel action. The maximum shear that can be resisted by the dowel action will be reduced by the tension in the reinforcement which is proportional to the value of DOFt,avg. It can also be seen from Fig. 5 that the average tensile strain in the transverse reinforcementv, related to the shear carried by the stirrups, can be expressed as a function of the two DOFs of the kinematic model
c and t,avg. Most interestingly, the kinematic model reveals that shear in deep beams is carried also through aggregate interlock which is completely neglected in strut-and-tie models and in most models for shear strength of deep beams. Detail B in Fig. 5 shows clearly that in addition to the crack widening due tocandt,avg, the critical diagonal crack also undergoes a significant slip which is expressed as:
[7]
slip
csin
As the crack surfaces are rough, the slip along the crack generates shear by aggregate interlock.
If the compatibility conditions derived from the kinematic model are combined with equilibrium equations and proper constitutive relations, then the two degrees of freedom of the model c and t,avg can be calculated (Mihaylov et al. 2011).
L0M: P=780 kN,t,avg=1.75 mm/m,c=1.83 mm S0M: P=1300 kN,t,avg=1.71 mm/m,c=1.83 mm L0C: P=805 kN,t,avg=1.30 mm/m,c=1.10 mm S0C: P=1800 kN,t,avg=2.42 mm/m,c=2.22 mm L1M: P=1250 kN,t,avg=2.28 mm/m,c=1.38 mm S1M: P=1700 kN,t,avg=2.44 mm/m,c=1.35 mm L1C: P=1250 kN,t,avg=2.13 mm/m,c=2.08 mm S1C: P=1860 kN,t,avg=2.58 mm/m,c=2.97 mm L0C: P=-870 kN,t,avg=1.51 mm/m,c=0.32 mm S0C: P=-1850 kN,t,avg=2.68 mm/m,c=1.07 mm Kinematic model Experiment
Figure 7: Prediction of crack widths
5. Conclusions
This paper presented a kinematic model with only 2 degrees of freedom capable of describing the complete deformed shape of diagonally cracked deep beams. The degrees of freedom of the model are the average strain along the flexural reinforcement and the shear displacement in the critical loading zone of the beam. The model produced an excellent fit to the measured deformed shapes of eight tests of deep beams subjected to monotonic and reversed cyclic loading. It was shown that the kinematic model can provide simple and accurate equations for the calculation of the maximum width of the diagonal cracks in deep beams. Most importantly, the kinematic model provides compatibility conditions between the deformations associated with the shear resisting mechanisms in deep beams. These equations can be used together with equilibrium equations and proper constitutive relations to predict the ultimate response of deep beams (Mihaylov et al. 2011).
6. References
CEB-FIP Model Code 1990, Design Code, Thomas Telford, London, 1993; 437 p.
Collins, M.P., Bentz, E.C., and Kim, Y.J., Shear Strength of Circular Reinforced Concrete Columns, ACI
Special Publication SP-197, 2002: 45-86.
Mihaylov, B.I., Behavior of Deep Reinforced Concrete Beams Under Monotonic and Reversed Cyclic Load, Doctoral Thesis, European School for Advanced Studies in Reduction of Seismic Risk, Pavia,
Italy, 2008; 379 p.
Mihaylov, B.I., Bentz, E.C, Collins, M.P., Shear-Kinematics Theory for Predicting Shear Strength and Ultimate Deformations of Deep Beams, To be submitted to ACI Structural Journal, April 2011.
Mihaylov, B.I., Bentz, E.C., Collins, M.P., Behavior of Large Deep Beams Subjected to Monotonic and Reversed Cyclic Shear, ACI Structural Journal, 2010; 107(6): 726-734
Vecchio, F.J., Collins M.P., The Modified Compression Field Theory for Reinforced Concrete Elements Subjected to Shear, ACI Journal, 1986, 83(2): 219-231.
0 200 400 600 800 1000 1200 1400 1600 1800 2000 0 0.5 1 1.5 2 2.5 3 3.5 4 w, mm P , k N P w S1C S0C L1C L0C Kinematic model Experiment 0 200 400 600 800 1000 1200 1400 1600 1800 2000 0 0.5 1 1.5 2 2.5 3 3.5 4 w, mm P , k N S1M S0M L1M L0M Kinematic model Experiment P P w