APPLICATION OF A DATA MINING BASED TECHNIQUE FOR THE
EVALUATION OF TRANSMISSION EXPANSION PLANS
Christophe Druet
1Elia System Operator Brussels, Belgium [email protected]
1Corresponding author
Stefano Vassena, Patricia Rousseaux, Louis Wehenkel
Department of Electrical Engineering and Computer Science University of Li`ege – Sart Tilman B28 – B-4000 Li`ege, Belgium{vassena,pat,lwh}@montefiore.ulg.ac.be
Abstract - This paper describes a methodology for the study of long-term network planning under uncertainties. In this approach the major external uncertainties during the planning horizon are modelled as macro-scenarios at differ-ent future time instants. The random nature of actual oper-ating conditions is taken into account by using a probabilis-tic model of micro-scenarios based on past statisprobabilis-tics. Monte-Carlo simulations are used to generate and simulate a speci-fied number of scenarios. Data mining techniques are then applied to the simulations results collected in a database, so as to extract information and to rank scenarios and net-work reinforcements according to different performance cri-teria. The paper describes the application of this approach on a real transmission planning problem faced by the Bel-gian transmission system operator.
Keywords - Data Mining, power system planning, probabilistic method, random sampling, Monte-Carlo, real example
1 INTRODUCTION
In Europe, the transmission system operator (TSO) is responsible for operating, maintaining and developing the high voltage grid. The liberalisation of the electric sector means that the transmission system operator should leave maximum freedom to the transactions, while ensuring the system security and providing access to the grid in a non-discriminatory way. At the same time each TSO is asked to minimise his own costs and to justify them in a trans-parent way.
In this context, transmission system planning tends to become more and more difficult, in particular due to the highly uncertain nature of the environment. Of course, load demand growth and unscheduled exchanges with neighbouring systems are the major sources of uncertain-ties in transmission system planning. However today, af-ter the un-bundling of electrical companies, the operation of the existing generation plants, the de-commissioning of generation units, and the location of future power plants become more and more blurred. Moreover, because of the heterogeneous characteristics of the various energy mar-kets, due to different economic, political, social and
reg-ulatory environments, diverse ways of adapting transmis-sion planning functions should be considered. Successful transmission planning functions should handle as main un-certainties the size and the location of new power plants, the de-commissioning of existing power plants, the growth of customer demand, the growth of embedded generation, the evolution of transit flows and the amount of power im-ported/exported.
Several approaches have already been proposed and implemented [1]. Those approaches can be classified as deterministic and probabilistic [2, 3, 4]. Deterministic ap-proaches analyse, on a case-by-case basis, a certain num-ber of reference scenarios by simulating them and evalu-ating security criteria. Probabilistic approaches generalise this principle by analysing (either explicitly or implicitly) a much larger number of scenarios and by taking into ac-count their probability of occurrence [5].
The approach described in this paper is part of a gen-eral effort made by the Belgian TSO to improve method-ologies so as to cope in a more efficient way with the ex-pansion planning process. It has been developed within a research collaboration between ELIA (Belgian TSO) and the University of Li`ege. It should be considered both de-terministic and probabilistic. Indeed, on the first hand, the major external uncertainties during the planning hori-zon are modelled as an enumeration of envisaged macro-scenarios, i.e. combinations of high-level hypotheses, at different future time instants. On the other hand, the ran-dom nature of actual operating conditions is taken into ac-count by sampling a probabilistic model generating micro-scenarios induced from past statistics. Monte-Carlo sim-ulations are used to generate a database of system evolu-tion scenarios. Data mining techniques are then applied to analyse the results and to evaluate the planning options. The resulting methodology and software tools were first presented in [7]; the present paper focuses on their appli-cation to a real transmission planning problem faced by the Belgian TSO, with the objective of determining the ef-ficiency in terms of security margins with respect to the different high-level hypotheses of transmission network reinforcements on the South border of the Belgian system. The rest of the paper is organised as follows. Section 2 describes the main steps of the approach, whereas Section
3 focuses on the particular study carried out on the Bel-gian grid. Section 4 provides conclusions and main future directions of work.
2 APPROACH
2.1 The problem
Every considered network expansion option should be evaluated under the point of view of security, flexibility, and robustness. Our methodology compares network re-inforcement solutions regarding the compromise between security and costs through different system evolutions. Therefore those solutions should be evaluated in a sev-eral years planning horizon taking into account the uncer-tainties related to this period. The selection criteria are based on levels of flexibility and robustness of the devel-opment options. The robustness represents the capabil-ity of a development option to face the system evolution, while the flexibility gives a measure of its capability to be re-oriented after a given amount of time, according to the actual system evolution.
2.2 General principle
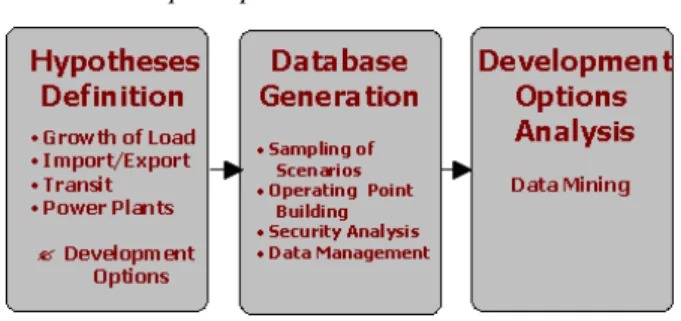
Figure 1: The different steps
Figure 1 shows the different steps of the methodol-ogy. First several hypotheses are chosen by experts in or-der to define the range of the study in terms of macro-scenarios, planning options and contingency lists; the specification of sampling distributions is obtained from past statistics. The database is then populated automati-cally using Monte-Carlo sampling and numerical simula-tions. Finally, the results are analysed using data mining techniques in order to evaluate and compare the develop-ment options.
2.2.1 Hypotheses Definition
In our nomenclature, a reinforcement is defined as an installation or change of a particular network equipment and a development option as a collection of reinforcements taken at particular time instants during the planning hori-zon. Figure 2 illustrates a case where the planning horizon is seven years and where one macro-scenario is consid-ered at t0, two macro-scenarios at time t0+2, and three at time t0+7. Every development option is assessed accord-ing to those different hypotheses. A power system state at a given time is called micro-scenario. A macro-scenario consists in a set of micro-scenarios corresponding to a hy-pothesis of parameters uncontrolled by the planner (e.g. peak load, import and transit at a given time). A temporal
sequence of macro-scenarios corresponding to a possible network temporal evolution is called a trajectory.
Figure 2: Hypotheses space
From an a priori defined set of possible reinforce-ments, a set of candidate development options is con-structed, specifying which reinforcements are combined and at which time instant they apply. At each time step of the planning horizon, a set of macro-scenarios is specified. These macro-scenarios represent combinations of assump-tions concerning the main sources of uncertainties, which are not under the control of the planner, such as future load demand growth, import, transit, size and location of new power plants. Note that each macro-scenario consists in a virtually infinite set of possible operating conditions, the so called micro-scenarios, corresponding to the predefined assumptions combined with random variations of network topology to simulate somehow the maintenance, load de-mand and generation pattern. The micro-scenarios are au-tomatically generated by Monte-Carlo simulations, based on past statistics and on the macro-scenario specification. The hypotheses are based on a priori information such as system knowledge (possibly interesting reinforcements determined by the deterministic planning) and medium and long-term forecasts (plausible macro-scenario speci-fications).
2.2.2 Database generation
In order to carry out differential analyses among macro-scenarios, reference micro-scenarios have been used in such a way that the variance on different observed indices is mainly due to the high-level hypotheses. For every macro-scenario, each simulated micro-scenario is then related to a reference micro-scenario. Each reference micro-scenario is randomly determined by selecting on-line network equipments and generators and by generating a load pattern defining how the load is distributed among individual buses and types of consumers. This random sampling is driven by a probabilistic model based on past statistics. The number of reference micro-scenarios needs to be sufficiently large (at least a few hundred samples) to be statistically representative of the possible system oper-ating points.
Once the reference scenarios have been generated, the micro-scenarios corresponding to each macro-scenario are computed. The generating units are dispatched according
to a classical economic dispatch1. Then an optimal power
flow software (OPF) is used to compute a realistic and fea-sible initial operating point, in terms of Mvar scheduling (see [7] for more details about the OPF application). The static security of the obtained network state is evaluated for a predefined set of contingencies. The results are fil-tered, stored and converted in synthetic security indices. Notice that, during the analysis phase, these security in-dices will be aggregated in the form of an overall security level of each micro-scenario, and, at higher level, of each macro-scenario and each trajectory.
2.2.3 Analysis of results using data mining
The methodology may produce very large amounts of data. For example, in a study based on a few hundred ref-erence micro-scenarios, about 100 macro-scenarios and a moderate number of reinforcements, this yields a database potentially composed of a very large number of simula-tion results (in the order of several hundred million of security indices), classified in terms of characteristics of macro-scenarios, micro-scenarios, contingencies and re-inforcements. The different development options must be analysed according to their robustness and flexibility of achieving their objectives. The constraining scenarios should be identified. These analyses are carried out using a set of data mining tools (data summarisation, graphics, automatic learning techniques) in order to help the power system engineers together with people experienced in data mining to extract from the database synthetic information, related to micro-scenarios, macro-scenarios, trajectories and reinforcements but also particular power equipments.
3 APPLICATION TO THE BELGIAN GRID The objective of the Belgian TSO was to determine the efficiency in terms of security margins with respect to the different high-level hypotheses of a transmission net-work reinforcement on his South border. Although this transmission expansion problem is complex our proposed methodology has managed to produce solutions satisfying transmission expansion experts of the Belgian TSO. The analysis phase has shown that data mining techniques can be used in order to properly explain the results, to iden-tify the implied phenomena, to determine the causes and to find out the actual gains of proposed reinforcements.
3.1 Overview of the Belgian power system
The main characteristics of the Belgian power system are as follows (2002 data and 2003-provisional data):
• Installed power: 14.9 GW; • Peak load: 13.6 GW; • Consumption: 80.4 TWh;
• Imports: 16.7 TWh / Exports: 9 TWh.
The grid consists of overhead lines and underground cables with voltages ranging from 30 kV to 380 kV. The
voltage is converted in stages to the required level at more than 800 sub-stations. The high-voltage grid is composed of 8,286 kilometres of connections: 5,607 km of overhead lines and 2,679 km of underground cables. The ELIA net-work performs three major functions. The 380 kV grid forms the backbone of the Belgian and European network. The 220 and 150 kV connections provide electricity to large consumption centres and ensure Belgium’s domes-tic supply. Finally, power is carried over 70 and 36 kV lines to the off-take points used by distribution compa-nies. Large industrial customers are directly connected to the high-voltage grid. The Belgian network forms an integral part of the European transmission network. Con-nections with the Netherlands and France primarily carry electricity at 380 kV.
Belgium is strongly embedded into the European grid. Therefore it also has to deal with ‘loop flows’. These are uncontrolled energy flows running through the in-ternational electricity system. This might be problem-atic for a small network as the Belgian one, wedged be-tween large electricity producers and consumers. More-over, these international flows constitute one of the most relevant sources of uncertainties for the near future. Their impact on the system security should therefore be investi-gated.
3.2 Reinforcements & high-level hypotheses
The study has been performed on the 1400-bus net-work used by ELIA for planning studies. The first ob-jective of the study being described in [7], the focus will concentrate on the reinforcements and the high-level hy-potheses taken into account for this study.
The planning horizon was originally fixed to seven years and divided in two periods: from present time t0to
t0+2 and from t0+2to t0+7. Only the first period is con-sidered in the application. Only one 380 kV reinforcement has been taken into account and applied at t0+2. Note that the option of no reinforcement is also considered.
At each time step of the planning horizon, the uncer-tainties, not under the control of the planner are modelled through macro-scenarios hypotheses. Only one source of uncertainties has been considered in the study: the level of import 1000 MW and 2000 MW at t0+2. The genera-tion pattern changes from t0to t0+2: removal of old coal units and addition of a new combined cycle gas-turbine plant. The peak load is 14.08 GW at t0 and 14.63 GW at t0+2. In the sequel, we will call the different macro-scenario/reinforcement combinations using the following triplet: [t, I, r] where t refers to time-step (t0or t0+2), I to the import level (1000 MW or 2000 MW) and r to the reinforcement.
The Monte-Carlo method has been used to generate a set of 997 random variations of system topology, load mand and generation pattern. The system variants are de-rived from the existing network assuming all equipments
1We have used a marginal cost based dispatch. Admittedly, in some systems a more realistic market model, taking into account market clearing
mechanisms and the possibility of market power, should be used. Nevertheless, in the context of the present study this simple dispatch scheme was considered as sufficient. Note also that the call to competing producers outside Belgium can be taken into account in the methodology in the form of uncertainties represented by a set of macro-scenarios.
connected. For each scenario, the random sampler sets the unavailable equipments (lines, cables, transformers, shunt capacitors and generating units) and the global load level according to a probabilistic model derived from past statis-tics.
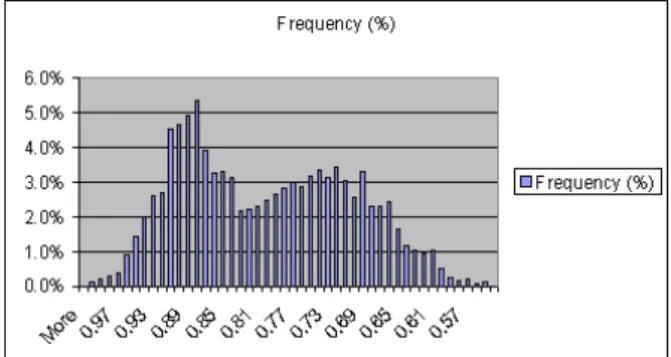
The impact of the season on load demand, equipments limits and availabilities, is taken into account by dividing the year into three periods: summer (17% of the year), winter (25%) and mid-season (58%). A different proba-bilistic model is considered for each season. The transmis-sion system un-availabilities are sampled independently according outage rates. Parameters of these distributions are derived from past records of planned maintenances and faults, aggregated for each type of equipment (e.g. 380 kV line, transformer, cable, etc). The global load level is determined according to its historical probability distri-bution. Such a distribution, referring to winter loads, is shown in figure 3, which represents on the horizontal axis the ratio of the load level with respect to the peak load and on the vertical axis the percentage of periods correspond-ing to a given load level.
Figure 3: Winter load distribution
For each micro-scenario, the global load is distributed among individual substations and types of consumers. Each nodal load is computed by updating the correspond-ing base case value accordcorrespond-ing to the macro-scenario hy-pothesis and the sampling result. A changing share of industrial/residential demand according to the season and the load level has been used.
Generating units are scheduled according to a pure economic criterion regardless of system constraints. The load to be dispatched is given by:
M WLoad ∗ 1.02 − M WImport = M WDispatch where the 1.02 coefficient accounts for losses. If the avail-able units are not sufficient to produce the required MW Dispatch, the lack is covered by additional import.
The OPF is used to compute the initial operating point by following the Belgian on-line tertiary voltage control algorithm. The desired operating point has to be: (i) ac-ceptable: absence of voltage and current limit violations; (ii) feasible: respect of the control variable limits; and (iii) realistic: reactive power should be adequately distributed among the various units. The control variables of the OPF are: reactive generation of units, load tap changers set-tings, and shunt devices state. The objective is to max-imise the reactive power reserve.
The five combinations of situations (one reference macro-scenario at tO, two macro-scenario assumptions on the transit at t0+2, two development options at t0+2) to-gether with the 997 reference micro-scenarios, leads to a total number of 4988 micro-scenarios.
3.3 Analysis
The analysis of the results was done in several itera-tive steps over a period of more than six months. All those steps and all the different considerations will not be re-ported in details in this article. We will rather focus on the analysis methodology and on some main interesting results produced by this methodology.
3.3.1 Convergence analysis of micro-scenarios
The OPF did not converge for every micro-scenario computed. In our methodology, we kept only the micro-scenarios that converged for every macro-scenario/reinforcement combination in order to carry out differential analyses among macro-scenarios. This leads in the end to 585 reference micro-scenarios out of 997. The histogram 4 shows whether a reference micro-scenario diverged at least for one combination or con-verged for the 5 combinations according to the load level at t0. Load Nb. Objects 6000 7000 8000 9000 10000 11000 12000 13000 14000 0 10 20 30 40 50 60 70 80 90 100
All Objects Set : 997 Objects
CONVERGED : 585 Objects
DIVERGED : 412 Objects
Figure 4: Convergence vs load at t0
The bad convergence at low load level was actually ex-plained (a posteriori) by two imperfections of the model. On one hand, the 1200 loads were modelled with a con-stant power factor and on the other hand, the small gener-ation units are modelled as constant P-Q injections. The OPF is mainly responsible of the Mvar balance on the sys-tem. Because of this simplification, no feasible solution could be obtained by the OPF at very low load levels when the system generates a lot of Vars. The result is that the database of sound operating conditions is not really rep-resentative of low load situations. Nevertheless, we will see that interesting information could be extracted from the remaining micro-scenarios. The identification of the Var modelling problem was an unexpected byproduct of the study.
3.3.2 Pre-contingency analysis of the micro-scenarios
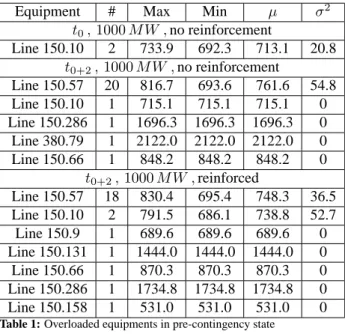
Table 1 gives for 3 macro-scenario/reinforcement combinations, the number of micro-scenarios with over-flows in the pre-contingency state, the maximum, the min-imum, the average and the variance of the current (A) for each overloaded equipment. In our example, the overloads have been classified in 3 categories:
• the overloads due to imperfections of the model; • the problems already solved by the Belgian TSO but
not implemented;
• the “new” overflows.
Equipment # Max Min µ σ2
t0, 1000 M W , no reinforcement Line 150.10 2 733.9 692.3 713.1 20.8 t0+2, 1000 M W , no reinforcement Line 150.57 20 816.7 693.6 761.6 54.8 Line 150.10 1 715.1 715.1 715.1 0 Line 150.286 1 1696.3 1696.3 1696.3 0 Line 380.79 1 2122.0 2122.0 2122.0 0 Line 150.66 1 848.2 848.2 848.2 0 t0+2, 1000 M W , reinforced Line 150.57 18 830.4 695.4 748.3 36.5 Line 150.10 2 791.5 686.1 738.8 52.7 Line 150.9 1 689.6 689.6 689.6 0 Line 150.131 1 1444.0 1444.0 1444.0 0 Line 150.66 1 870.3 870.3 870.3 0 Line 150.286 1 1734.8 1734.8 1734.8 0 Line 150.158 1 531.0 531.0 531.0 0
Table 1: Overloaded equipments in pre-contingency state
The table can be made for all the macro-scenarios to-gether or macro-scenario by macro-scenario. Both kind of tables allow us to easily determine the 2 first categories of overloads while the second let us find out the differences between macro-scenarios and therefore “new” problems caused by either the increase of the load or the increase of the import or whether the network was reinforced or not.
Obviously, no TSO would accept to operate his net-work with overloaded equipments without taking any counter-measures. Therefore, those micro-scenarios already showing equipment overloads in the pre-contingency state have been individually analysed in de-tails. After this analysis, they have been removed from the dataset so as to focus further analyses on the effect of contingencies.
This experience highlights that the analysis can only be performed by the people experienced in data mining together with the power system engineers in order to prop-erly explain the phenomena.
3.3.3 Filtering the contingencies
In operational planning, the planning criterion of nearly each TSO aims at N-1 static security, i.e. for each network state with equipment(s) in maintenance, the loss of each remaining equipment must not cause overflows, voltage problems, etc. The analysis from this point of view has been carried out by first removing the micro-scenarios
having violations in the pre-contingency state in at least one macro-scenario. Equipment nb Max µ σ2 Line 150.10 5002 169.4 109.4 7.0 Line 150.13 2893 135.1 103.5 3.2 Line 150.66 2147 135.8 104.0 3.8 Line 150.158 1897 139.1 105.3 4.7 Line 150.131 1516 141.1 103.7 3.2 Line 150.9 1464 165 108.8 8.7 Line 380.79 1236 127.4 104.0 2.8 Line 150.131 958 138.5 101.8 3.5 Line 150.127 955 138.5 101.8 3.5 Line 150.141 623 132.6 106.6 5.6 Line 150.14 613 135.7 105.6 4.9 Line 150.140 384 180.2 108.4 9.2 Line 150.19 195 138.2 104.4 7.8
Table 2: Overloaded equipments after contingency (%)
The results of the contingency analysis have been first analyzed using the same basic technique as we used in
§3.3.1. Considering the 5 macro-scenarios together,
Ta-ble 2 gives for each overloaded equipment the number of times the equipment has been overloaded, the maximum, average and variance of the percentage of current on the equipment (with respect to the permanent limit). This ta-ble provides us with the same kind of information as Ta-ble 1, but related to post-contingency states. Such anal-yses clearly highlight the weak points of the system, in terms of which elements are most often overload in the post-contingency state, throughout all macro-scenarios, or differentially for a given macro-scenario and a given rein-forcement option.
Notice that, in our analysis, 2 other tables have been very useful to classify the overflows into the 3 cate-gories: the most frequent outages causing overflows (i.e., the dangerous contingencies) and the most frequent out-age/overloaded equipment combinations.
3.3.4 Looking at some specific problems
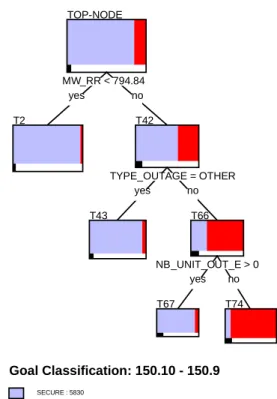
For some specific problems, the data mining has helped the power system experts to confirm or to get to the bottom of the phenomena. For an example, the 2 lines 150.10 and 150.9 are frequently overloaded. Notcie that these are actually two parallel transmission lines (we will refer to the two sub-stations they connect by sub-station H and sub-station R). 5 outages (contingencies) have been identified that cause overloads on those equipments.
A classical data mining technique [5] has been used to deepen the problem analysis. For the 5 outages, the percentage of current (with respect to the thermal limit) on the 2 lines together with information on the operating point has been extracted from the database and classified by a decision tree into insecure (at least one of the 2 lines overloaded) and secure situations. The outages on 150.10 and 150.9 are called parallel and the 3 remaining outages
yes no MW_RR < 794.84 TOP-NODE T2 yes no TYPE_OUTAGE = OTHER T42 T43 yes no NB_UNIT_OUT_E > 0 T66 T67 T74 Goal Classification: 150.10 - 150.9 SECURE : 5830 UNSECURE : 898
Figure 5: Pruned decision tree
The decision tree (6728 objects in the Learning Set, 1121 in the Pruning Set and 1121 in the Test Set, the er-ror probability is 4.728%) represented on Fig. 5 confirms the experience of the power system engineers. The tree is read top-down, and each decision node is represented by a box showing in its upper part the percentage of secure and insecure scenarios in the training and in its lower part the test set error rate. The tree of Fig. 5 shows that a conges-tion on one of those 2 lines can be fixed either by stopping a generating unit at sub-station E or by switching on the parallel line or by decreasing the generation around sub-station R. We mention the fact that a reinforcement has already been identified to fix the problem, but it was not considered in this study.
3.3.5 Elaborating and using security indices
The power system engineers of the Belgian TSO wanted to challenge their own indices. Such indices have been computed for each micro-scenario. A first index con-sists in counting the number of overflows observed after a contingency (ND). Another index consists in summing up the overflows expressed in MVA of all equipments for all contingencies (SD). Combining those two indices leads to a third one, namely the average overflow expressed in MVA (AD).
The analysis has been done using histograms and scatter-plots like the one of Fig. 6 of those indices for the different macro-scenario/reinforcement combinations. At one point of the analysis, the utility of the reinforcement considered was impossible to determine, e.g. on Fig. 6 at time t0+2with an import of 1000 MW the reinforcement seemed to generate problems since the index SD is often larger in the situation with reinforcement (i.e. point above
the diagonal). On the other hand, with an import of 2000 MW the reinforcement appeared to be effective.
M02O01 M02O02 0 100 200 300 400 500 600 700 0 50 100 150 200 250 300 350 400 ( Correlation factor : 0.862 )
Figure 6: SD index: “no reinforcement” (on the x-axis) vs “reinforced”
(on the y-axis). The macro-scenario corresponds to an import level of 1000 MW.
To deepen the phenomena analysis, the indices have been computed for 9 electrical regions (the 380 kV net-work, 8 parts of 220-150 kV network defined by the power system engineers according to their experience) and for 3 levels of overflow. On the Fig. 7, the 380 kV index confirmed the efficiency of the reinforcement (most of the points are located on the x-axis). The 220-150 kV indices revealed that half of the electrical regions are not influ-enced by the reinforcement, that one 220-150 kV region is relieved by the reinforcement and that several 220-150 kV regions are slightly weakened by the reinforcement. A specific analysis has been performed on those regions and the problems have been explained by the experts.
M03O01 M03O02 0 100 200 300 400 500 600 700 800 900 0 25 50 75 100 125
150 ( Correlation factor : 1.185E-1 )
Figure 7: 380 kV SD index: “no reinforcement” (on the x-axis) vs
“re-inforced” (on the y-axis). The macro-scenario corresponds to an import level of 2000 MW.
4 CONCLUSIONS & FURTHER WORK In this paper, we reported the application of the ap-proach for expansion planning under uncertainties de-scribed in [7] on a real transmission expansion problem faced by the Belgian TSO. With respect to related works, in particular that of reference [6], this present paper pro-vides a methodology based on the generation of a set of scenarios taking into account the temporal nature of the problem. The approach considers the major exter-nal uncertainties during the planning horizon as high-level hypotheses, the macro-scenarios, at different future time in635e4db1c9stants. The random nature of actual operat-ing conditions, i.e. the maintenance of the transmission equipments and the availability of the generating units, is
taken into account by using a probabilistic model based on past statistics.
The objective was to validate the efficiency of a trans-mission network reinforcement in terms of security mar-gin with respect to the different high-level hypotheses. Our illustration has proven that our methodology was ef-fective. Our example demonstrates that data mining tech-niques must be used by the power system engineers to-gether with people experienced in data mining in order to properly explain the results, to identify the implied phe-nomena, to determine the causes and to find out the actual gain of proposed reinforcements. In the study we were able to “discover” some already known weaknesses of the system as well as some unexpected ones.
According to our experience, further efforts must be done regarding the power system model (load, embed-ded generation, phase-shifters, etc) in order to increase the convergence rate at low load levels, to facilitate the filtering phase by automatically evaluating additional re-inforcements and to take into account preventive actions related to the maintenance instead of one unique topology. This project has been developped by the University of Li`ege for the Belgian TSO within the framework of the Belgian TSO transmission expansion planning activities. This methodology is intended to be merged with other methodologies developped in parallel [8, 9]. The objec-tive is to provide the TSO with the information about the efficiency and limits of the different future network rein-forcements in a changing environment. The principal goal of the framework is to develop a complete methodology based on different techniques to investigate the opportu-nity, the efficiency, and the limits of network reinforce-ments in a long-term perspective. In the future, the ap-proach could be enhanced by including a more complex market model in order to better evaluate the social welfare associated to the network reinforcements.
ACKNOWLEDGEMENTS
The study reported in this paper was carried out with the computational facilities of the Control Centre Labo-ratory (CCLab) of the University of Li`ege. We would like to thank ALSTOM/ESCA (now AREVA) who grace-fully provided the OPF and modeling applications from
its Energy Management Platform E-Terra, and PEPITe (www.pepite.be) who provided the PEPITo data mining tool and support.
REFERENCES
[1] R.D. Cruz, J.M. Areiza, G. Latorre, ”Trans-mission planning in a Deregulated Environ-ment - International Comparison”, available at http://www.montefiore.ulg.ac.be/services/stochastic/ 035 T4.pdf
[2] C. Ray, C. Ward, K. Bell, A. May, P. Roddy, ”Transmission Capacity Planning in a Deregulated Energy Market”, available at http://www.montefiore.ulg.ac.be/services/stochastic/ D1024.pdf
[3] CIGRE Working Group 37.10, ”Methods for plan-ning under uncertainty”, Electra, no. 161, pp. 143-163, 1995.
[4] C. Ward, ”Transmission Capacity Planning in an Open Energy Market”, Proc. CIGR Symposium on Working Plant and Systems Harder, London, June 7-9, paper 100-06, 1999.
[5] L. Wehenkel , ”Automatic learning techniques in power systems”, Kluwer Academic, 1997.
[6] J.P. Paul, K. Bell, ”A Comprehensive Approach to the Assessment of Large-Scale Power System Secu-rity Under Uncertainty”, CIGRE 2002, 37-308. [7] S. Vassena, P. Mack, P. Rousseaux, C. Druet &
L. Wehenkel. ”A probabilistic approach to power system network planning under uncertainties”. 2003 IEEE Bologna Power Tech Conference, paper BPT03-271.
[8] F. Vermeulen, J.-M. Delinc´e, C. Druet, V. Illegems, M. Parmar, C. Riechmann, W Fritz & C. Linke. ”The Power System Model (PSM) – Concept, An innova-tive integrated methodology for grid planning”. CI-GRE 2004, C1-307.
[9] F. Vermeulen, C. Druet. ”A reliability cost based method for system power planning”. Submitted to the PSCC 2005.