Science Arts & Métiers (SAM)
is an open access repository that collects the work of Arts et Métiers Institute of Technology researchers and makes it freely available over the web where possible.
This is an author-deposited version published in: https://sam.ensam.eu
Handle ID: .http://hdl.handle.net/10985/6294
To cite this version :
Alain ETIENNE, Jean-Yves DANTAN, Ali SIADAT, Patrick MARTIN - Activity Based Tolerance Allocation (ABTA) – Driving tolerance synthesis by evaluating its global cost - 2009
Activity Based Tolerance Allocation (ABTA) – Driving
tolerance synthesis by evaluating its global cost
ETIENNE Alain, DANTAN Jean-Yves, SIADAT Ali, MARTIN Patrick
Laboratoire de Génie Industriel et de Production Mécanique E.N.S.A.M. Metz, 4 rue A. Fresnel, 57070 METZ Cedex, France
Keywords:
Tolerance Synthesis, Tolerance allocation, Cost estimation, ABC method, Activity model, Data model, Manufacturing Process.
Abstract:
This paper deals with tolerance allocation driven by an activity based approach. Its main objective is to rationally give a good indicator of the relevance of tolerances values fixed by designers. Taking into consideration the impacts of tolerance allocation on the manufacturing process and so the production cost, several examples are given to illustrate this concept. Moreover this paper deals with how the geometrical analysis can be carried out in this activity framework, illustrated several industrial cases. And, this paper explains how coupled with an optimization algorithm this method can generate the best compromise between cost and high performance. To illustrate the efficiency of this approach and its realization, models and user interfaces based on an industrial case are given.
1. INTRODUCTION
As technology increases and performance requirements continually tighten, the cost and required precision of assemblies increase as well. That’s why designers have to take care to the tolerance design which allows them to produce at lower cost high-precision assemblies. Moreover a compromise must be found between designers which want tight tolerances to assure product performance and manufacturers who prefer loose tolerances to reduce cost. Consequently tolerancing activities take a crucial role in the relationship between these usually
activities become key characteristics for improving the productivity and the efficiency of manufacturing resources consumption.
A significant amount of literature is related to tolerance design. Hong [1] distinguishes seven domains of existing tolerancing research like tolerancing schemes, tolerance model, tolerance allocation, … This paper deals with tolerance allocation. About tolerance allocation, Hong [1] said “Most of the tolerance allocation approaches that have been published are based on the
optimization of the cost-tolerance function. They usually try to get optimal tolerance `values’ while the tolerance `types’ are assumed to be fixed. Unfortunately, however, the usage of these models in industry is fairly limited. One of the major reasons for this is that they usually try to take advantage of the superficial knowledge of processes, which is usually obtained from the machinist handbook or the company manual.” Therefore, we propose a new approach of
tolerance allocation driven by an activity based approach. Indeed, since design and manufacturing are truly interconnected, the developed method has to follow a more iterative way.
The long-term objective of this work is the optimisation of the tolerance allocation phase allowing designers to specify their functional requirements taking into consideration the impact of them on the manufacturing. The first step to this optimisation is the calculation of the tolerance allocation cost. Indeed this cost is a good indicator of the relevance of a tolerance allocation and can became an objective function of the optimisation algorithm.
This paper deals with methods and models developed to perform the analysis of the relevance of a tolerance allocation. The first part of this article regards the tolerancing process and the current solutions used to perform tolerance allocations and to evaluate its costs. Then an original approach analysing the impact of a tolerance allocation and then its cost is more particularly
detailed on an illustrative example. Then knowledge representation and mathematical tools needed to support this solution are explained and structured in a UML model. Finally a short conclusion deals with limits of this method and some prospects.
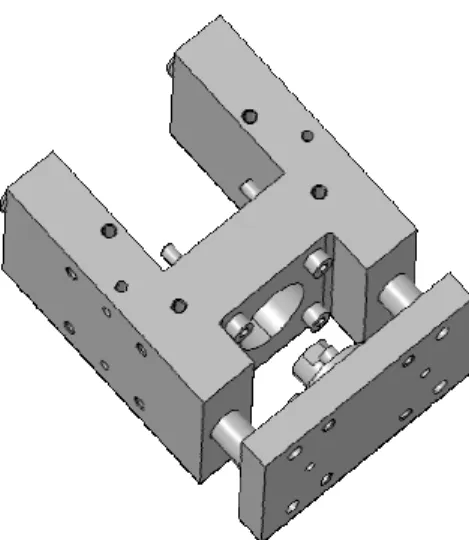
This concept of activity based tolerance allocation (ABTA) has been tested and validated on several products. One of them is illustrated in Figure 1: the linear guide unit. This hyperstatic assembly is interesting since functional and dimensional requirements are numerous.
2. TOLERANCE DESIGN AND TOLERANCE ALLOCATION
This section of the paper deals with the tolerance allocation, how it is performed, and more precisely the limit of the current methods used to evaluate its cost. Moreover, this section presents our tolerance design approach and our tolerance allocation framework.
2.1. Tolerance design
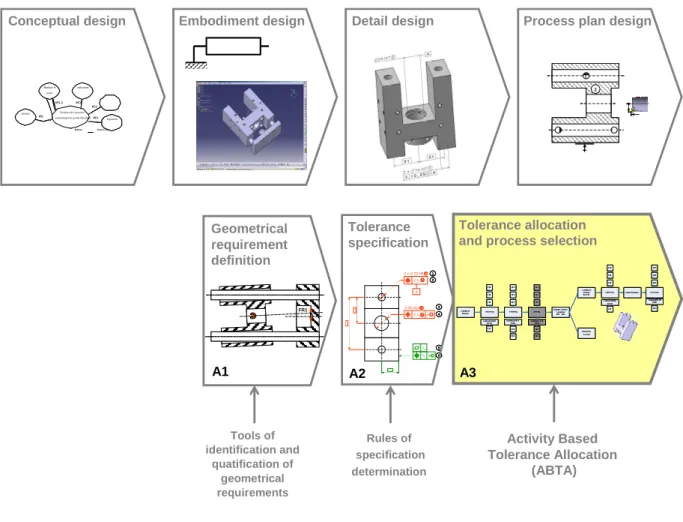
Activity model describes functions and their input and output data of tolerance design (Figure 2). The activity of tolerance design is decomposed into three sub activities: Geometrical requirement definition (Activity A1), Tolerance specification - Qualitative determination of parts tolerances (Activity A2) and Tolerance allocation - quantitative allocation of part tolerances (Activity A3). To assure the integration of design, manufacturing and tolerancing, we define an integrated approach, which ensures the continuous transition from functions to tolerances [2], [3], manufacturing cost and process capabilities.
Activities A1 & A2 is to determine geometrical specifications of each part to ensure the functional requirements based on technical functional analysis approach. In order to determine quickly the tolerances of parts for a mechanism, by using functional analysis method, designers
mechanism. Moreover, the technical functional analysis allows determining the geometrical requirements, which limit the functional characteristics of the mechanism. To determine the geometrical specification of each part, designers study the impact of the parts deviations and the gaps on the considered geometrical requirement. The geometrical specifications corresponding to a requirement are related to all the key surfaces of the key parts and strictly to them and limit the key deviations and strictly them which impact the respect of the requirement. An amount of research has been devoted to the development of geometrical specification determination [2], [3], [4], [5].
Activity A3 is to allocate tolerances to ensure the functional requirement and to minimize the manufacturing cost. This paper focuses on this activity. The input of this activity is the output of activities A1 and A2.
The following sections 2.2 and 2.3 show some approaches of tolerance allocation. The section 2.4 details the proposed indicator for tolerance allocation. And the section 2.5 deals with our framework of tolerance allocation.
2.2. Strategies of tolerance allocation
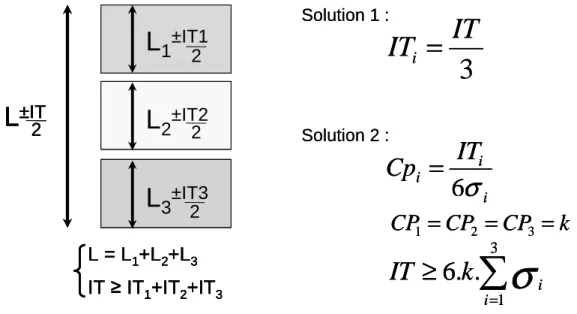
Among all solutions available to perform tolerance allocations, three can be distinguished: • The first consists in equally dividing the tolerance between the workpieces achieving
functional requirements (The solution1 in Figure 3). This solution is the easiest; however it does not take into account the capability of the production resources. As a consequence, the cost of this distribution is unrefined and the risk of having out of range dimensions or not machinable workpieces is high.
• The second solution which tries to avoid the previous defects is based on the resource capability. This capability is an indicator commonly used to assess the relevance of using a resource to produce a tolerance objective. This indicator is mathematically defined :
i Tolerance Capability σ . 6 = (1)
σ models the standard deviation of the statistical distribution of the resource’s deviations.
The aim of this method is to have the same capability (usually higher than 1.33) for all resources (The solution2 in Figure 3). However this solution is not enough efficient: although the risk of having out of limits dimensions is reduced, the production plan looses its flexibility. Moreover, since this solution select only quality controlled process plan, the cost of products becomes expensive.
• The third allocation is performed regarding the tolerance cost. Methods used to carry out this assessment are described and explained in the further section.
2.3. Cost of the tolerances
Current methods designed to assess the tolerance cost are mainly based on parametric approaches. According to these methods, the cost depends on mathematical combination of the tolerance required and several constants. Among all parametric functions available, the reciprocal squared model [6], the reciprocal model [7] and the exponential model [8] are currently the most used mathematical definitions. Some evoluted models [9] [10] propose a synthesis of the cheapest solution to machine a specified tolerance regarding available resources in the company. One resulting process sequence chart is illustrated Figure 4. For instance, the reciprocal square model is:
²
Tolerance B A
Cost = + [6] (2)
‘A’ and ‘B’ are two constant parameters. Since they highly depend on the context (material,
machining operation and condition, tool and machine used, cost labour...) it is both difficult and expensive to evaluate them [11] (mainly with experimental designs). Moreover these parameters, when they are assessed, are considered as strategic data then companies do not publish any information about them…
Added to this difficulty to evaluate these parameters, their validity are strongly limited and thus difficult to generalize in the industrial framework. Indeed since workpieces are machined in several conditions (multiple operations, sites, machines and tools), there are too many parameters to isolate, model and evaluate. To do so, some approaches use design of experiments [12] to identify the cost function parameters.
In conclusion, it seems not really relevant to use these methods evaluating the cost of tolerance with parametric models. Regarding these issues, it could be more interesting to evaluate the cost impact by the tolerance allocation than directly the tolerances cost. This way is explain in the next section.
2.4. Cost impacted by the tolerance allocation - Cost weighted risk
Contrary to the previous solution which tries to directly evaluate the cost of tolerances this method consists in assessing the cost impact by the designer’s tolerances allocation. Moreover, since it seems impossible to truly evaluate the real cost of tolerances, the aim of this section is to find the way to calculate a good indicator of the relevance of design solutions. Indeed designers just need to compare several solutions to choose the best not really their precise cost…
Among the parameters impacted by the tolerance choices, the most dependent on this allocation are manufacturing characteristics. That’s why the cost weighted risk concept assesses cost by analysing the impact of the tolerance allocations on the manufacturing process. In our case, the concept of risk mainly means risk of manufacturing out of range or not functional products and so producing workpieces not sealable and decreasing profits. This analysis is built on a mathematical expression: ... e) Assemblabl Cost.P(Not Labour Range) Of Cost.P(Out Recycling Ok) oduct P(Pr Cost oduction Pr Cost + + + = (3)
This formula is composed by three parts:
• The first member models the production cost of workpieces without any defect and then are saleable products. The variable ProductionCost is the sum of all manufacturing resources used to machine products (especially tools, labour and machines).
P(ProductionOk) is the probability of having a product meeting all requirements
(functional, and more particularly the specifications defined by the tolerance allocation). • The second part underlines the indirect costs due to recycling: workpieces partially
machined have to be dropped out (i.e. recycled) if one of its parameter is out of range. The variable P(OutOfRange) models this occurrence and the value of the parameter
RecyclingCost is defined by the user.
• The last member of this formula models issues due to non compatible components of a assembly: labours have to try several combinations of workpieces to find fitted assemblies. This occurrence of this kind of manufacturing difficulty is modelled by the
variable P(NotAssemblable). The cost LabourCost is site-dependent and so fixed by the user.
This concept of cost weighted risk is a good indicator since it takes into account the concept of risk. Indeed, a wider tolerance range allows using less accurate but cheaper machines: machined products are cheaper too but the probability of producing defects increases. This indicator can help designers to find the best compromise between cost (wide tolerances easy and cheap to produce) and quality (tight tolerance making sure the respect of requirements). In addition, this concept can be automated: it can become a solution for the optimization of tolerance allocation…
2.5. Our framework of tolerance allocation
The aim of this framework is to determine the values of the parts tolerances which minimize the cost weighted risk [13]. This optimization problem is so complex that for traditional optimization algorithms it may be difficult or impossible to solve it because the objective function is not available in analytic form; in fact, the assessment of probabilities needs numerical simulation. Recently, due to their outstanding performance in non-linear optimization, some stochastic optimization algorithms, such as genetic algorithms and simulate annealing algorithms, have be used well to solve the problem. Therefore, this optimization is realized by genetic algorithm [14], [15], [16], [17].
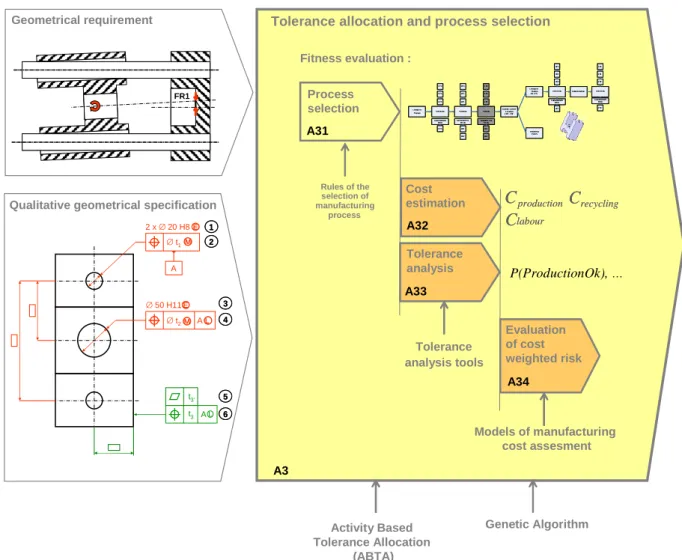
At each genetic algorithm iteration, the fitness evaluation includes the process selection, the cost estimation and the probability estimation. To do so, this evaluation needs a lot of information and data (cost and deviation of each resource taking a part in the production of the product) especially for evaluating the production cost and the different probabilities composing the mathematical function. This knowledge has been stored and modelled in the UML diagram, a detailed version of this model is described in section 3.4
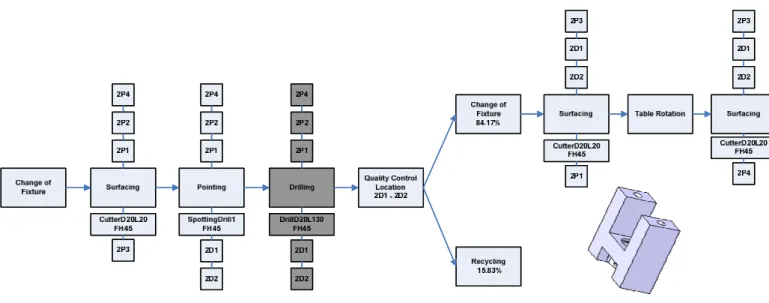
The first step of fitness evaluation is the process selection which takes into consideration the impact of tolerances on the manufacturing process (Figure 5). The output of this step is a set of admissible manufacturing processes which include manufacturing activities, control activities, … An amount of research has been devoted to the development of CAPP. The Figure 6 illustrates the output: a manufacturing process of a part. In this model, activities are the central squares, linked together and ordered into one process plan. The dark gray squares in this picture model only one example of production activities. This one is a drilling operation of two bores named
‘2D1’ and ‘2D2’ (the Figure shows these geometrical features), machined in the fixture
composed by three features (‘2P1’, ‘2P4’ and ‘2P2’). It consumes two resources: the milling machine named ‘FH45’ and the cutting tool called ‘DrillD20L130’.
For each tolerance allocation, a set of manufacturing process is selected (Figure 5, Activity A31), and the cost weighted risk is evaluated (Figure 5, Activities A32, A33 & A34). The evaluation of the cost weighted risk is the goal of the activities based on model and the main topic of the next sections.
3. ACTIVITY BASED CONCEPT
The cost weighted risk is the relevance driver of a tolerance allocation. The objective is to combine this analytical definition, taking into account indirect costs due to both not respected tolerances or too tighten and expensive requirements, with the flexibility of the ABC (Activity Based Costing) concept. This section deals with the adaptation of the ABC method to the tolerance allocation issue. Furthermore several activities are described and an example is given to illustrate this new concept.
3.1. The ABC method
The Activity Based Costing method (ABC method) was principally developed during the 1980s [18]. This method consists in banning the usual and hierarchical view of the analytical approach which is based on the discrimination between the direct (and productive) activities and the indirect (and considered as not productive) activities.
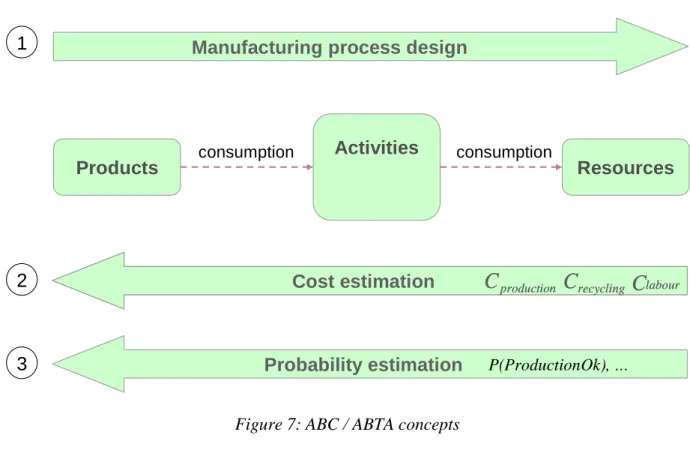
The ABC method performs the decomposition into relevant activities of both the structure and the production processes of the company. Then, it underlines the consumption links between these activities and resources or products (Figure 7). These links are quantified with three inductors: the resource inductor which describes the distribution of each resource consummated by activities, the cost inductor which describes the activities consumed to produce products, and the activity inductor.
This method assesses more precisely the real product cost since it takes into account more indirect costs than the analytical approaches. However, the difficulty to find and evaluate the inductors remains the main issue of this method.
3.2. Improvement of the ABC method to the tolerance allocation issue
In order to use this ABC method to assess the cost impacted by the tolerance allocation, some adaptations and improvements are needed.
The first improvement consists in enriching the activities handled in the ABC method with two parameters: the performance indicator and the parameter of instantiation occurrence. The performance indicator quantifies the probability that the activity delivers good products according to tolerance requirements. The occurrence of emergence evaluates the probability that the activity appears in the process plan. Moreover, to the static and structural description of activities modelled by the ABC method, the new concept adds a dynamic view: activities can
from now on generate other activities if some criteria are fulfilled. These criteria are described and illustrated on further sections.
Since tolerance allocation belongs to the production framework, the second main improvement is the enriching of the ABC method with the notion of order. Indeed, contrary to ABC method where order is useless (since it only structures the consumption links), a process plan is the arrangement of all activities taking a part in the product lifecycle. So for one ABC structure there are as many process plans generated as ABC activities combinations.
Considering the flexibility of the ABC method, infinite types of activities can be designed to describe and analyse the product lifecycle [19]. However, it seems that relevant results can be obtained with only a dozen activities:
• Production activities. The production activity designates all activities taking part to the modification of the morphology of geometrical features composing workpieces. This activity which carries out only one elementary machining operation (OP) on at least one feature is considered consuming one tool, one machine and one machining fixture. The cost of this activity is easy to assess since tools and machines cost are known and stored. • Other production activities. The other production activities are ‘preparation’ activities.
Changes of tool, rotations of the milling table or changes of machining fixture are some of them. The cost of these activities is defined by the user function to their time.
• Quality control activity. Quality activity performs this conformity control. When a production activity has a process capability under a critical level, it generates one control quality activity. Like a production activity, the cost of this activity is easy to assess since tools and machines cost are known and stored.
• Recycling and Adjustment activities. When control activity establishes that some parameters of the workpiece are out of range considering its dimensional requirements, the product has to be exited from the production line to rectify its defects. Two kinds of issues can be distinguished and for each of them, an activity has been designed. The first concerns the respect of dimensional requirements of features composing the workpiece features. In case of out of range parameter, the control activity generates a recycling activity. This operation simulates the treatment of a rate of the production workpieces considered as rejects products. The cost of this activity is the sum of all previous activities (and consequently resources) used to produce this uncompleted and out of range workpieces. Thus, owing to this activity, impacts of producing difficult and the risk to machine features are taking into account. The second difficulty regards issues appearing during the assemblage of the final product. Indeed, even if workpieces composing the final product meet their tolerance requirements, the probability of not succeeding in assembling them together is not null. In this case, labours have to try several combinations of these workpieces until they fit together. This operation is simulated by the adjustment activity.
• …
In conclusion, several activities are designed to describe and quantify the process plan followed by the product. Each of them respects the definition of the concept of activity, and their impact on cost (Figure 5, Activity A32 - Figure 7, step 2).
The ABC approach allows to calculate ProductionCost, RecyclingCost, and LabourCost of the cost weighted risk. The following section details the estimation of the others parameters of the cost weighted risk: P(ProductionOk), P(OutOfRange), and P(NotAssemblable).
3.3. Tolerance analysis and probability distribution estimation
In fact, the evaluation of the cost weighted risk needs a statistical tolerance analysis (Activity A33 – Figure 5). Tolerance analysis has been the topic of a tremendous number of research publications [1], especially in the field of mechanical tolerancing. While the methods of analysis can be either deterministic or statistical, the design models to be analysed can be of 1D, 2D or 3D. The statistical tolerance analysis aims to characterize the sum dimension Y of the design equation Y = f( X) in statistical terms, starting from an assumption a certain distribution of Xs. This analysis is essentially based on the displacements composition. The products deviations are one of the several displacements belonging to the product description: part deviations, gaps, uncertainties of fixture, uncertainties of machining resources and functional characteristics. These displacements can be modelled with the equation [20]:
) ( X
f
Y = (4)
Y and X={x1, x2, x3…} are both displacements. All of them are considered as continuous random variables. The function f which is a determinist relationship links all of these displacements. The aim of the further sections is to describe the different functions f used to evaluate and quantify the relationship between these displacements. For each specification, there are important questions that would need to be looked upon:
• What is specified? A specification is a condition on a characteristic between geometrical features or on geometrical features.
• Therefore, for each type of geometrical specification, what is the type of features and the type of characteristic involved?
• How to define the function f? • How to analyze these tolerances?
The further sections answer these different questions on several types of specifications used by the ABTA method. Moreover for each of them, an example is given to illustrate the described specification and to show how it is include in the activity based method.
3.3.1. Geometrical part specification analysis
The geometrical part specification analysis allows to estimate P(OutOfRange), that is similar than process plan assessment. To do so, we adopt the same approaches as Legoff and Villeneuve to simulate in three dimensions the behaviour of a workpiece set-up and machining process. They applied the Small Displacement Torsor model to the process planning environment.
• Feature specified: These dimensional and form specifications concern only one feature; Geometrical specifications are a little more complicated than the previous case since it concerns at least two geometrical features of one part. Several specifications belong to these geometrical specifications: parallelism, perpendicularity, location…
• Type of characteristics handled: For these geometrical features, designers want to limit with these specifications
• the deviations of intrinsic characteristics (noted d ) such as a boring diameter or i
its surface roughness... Tjmin ≤d≤Tjmax ;
• the deviations of situation characteristics between the geometrical features (noted i
d ) which is modelized by a Small Displacement Torsor. The mathematical
representation of these geometrical part specification is a set of constraints:
max
min j( i) j
j g d T
• Cause of this variation and mathematical representation (function f):
• Since only intrinsic characteristics of features are regarded, these deviations are mainly to be due to only manufacturing resources uncertainties (dresources) and thus
on the activity. Consequently, this relationship can be mathematically expressed by enriching the formula (4): di = f1(dresources). Fitted to the ABTA method, only production activities are responsible for these intrinsic characteristics variations. • Since this kind of specification regards several geometrical features, several
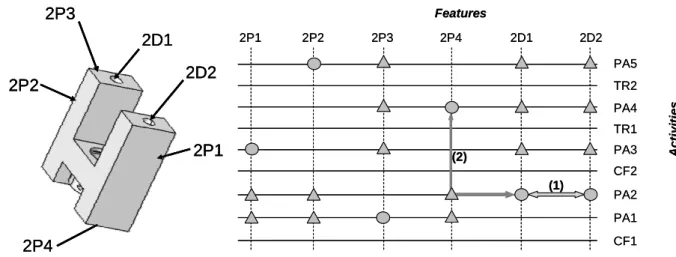
activities can take a part to the production of geometrical specifications: production activities, change of tools activities, change of set-up activities… Then, the resulting final part deviations and the respect of this kind of specification are not only due to resources uncertainties but several parameters are involved as the fixture uncertainties or the order of the used activities. A mathematical model is proposed: di = f2(dFixtures,dResources,ProcessPlan) [22], [23], [24]. In order to determinate activities responsible for part deviations, the analysis of the process is carried out like the ∆L method [25], [26] and [27] (Figure 8).
• In this case, the function f modelizes the propagation of process dispersions between the datum and manufactured feature.
• Tolerance analysis technique: For the statistical analysis of the problems of the real world,
the Monte Carlo simulation method is frequently used [31], [32], [33]. By generating the random variables for resource deviations from a certain distribution, the moments for part deviations can be estimated statistically. Therefore, the probability P(OutOfRange) is
3.3.1.Geometrical product requirement analysis
The geometrical product requirement analysis allows to estimate P(ProductionOk), and
P(NotAssemblable). Hong et al distinguish two distinct categories based on the type of input
variations analysed: dimensional variations and geometric variations. The aim of this analysis is to evaluate the impact of manufacturing variations on the assembly requirements and the functional requirements; therefore, we adopt a 3D Tolerance propagation as Bourdet et al [29] to obtain the explicit function f; and we use Monte Carlo simulation. The Monte Carlo simulation method is frequently used, and is adopted by most commercial software packages [32], [33]. Based on the same approach for tolerance analysis, Clozel et al develop MecaMaster® (tolerance analysis software) which is used by AIRBUS, PEUGEOT …
• Feature specified: The assembly requirements and functional requirements can concern
product features.
• Type of characteristics handled, cause of their variation and mathematical representation (function f): In this case, specified characteristics are:
• gaps which depend on the geometrical feature deviations of each part belonging to the assembly. By refining the global equation (4) these gaps can be mathematically modelled as: gj = f3(di) where di parameter is a part deviation. The non interference between parts is the main constraint on gaps, as a consequence, gaps are mathematically limited: 0≤Tj ≤gj. Tj which is optional is designed essentially for ease the assembly. Several works have been carried out to find a way to describe this function f3 in three dimensional issues [28], [29], [30]. • functional characteristics which depend on both geometrical features deviations
) , (
4 i i
j f d g
FC = . The aim of the function requirement is to bounder these functional characteristics by specified limits: FRimin ≤G(FCj)≤FRimaxSeveral works deals with the definition of this function f4.
In brief, the geometrical tolerance analysis is based on displacements composition. The previous sections underline two major points. The first is that all displacements are directly or indirectly due to uncertainties of resources and the activities order (process plan). The second is that to be carried out this tolerance analysis has to find a reliable way to mathematically express all these function fi to link this uncertainties to all other displacements (gaps, deviations and so on…).
3.4. ABTA prototype Implementation:
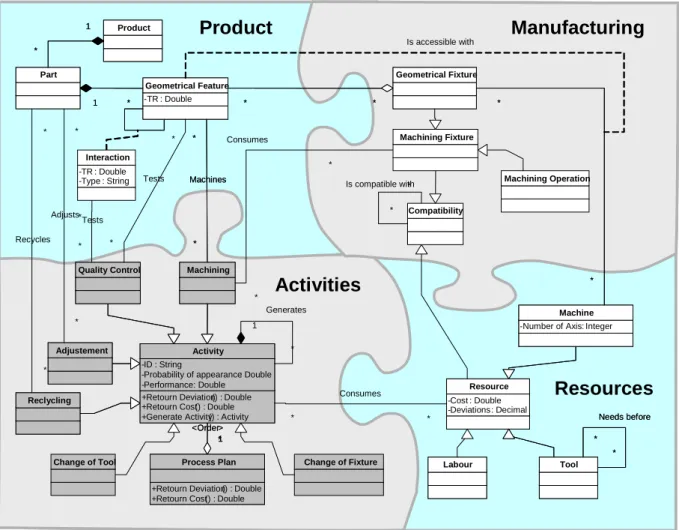
The entire ABTA concept has taken shape into prototype software to evaluate the cost impacted by tolerance choices principally on the manufacturing processes. The Static data model (Figure 9) has been proposed to describe four semantics views needed to realize ABTA method:
Activity handling: The activity class is characterised by the performance indicator and the
probability of appearance. It has provides methods to generate sub-activities and calculate its cost. All activities types inherit from this class and so they inherit all of its capabilities
Resources description: Each activity is liked to its needed resources. Resource class contained
two essential parameters the cost and the deviations. All resources inherit from the ‘Resource’ class and make a resource catalogue model.
Product geometrical definition: This geometrical product description is based on features
concept [34] and [35]. A product is composed to several parts and each part is composed by some features. These geometrical features are elementary geometrical semantic sets of
models and quantifies the geometrical specification between several features. Each feature is linked to activities which create the feature and control feature characterises.
Manufacturing information: This package of data model present the information of
manufacturing system that needed to produce geometrical features. ‘Machining Fixture’ class modelises how the part is geometrically located during the machining and how geometrical features are produced. Indeed the class ‘Geometrical Fixture’ describes, for a machining set up, the geometrical features composing it. The link between manufacturing fixture and manufacturing resources is realised by ‘Compatibility’ class. Moreover it describes compatibilities between resources themselves too. This part of the UML model is the support of capitalization interfaces which are designed to help manufacturing experts to express how their technical choices are motivated. An example of these user interfaces, based on the cutting tool charts concept [37].
This modelling solution is enough flexible to be enriched with the addition of new resources, knowledge or activities. However, the object structure of design requirements (functional and tolerance goals) which are handled by the ABTA is not presented in this model.
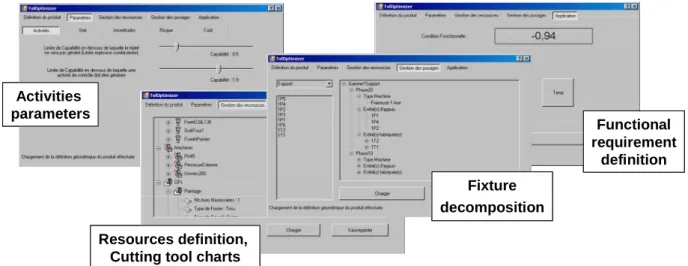
ABTA prototype is developed and coded in a object oriented environment (Visual Basic.net) and can perform the main objective of the ABTA concept. Several user interfaces, allowing expert to express their knowledge:
- One to express the ordered list of mountings. Indeed the program does not generate any mounting. In this case, users have to describe for each mounting: the entities to machine, entities needed to locate the workpiece and the type of the machine used,
- One to describe the product, the entities composing it and their geometry, - And one to quantify algorithm’s parameters.
Some user interfaces are given in the Figure . The results of this software are the cost resulting of the best process plan generated, the resources needed and the ordered list of activities used. This information are synthesised into a simple diagram as illustrated in Figure .
4. CONCLUSION
In conclusion, this paper describes an original method to evaluate the relevance of a tolerance synthesis (more precisely the tolerance allocation) considering the manufacturing cost impacted by tolerances. As opposed to current methods trying to directly calculate the cost of tolerances, this way, more flexible, assesses the cost of a solution due to designers’ choices.
Based on activity concept, this method considers the links between design and manufacturing phases and takes into account all issues regarding tolerances production. Supported by statistical tools such as Monte Carlo simulation or variances analysis of resources deviations, the main activities playing a part in the quality of the product are analysed to check if workpieces produced meet functional requirements.
Nevertheless, this solution has some defects. Combinatory explosion in the process generation is the worst of them. In order to avoid it, the constraints programming is currently studied to delete not machinable or too expensive solutions the earliest possible.
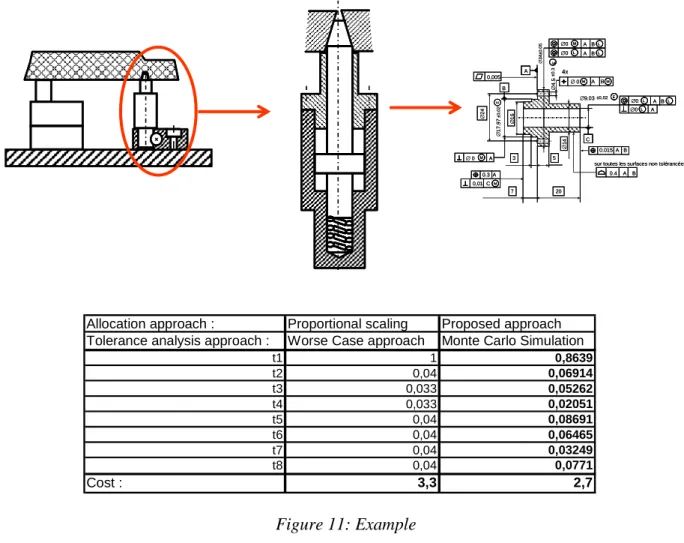
This activity based on method remains the first step to the tolerances optimisation. Since this method compares and evaluates different tolerances allocations, automating it and linking it with
an optimization tool, as a genetic algorithm, can become a good way to optimize tolerances. This association has been performed (Figure 11).
REFERENCES
[1] Hong, Y. S., Chang, T-C., A Comprehensive Review of Tolerancing Research, International Journal of Production Research, 2002, Vol. 40; No. 11, pp. 2425-2459. [2] Dantan J.Y., Nabil A., Mathieu L., « Integrated Tolerancing Process for Conceptual Design
», Annals of CIRP 2003, Vol. 52, n°1, pp. 135-138, 2003.
[3] Roy U., Pramanik N., Sudarsan R., Sriram R.D., Lyons K.W., 2001, Function to form mapping: model, representation and application in design synthesis, Computer Aided Design, Vol.33, pp. 699-719.
[4] Mejbri H, Anselmetti B, Mawussi K. Functional tolerancing of complex mechanisms: Identification and specification of key parts. Computers & Industrial Engineering, Vol.49, Issue 2, 2005, pp. 241-265.
[5] Sellakh R., Riviere A., Chevassus N., Marguet B., "An assisted method for specifying ISO tolerances applied to structural assemblies", CIRP Seminar on Computer Aided Tolerancing, France, 2001.
[6] Spotts, M.F., Allocation of tolerances to minimize cost of assembly, Journal of engineering for Industry, Transactions of the ASME, Vol.95, August 1973, pp. 762-864.
[7] Chase, K., Parkinson, A. R., “A Survey of Research in the Application of Tolerance Analysis to the Design of Mechanical Assemblies”, ADCATS Report No. 91-1, April 1991.
[8] Speckhart, F.H., Calculation of tolerance based on minimum cost approach, Journal of engineering for industry, Transactions of ASME, Vol. 94, May 1972, pp. 447-453.
[9] Layek, A.M., Nutthapol, A., An analytical approach to process planning with rework option, International journal of production economics 46-47, 1996, pp. 511-520.
[10] Lööf, J., Hermansson, T., Söderberg, R., An Efficient Solution to the Discrete Least-Cost Tolerance Allocation Problem With General Loss Functions, the 9th CIRP International Seminar on Computer Aided Tolerancing, April 11-12, 2005, Tempe, Arizona, USA. [11] Diplaris, S.C., Sfantsikopoulos, M. M., cost-tolerance function. A new approach for cost
optimum machining accuracy, International journal of advanced manufacturing technology, 2000.
[12] R. Schmitt, C. Behrens, 2007, A Statistical Method for analyses of Cost- and Risk optimal Tolerance Allocations based on Assured Input Data, In Proceedings of the 10th CIRP International Seminar on Computer Aided Tolerancing, Erlangen, Allemagne.
[13] Etienne A., Dantan J.Y., Siadat A., Martin P., 2007, Cost estimation for tolerance allocation, In Proceedings of the 10th CIRP International Seminar on Computer Aided Tolerancing, Erlangen, Allemagne.
[14] Etienne A., Dantan J.Y., Siadat A., Martin P., 2006, Process plan selection integrating tolerance allocation by genetic algorithm and constraints satisfaction algorithms, In Proceedings of the 5th CIRP International Seminar on Intelligent Computation in Manufacturing Engineering (CIRP ICME '06); Naples, Italy , pp.513-517.
[15] Iannuzzi MP, Sandgren E., 1995, Tolerance optimization using genetic algorithms: Benchmarking with manual analysis. Proceedings of the Fourth CIRP Design Seminar on Computer-Aided Tolerancing.
[17] Shan A, Roth RN, 2003, Genetic algorithms in statistical tolerancing. J. Mathematical and Computer Modeling, Vol. 38, pp. 1427-1436.
[18] Johnson, H.T., Kaplan, R.S., Relevance cost, the rise and fall of management accounting, Harvard Business School Press, 1987.
[19] Bramail, D.G., McKay, K.R., Maropoulos P.G., Manufacturability evaluation of early product designs, Proceedings of the first CIRP seminar on the digital enterprise technology, 2002, pp. 141-146.
[20] Skowronski, V.J., Turner, J.U., Using Mote Carlo variance reduction in statistical tolerance analysis, Computer Aided Design, Volume 29, Issue 1, January 1997, pp. 63-69.
[21] Hong, YS, Chang, TC, Tolerancing algebra: a building block for handling tolerance interactions in design and manufacturing, International Journal of Production Research, 2003, Vol.41, n°1, pp.47-63.
[22] Anselmetti, B., Louati, H., Generation of manufacturing tolerancing with ISO standards, International Journal of Machine Tools and Manufacture 45, 2005, pp.1124-1131.
[23] Vignat, F., Villeneuve, F., 3D Transfer of tolerances using a SDT approach: application to turning process, Journal of computing and information science in engineering, 3(1), 2003, pp.45-53.
[24] Tichadou, S., Modélisation et quantification tridimensionnelles des écarts de fabrication pour la simulation d'usinage, Génie Mécanique, Ecole centrale de Nantes et Université de Nantes, 2005.
[25] Bourdet, P., Chaînes de cotes de fabrication, L’ingénieur technicien de l’enseignement technique, 1973, pp.191.
[26] Tsai, J. C., Cheng, K.C., Cost-Effective Tolerance Allocation for Machining Processes, 9th CIRP International Seminar on Computer Aided Tolerancing, April 11-12, 2005, Tempe, Arizona, USA.
[27] Irani, S.A., Mittal, R.O., Lehtihet, E.A., Tolerance Chart Optimization, International Journal of Production Research, Vol. 27, No. 9, pp. 1531-1552, 1989.
[28] Roy, U., Li, B., Representation and interpretation of geometrical tolerances for polyhedral objects, Computer Aided Design, Vol. 31(4), pp. 273-285.
[29] Ballot, E., Bourdet, P., A computation method for the consequences of geometric errors in mechanisms, Proceedings of the CIRP seminar on Computer Aided Tolerancing, Toronto, Canada, April 1997.
[30] Giordano, M., Duret, D., Clearance space and deviation space, application to three dimensional chain of dimensions and positions, Proceedings of the CIRP Seminar on computer aided tolerancing, ENS Cachan, France, May 1993.
[31] Kharoufeh, JP, Chandra, MJ, Statistical tolerance analysis for non-normal or correlated normal component characteristics, International Journal of Production Research, 2002, Vol.40, n°2, pp.337-352.
[32] Nigam, SD, Turner, JU, Review of statistical approaches to tolerance analysis, Computer Aided Design, 1995, Vol.27, n°1, pp.6-15.
[33] Laperriere, L, Kabore, T, Monte Carlo simulation of tolerance synthesis equations, International Journal of Production Research, 2001, Vol.39, n°11, pp.2395-2406.
[34] Cunningham, J.J. and Dixon, J.R., Designing with Features : the Origin of Features, Proceedings of the ASME Symposium on Computers in Engineering, CIE, San Francisco
[35] Shah, J.J., Sreevalsan, P., Rogers, M., Billo, R. and Matthew, A., Current status of features technology, Technical Report R-88-GM-04.4, CAM-I Inc., Arlington, TX, 1988.
[36] Etienne, A., Dantan, J.Y., Siadat, A., Martin, P., An improved approach for automatic process plan generation of complex boring, Computers in industry, Vol. 57(7), 2006; pp.663-675.
[37] Villeneuve, F. and Barrabes, M., Object Data Base, AI and CAD-CAM : Application to the process Ascending Generation (PAG) concept, Computers in Design, Manufacturing and Production, 7th Annual European Computer Conference (IEEE), Compeuro 93, France, LURPA, May 1993, pp.320-329.
Embrayer Te ndre la courroie Système de remontée automatique de poids d'horloge logement FS1 FC3 FC4 FC5 FC1,2 Horloge & poids énergie utilisateur
Embrayer Te ndre la courroie Système de remontée automatique de poids d'horloge logement FS1 FC3 FC4 FC5 FC1,2 Horloge & poids énergie utilisateur
Conceptual design Embodiment design Detail design Process plan design
2 2 Geometrical requirement definition FR1 Tolerance specification ∅50 H11 EE ∅t2MMA LL ∅t1 2 x ∅20 H8 EE A t3A L t3’ 1 1 2 2 3 3 4 4 5 5 6 6 M M Tolerance allocation and process selection
Tools of identification and quatification of geometrical requirements Rules of determination specification Activity Based Tolerance Allocation (ABTA) A1 A2 A3
L
±ITL
1±IT1L
2±IT2L
3±IT3L = L
1+L
2+L
3IT
≥
IT
1+IT
2+IT
3 2 2 2 23
IT
IT
i=
i i iIT
Cp
σ
6
=
k
CP
CP
CP
1=
2=
3=
∑
=≥
3 1.
.
6
i ik
IT
σ
Solution 1 : Solution 2 :L
±ITL
1±IT1L
2±IT2L
3±IT3L = L
1+L
2+L
3IT
≥
IT
1+IT
2+IT
3 2 2 2 2L
±ITL
1±IT1L
2±IT2L
3±IT3L
±ITL
1±IT1L
2±IT2L
3±IT3L = L
1+L
2+L
3IT
≥
IT
1+IT
2+IT
3L = L
1+L
2+L
3IT
≥
IT
1+IT
2+IT
3 2 2 2 23
IT
IT
i=
i i iIT
Cp
σ
6
=
k
CP
CP
CP
1=
2=
3=
∑
=≥
3 1.
.
6
i ik
IT
σ
i i iIT
Cp
σ
6
=
k
CP
CP
CP
1=
2=
3=
∑
=≥
3 1.
.
6
i ik
IT
σ
Solution 1 : Solution 2 :Tolerance
C
o
s
t
Process 1 Process 2 Process 3 Process 4
Figure 4: Tolerance cost of combined processes
FR1 ∅50 H11EE ∅t2MM ALL ∅t1 2 x ∅20 H8EE A t3 A L t3’ 1 1 2 2 3 3 4 4 5 5 6 6 M M
Tolerance allocation and process selection
Fitness evaluation : Process selection Evaluation of cost weighted risk Genetic Algorithm Geometrical requirement
Qualitative geometrical specification
P(ProductionOk), … Tolerance analysis Cost estimation Clabour Clabour Crecycling Crecycling Cproduction Cproduction Activity Based Tolerance Allocation (ABTA) Rules of the selection of manufacturing process Tolerance analysis tools Models of manufacturing cost assesment A31 A32 A33 A34 A3
Products
Activities
consumption
Resources
Cost estimation
C
productionC
recyclingC
labourCost estimation
C
C
productionproductionC
C
recyclingrecyclingC
C
labourlabourconsumption
Probability estimation P(ProductionOk), …
Manufacturing process design
1
2
3
2D2 2P3 2D1 2P2 2P1 2P4 PA1 PA2 2D2 2D1 2P4 2P3 2P2 2P1 A c ti v it ie s Features (1) (2) CF1 CF2 PA3 TR1 PA4 TR2 PA5 2D2 2P3 2D1 2P2 2P1 2P4 2D2 2P3 2D1 2P2 2P1 2P4 PA1 PA2 2D2 2D1 2P4 2P3 2P2 2P1 A c ti v it ie s Features (1) (2) CF1 CF2 PA3 TR1 PA4 TR2 PA5
Manufacturing
Product
Activities
Resources
+Retourn Deviation() : Double +Retourn Cost() : Double +Generate Activity() : Activity -ID : String
-Probability of appearance : Double -Performance : Double Activity -TR : Double Geometrical Feature Machining * * Machines -Cost : Double -Deviations : Decimal Resource Part
+Retourn Deviation() : Double +Retourn Cost() : Double
Process Plan 1 * <Order> Quality Control Reclycling Adjustement Product 1 * 1 *
-Number of Axis : Integer
Machine Tool * * Needs before Geometrical Fixture * * * * Labour -TR : Double -Type : String Interaction * * Recycles * * Adjusts * * Is compatible with 1 * Generates * * Tests Compatibility * * Consumes * * Consumes Machining Operation Machining Fixture * * Tests Is accessible with
Change of Tool Change of Fixture
Manufacturing
Product
Activities
Resources
+Retourn Deviation() : Double +Retourn Cost() : Double +Generate Activity() : Activity -ID : String
-Probability of appearance : Double -Performance : Double Activity -TR : Double Geometrical Feature Machining * * Machines -Cost : Double -Deviations : Decimal Resource Part
+Retourn Deviation() : Double +Retourn Cost() : Double
Process Plan 1 * <Order> Quality Control Reclycling Adjustement Product 1 * 1 *
-Number of Axis : Integer
Machine Tool * * Needs before Geometrical Fixture * * * * Labour
+Retourn Deviation() : Double +Retourn Cost() : Double +Generate Activity() : Activity -ID : String
-Probability of appearance : Double -Performance : Double Activity -TR : Double Geometrical Feature Machining * * Machines -Cost : Double -Deviations : Decimal Resource Part
+Retourn Deviation() : Double +Retourn Cost() : Double
Process Plan 1 * <Order> Quality Control Reclycling Adjustement Product 1 * 1 *
-Number of Axis : Integer
Machine Tool * * Needs before Geometrical Fixture * * * * Labour -TR : Double -Type : String Interaction * * Recycles * * Adjusts * * Is compatible with 1 * Generates * * Tests Compatibility * * Consumes * * Consumes Machining Operation Machining Fixture * * Tests Is accessible with
Change of Tool Change of Fixture
Activities parameters
Fixture decomposition Resources definition,
Cutting tool charts
Functional requirement definition Activities parameters Fixture decomposition Resources definition,
Cutting tool charts
Functional requirement
definition
Allocation approach : Proportional scaling Proposed approach
Tolerance analysis approach : Worse Case approach Monte Carlo Simulation
t1 1 0,8639 t2 0,04 0,06914 t3 0,033 0,05262 t4 0,033 0,02051 t5 0,04 0,08691 t6 0,04 0,06465 t7 0,04 0,03249 t8 0,04 0,0771 Cost : 3,3 2,7 A ∅0M C B A ∅ 1 7 .9 7 ± 0 ,0 2 E 0,005 ∅ 2 4 ∅ 4 .5 ± 0 .3 E A B ∅0M 4x M ∅9.03±0,02E C 0,01 M A B L L ∅0 A ∅0 L 0.015 A B 0.3 A ∅ 1 6 A B M L ∅0 A B L L ∅0 ∅ 3 4 ± 0 .0 5 ∅ 1 4 3 7 20 5 0.4 A B
sur toutes les surfaces non tolérancées A ∅0MM C B A ∅ 1 7 .9 7 ± 0 ,0 2 E 0,005 ∅ 2 4 ∅ 4 .5 ± 0 .3 EE A B ∅0MM 4x M M ∅9.03±0,02EE C 0,01 MM A B L L LL ∅0 A ∅0 L L 0.015 A B 0.3 A ∅ 1 6 A B M M LL ∅0 A B L L LL ∅0 ∅ 3 4 ± 0 .0 5 ∅ 1 4 3 7 20 5 0.4 A B
sur toutes les surfaces non tolérancées