Simulated Annealing for
Complex Portfolio Selection Problems
Y. Crama and M. Schyns
¤May 4, 2001
Abstract
This paper describes the application of a simulated annealing approach to the solution of a complex portfolio selection model. The model is a mixed integer quadratic programming problem which arises when Markowitz' classical mean-variance model is enriched with additional realistic con-straints. Exact optimization algorithms run into di±culties in this frame-work and this motivates the investigation of heuristic techniques. Compu-tational experiments indicate that the approach is promising for this class of problems.
1
Introduction
Markowitz' mean-variance model of portfolio selection is one of the best known models in ¯nance. In its basic form, this model requires to determine the composi-tion of a portfolio of assets which minimizes risk while achieving a predetermined level of expected return. The pioneering role played by this model in the devel-opment of modern portfolio theory is unanimously recognized (see e.g. [7] for a brief historical account).
From a practical point of view, however, the Markowitz model may often be considered too basic, as it ignores many of the constraints faced by real-world investors: trading limitations, size of the portfolio, etc. Including such constraints in the formulation results in a nonlinear mixed integer programming problem which is considerably more di±cult to solve than the original model. Several researchers have attempted to attack this problem by a variety of techniques (decomposition, cutting planes, interior point methods, ...), but there appears to be room for much improvement on this front. In particular, exact solution methods fail to solve large-scale instances of the problem. Therefore, in this
¤University of Liµege, Bd. du Rectorat 7 (B31), 4000 Liµege, Belgium. [email protected]
paper, we investigate the ability of the simulated annealing metaheuristic (SA) to deliver high-quality solutions for the mean-variance model enriched by additional constraints.
The remainder of this paper is organized in six sections. Section 2 introduces the portfolio selection model that we want to solve. Section 3 sums up the ba-sic structure of simulated annealing algorithms. Section 4 contains a detailed description of our algorithm. Here, we make an attempt to underline the di±-culties encountered when tailoring the SA metaheuristic to the problem at hand. Notice, in particular, that our model involves continuous as well as discrete vari-ables, contrary to most applications of simulated annealing. Also, the constraints are of various types and cannot be handled in a uniform way. In Section 5, we discuss some details of the implementation. Section 6 reports on computational experiments carried out on a sample of 151 US stocks. Finally, the last section contains a summary of our work and some conclusions.
2
Portfolio selection issues
2.1
Generalities
In order to handle portfolio selection problems in a formal framework, three types of questions (at least) must be explicitly addressed:
1. data modelling, in particular the behavior of asset returns; 2. the choice of the optimization model, including:
² the nature of the objective function; ² the constraints faced by the investor; 3. the choice of the optimization technique.
Although our work focuses mostly on the third step, we brie°y discuss the whole approach since all the steps are interconnected to some extent.
The ¯rst requirement is to understand the nature of the data and to be able to correctly represent them. Markowitz' model (described in the next section) assumes for instance that the asset returns follow a multivariate normal distrib-ution. In particular, the ¯rst two moments of the distribution su±ce to describe completely the distribution of the asset returns and the characteristics of the dif-ferent portfolios. Real markets often exhibit more intricacies, with distributions of returns depending on moments of higher-order (skewness, kurtosis, etc.), and dis-tribution parameters varying over time. Analyzing and modelling such complex ¯nancial data is a whole subject in itself, which we do not tackle here explicitly. We rather adopt the classical assumptions of the mean-variance approach, where (pointwise estimates of) the expected returns and the variance-covariance matrix
are supposed to provide a satisfactory description of the asset returns. Also, we do not address the origin of the numerical data. Note that some authors rely for instance on factorial models of the asset returns, and take advantage of the properties of such models to improve the e±ciency of the optimization techniques (see e.g. [2, 24]). By contrast, the techniques that we develop here do not de-pend on any speci¯c properties of the data, so that some changes of the model (especially of the objective function) can be performed while preserving our main conclusions.
When building an optimization model of portfolio selection, a second require-ment consists in identifying the objective of the investor and the constraints that he is facing. As far as the objective goes, the quality of the portfolio could be measured using a wide variety of utility functions. Following again Markowitz' model, we assume here that the investor is risk averse and wants to minimize the variance of the investment portfolio subject to the expected level of ¯nal wealth. It should be noted, however, that this assumption does not play a crucial role in our algorithmic developments, and that the objective could be replaced by a more general utility function without much impact on the optimization techniques that we propose.
As far as the constraints of the model go, we are especially interested in two types of complex constraints limiting the number of assets included in the portfolio (thus re°ecting some behavioral or institutional restrictions faced by the investor), and the minimal quantities which can be traded when rebalancing an existing portfolio (thus re°ecting individual or market restrictions). This topic is covered in more detail in Section 2.2.2.
The ¯nal ingredient of a portfolio selection method is an algorithmic tech-nique for the optimization of the chosen model. This is the main topic of the present paper. In view of the complexity of our model (due, to a large extent, to the constraints mentioned in the previous paragraph), and to the large size of realistic problem instances, we have chosen to work with a simulated anneal-ing metaheuristic. An in-depth study has been performed to optimize the speed and the quality of the algorithmic process, and to analyze the impact of various parameter choices.
In the remainder of this section, we return in more detail to the description of the model, and we brie°y survey previous work on this and related models.
2.2
The optimization model
2.2.1 The Markowitz mean-variance model
The problem of optimally selecting a portfolio among n assets was formulated by Markowitz in 1952 as a constrained quadratic minimization problem (see [21], [11], [20]). In this model, each asset is characterized by a return varying randomly with time. The risk of each asset is measured by the variance of its return. If
each component xi of the n-vector x represents the proportion of an investor's
wealth allocated to asset i, then the total return of the portfolio is given by the scalar product of x by the vector of individual asset returns. Therefore, if R = (R1; : : : ; Rn) denotes the n-vector of expected returns of the assets and C
the n£ n covariance matrix of the returns, we obtain the mean portfolio return by the expression Pni=1Rixi and its level of risk by Pni=1
Pn
j=1Cijxixj.
Markowitz assumes that the aim of the investor is to design a portfolio which minimizes risk while achieving a predetermined expected return, sayRexp. Math-ematically, the problem can be formulated as follows for any value ofRexp:
min n X i=1 n X j=1 Cijxixj (1) s.t. n X i=1 Rixi =Rexp n X i=1 xi = 1 xi ¸ 0 for i = 1; : : : ; n:
The ¯rst constraint expresses the requirement placed on expected return. The second constraint, calledbudget constraint, requires that 100% of the budget be invested in the portfolio. The nonnegativity constraints express that no short sales are allowed.
The set of optimal solutions of the Markowitz model, parametrized over all possible values of Rexp, constitutes the mean-variance frontier of the portfolio selection problem. It is usually displayed as a curve in the plane where the ordinate is the expected portfolio return and the abscissa is its standard deviation. If the goal is to draw the whole frontier, an alternative form of the model can also be used where the constraint de¯ning the required expected return is removed and a new weighted term representing the portfolio return is included in the objective function. Hereafter, we shall use the initial formulation involving only the variance of the portfolio in the objective function.
2.2.2 Extensions of the basic model
In spite of its theoretical interest, the basic mean-variance model is often too simplistic to represent the complexity of real-world portfolio selection problems in an adequate fashion. In order to enrich the model, we need to introduce more realistic constraints. The present section discusses some of them.
Consider the following portfolio selection model (similar to a model described by Perold [24]).
² Return and budget constraints: These two constraints have already been encountered in the basic model.
Model (PS):
min Pni=1Pnj=1Cijxixj Objective function
s.t. Pni=1Rixi =Rexp Return contraint
Pn
i=1xi = 1 Budget constraint
xi · xi · xi (1· i · n) Floor and ceiling constraints
max(xi¡ x(0)i ; 0)· Bi (1· i · n) Turnover (purchase) constraints
max(x(0)i ¡ xi; 0)· Si (1· i · n) Turnover (sale) constraints
xi =x(0)i or xi ¸ (x(0)i +Bi)
or xi · (x(0)i ¡ Si) (1· i · n) Trading constraints
jfi 2 f1; : : : ; ng : xi 6= 0gj · N Maximum number of assets
² Floor and ceiling constraints: These constraints de¯ne lower and upper lim-its on the proportion of each asset which can be held in the portfolio. They may model institutional restrictions on the composition of the portfolio. They may also rule out negligible holdings of asset in the portfolio, thus making its control easier. Notice that the °oor contraints generalize the nonnegativity constraints imposed in the original model.
² Turnover constraints: These constraints impose upper bounds on the vari-ation of the holdings from one period to the next. Here, x(0)i denotes the weight of asset i in the initial portfolio , Bi denotes the maximum
pur-chase andSi denotes the maximum sale of asseti during the current period
(1· i · n). Notice that such limitations could also be modelled, indirectly, by incorporating transaction costs (taxes, commissions, unliquidity e®ects, ...) in the objective function or in the constraints.
² Trading constraints: Lower limits on the variations of the holdings can also be imposed in order to re°ect the fact that, typically, an investor may not be able, or may not want, to modify the portfolio by buying or selling tiny quantities of assets. A ¯rst reason may be that the contracts must bear on signi¯cant volumes. Another reason may be the existence of relatively high ¯xed costs linked to the transactions. These constraints are disjunctive in nature: for each asseti, either the holdings are not changed, or a minimal quantity Bi must be bought, or a minimal quantitySi must be sold.
² Maximum number of assets: This constraint limits to N the number of assets included in the portfolio, e.g. in order to facilitate its management.
2.3
Solution approaches
The complexity of solving portfolio selection problems is very much related to the type of constraints that they involve.
The simplest situation is obtained when the nonnegativity constraints are omitted from the basic model (1) (thus allowing short sales; see e.g. [11], [17], [20]). In this case, a closed-form solution is easily obtained by classical La-grangian methods and various approaches have been proposed to increase the speed of resolution for the computation of the whole mean-variance frontier or the computation of a speci¯c portfolio combined with an investment at the risk-free interest rate [17].
The problem becomes more complex when nonnegativity constraints are added to the formulation, as in the Markowitz model (1). The resulting quadratic pro-gramming problem, however, can still be solved e±ciently by specialized algo-rithms such as Wolfe's adaptation of the simplex method [28]. The same tech-nique allows to handle arbitrary linear constraints, like the °oor and ceiling con-straints or the turnover concon-straints. Notice, however, that even in this framework, the problem becomes increasingly hard to manage and to solve as the number of assets increases. As a consequence, ad hoc methods have been developed to take advantage of the sparsity or of the special structure of the covariance matrix, (e.g., when factor models of returns are postulated; see [24], [2]).
When the model involves constraints on minimal trading quantities or on the maximum number of assets in the portfolio, as in model (PS), then we enter the ¯eld of mixed integer nonlinear programming and classical algorithms are typically unable to deliver the optimal value of the problem. (Actually, very few commercial packages are even able to handle this class of problems.)
Several researchers took up this challenge, for various versions of the problem. Perold [24], whose work is most often cited in this context, included a broad class of constraints in his model, but did not place any limitation on the number of assets in the portfolio. His optimization approach is explicitly restricted to the consideration of factorial models, which, while reducing the number of decision variables, lead to other numerical and statistical di±culties. Moreover, some authors criticize the results obtained when his model is applied to certain types of markets.
Several other researchers have investigated variants of model (PS) involving only a subset of the constraints. This is the case for instance of Dembo, Mulvey and Zenios [10] (with network °ow models), Konno and Yamazaki [16] (with an absolute deviation approach to the measure of risk, embedded in linear program-ming models), Takehara [26] (with an interior point algorithm), and Bienstock [2] (with a 'branch and cut' approach). Dahl, Meeraus and Zenios [8], Takehara [26] and Hamza and Janssen [12] discuss some of this work.
Few authors seem to have investigated the application of local search meta-heuristics for the solution of portfolio selection problems. Catanas [3] has in-vestigated some of the theoretical properties of a neighborhood structure in this framework. Loraschi, Tettamanzi, Tomassini and Verda [18] proposed a genetic algorithm approach. Chang, Meade, Beasley and Sharaiha's work [5] is closest to ours (and was carried out concurrently). These authors have experimented with
a variety of metaheuristics, including simulated annealing, on model (PS) with-out trading and turnover constraints. As we shall see in Section 6, the trading constraints actually turned out to be the hardest to handle in our experiments, and they motivated much of the sophisticated machinery described in Section 4. We also work directly with the return constraint in equality form, rather than incorporating it as a Lagrangian term in the objective function. This allows us to avoid some of the di±culties linked to the fact that, as explained in [5], the e±cient frontier cannot possibly be mapped entirely in the Lagrangian approach, due to its discontinuity. In this sense, our work can be viewed as complementary to [5].
We propose to investigate the solution of the complete model (PS) presented in Section 2.2.2 by a simulated annealing algorithm. Our goal is to develop an approach which, while giving up claims to optimality, would display some robustness with respect to various criteria, including:
² quality of solutions; ² speed;
² ease of addition of new constraints;
² ease of modi¯cation of the objective function (e.g. when incorporating higher moments than the variance, or when considering alternative risk criteria like the semi-variance).
In the next section, we review the basic principles and terminology of the simulated annealing metaheuristic.
3
Simulated annealing
Detailed discussions of simulated annealing can be found in van Laarhoven and Aarts [27], Aarts and Lenstra [1] or in the survey by Pirlot [25]. We only give here a very brief presentation of the method.
Simulated annealing is a generic name for a class of optimization heuristics that perform a stochastic neighborhood search of the solution space. The major advantage of SA over classical local search methods is its ability to avoid getting trapped in local minima while searching for a global minimum. The underly-ing idea of the heuristic arises from an analogy with certain thermodynamical processes (cooling of a melted solid). Kirkpatrick, Gelatt and Vecchi [15] and ·
Cern¶y [4] pioneered its use for combinatorial problems. For a generic problem of the form
min F (x) s.t. x2 X;
the basic principle of the SA heuristic can be described as follows. Starting from a current solutionx, another solution y is generated by taking a stochastic
step in some neighborhood of x. If this new proposal improves the value of the objective function, theny replaces x as the new current solution. Otherwise, the new solutiony is accepted with a probability that decreases with the magnitude of the deterioration and in the course of iterations. (Notice the di®erence with classical descent approaches, where only improving moves are allowed and the algorithm may end up quickly in a local optimum.)
More precisely, the generic simulated annealing algorithm performs the fol-lowing steps:
² Choose an initial solution x(0) and compute the value of the objective
func-tion F (x(0)). Initialize the incumbent solution (i.e. the best available
solu-tion), denoted by (x¤; F¤), as: (x¤; F¤)Ã (x(0); F (x(0))).
² Until a stopping criterion is ful¯lled and for n starting from 0, do: { Draw a solution x at random in the neighborhood V (x(n)) of x(n).
{ If F (x)· F (x(n)) then x(n+1) Ã x and
if F (x)· F¤ then (x¤; F¤)Ã (x; F (x)).
If F (x) > F (x(n)) then draw a number p at random in [0; 1] and
if p· p(n; x; x(n)) then x(n+1)Ã x
else x(n+1) Ã x(n).
The function p(n; x; x(n)) is often taken to be a Boltzmann function inspired
from thermodynamics models:
p(n; x; x(n)) = exp(¡ 1
Tn
¢Fn) (2)
where ¢Fn = F (x) ¡ F (x(n)) and Tn is the temperature at step n, that is a
nonincreasing function of the iteration counter n. In so-called geometric cooling schedules, the temperature is kept unchanged during each successive stage, where a stage consists of a constant number L of consecutive iterations. After each stage, the temperature is multiplied by a constant factor ®2 (0; 1).
Due to the generality of the concepts that it involves, SA can be applied to a wide range of optimization problems. In particular, no speci¯c requirements need to be imposed on the objective function (derivability, convexity, ...) nor on the solution space. Moreover, it can be shown that the metaheuristic converges asymptotically to a global minimum [27].
From a practical point of view, the approach often yields excellent solutions to hard optimization problems. Surveys and descriptions of applications can be found in van Laarhoven and Aarts [27], Osman and Laporte [23] or Aarts and Lenstra [1].
Most of the original applications of simulated annealing have been made to problems of a combinatorial nature, where the notions of `step' or `neighbor'
usually ¯nd a natural interpretation. Due to the success of simulated annealing in this framework, several researchers have attempted to extend the approach to continuous minimization problems (see van Laarhoven and Aarts [27], Dekkers and Aarts [9], CSEP [6], Zabinsky et al. [29]). However, few practical applications appear in the literature. A short list can be found in the previous references, in particular in Osman and Laporte [23].
We are especially interested in these extensions, since portfolio selection typ-ically involves a mix of continuous and discrete variables (see Section 2). One of the aims of our work, therefore, is to gain a better understanding of the di±cul-ties encountered when applying simulated annealing to mixed integer nonlinear optimization problems and to carry out an exploratory investigation of the po-tentialities o®ered by SA in this framework.
4
Simulated annealing for portfolio selection
4.1
Generalities: How to handle constraints ...
In order to apply the SA algorithm to problem (PS), we have to undertake an important tailoring work. Two notions have to be de¯ned in priority, i.e. those of solution (or encoding thereof) and neighborhood.
We simply encode a solution of (PS) as ann-dimensional vector x, where each variable xi represents the holdings of asset i in the portfolio. The quality of a
solution is measured by the variance of the portfolio, that isxtCx.
Now, how do we handle the constraints, that is, how do we make sure that the ¯nal solution produced by the SA algorithm satis¯es all the constraints of (PS) ?
The ¯rst and most obvious approach enforces feasibility throughoutall itera-tions of the SA algorithm and forbids the consideration of any solution violating the constraints. This implies that the neighborhood of a current solution must entirely consist of feasible solutions. A second approach, by contrast, allows the consideration of infeasible solutions but adds a penalty term to the objective function for each violated constraint: the larger the violation of the constraint, the larger the increase in the value of the objective function. A portfolio which is unacceptable for the investor must be penalized enough to be rejected by the minimization process.
The \all-feasible" vs. \penalty" debate is classical in the optimization litera-ture. In the context of the simplex algorithm, for instance, infeasible solutions are temporarily allowed in the initial phase of thebig-M method, while feasibility is enforced thereafter by an adequate choice of the variable which is to leave the basis at each iteration. For a discussion of this topic in the framework of local search heuristics, see e.g. the references in Pirlot [25].
much of the discussion in the next subsections will center around the \right" choice to make for each class of constraints. Before we get to this discussion, let us ¯rst line up the respective advantages and inconvenients of each approach.
When penalties are used, the magnitude of each penalty should depend on the magnitude of the violation of the corresponding constraint, but must also be scaled relatively to the variance of the portfolio. A possible expression for the penalties is
a£ jviolationjp (3)
where a and p are scaling factors. For example, the violation of the return constraint can be represented by the di®erence between the required portfolio return (Rexp) and the current solution return (Rtx). The violation of the °oor
constraint for asset i can be expressed as the di®erence between the minimum admissible level xi and the current holdings xi, when this di®erence is positive.
The ¯rst inconvenient of this method is that it searches a solution space whose size may be considerably larger than the size of the feasible region. This process may require many iterations and prohibitive computation time.
The second inconvenient stems from the scaling factors: it may be di±cult to de¯ne adequate values fora and p. If these values are too small, then the penalties do not play their expected role and the ¯nal solution may be infeasible. On the other hand, ifa and p are too large, then the term xtCx becomes negligible with
respect to the penalty; thus, small variations ofx can lead to large variations of the penalty term, which mask the e®ect of the variance term.
Clearly, the correct choice ofa and p depends on the scale of the data, i.e. on the particular instance at hand! It appears very di±cult to automate this choice. For this reason, we use penalties for \soft" constraints only, and when nothing else works.
In our implementations, we have selected values for a and p as follows. First, we let a = V =²p, where V is the variance of the most risky asset, that is V =
max1·i·nCii, and² is a measure of numerical accuracy. Since the variance of any
portfolio lies in the interval [0; V ], this choice of a guarantees that every feasible portfolio yields a better value of the objective function than any portfolio which violates a constraint by² or more (but notice that smaller violations are penalized as well). The value ofp can now be used to ¯netune the magnitude of the penalty as a function of the violation: in our experiments, we have set p = 2.
Let us now discuss the alternative, all-feasible approach, in which the neigh-borhood of the current solution may only contain solutions that satisfy the given subset of constraints. The idea that we implemented here (following some of the proposals made in the literature on stochastic global optimization) is to draw a direction at random and to take a small step in this direction away from the current solution. The important features of such a move is that both itsdirection and length are computed so as to respect the constraints. Moreover, the
hold-ings of only a few assets are changed during the move, meaning that the feasible direction is chosen in a low-dimensional subspace. This simpli¯es computations and provides an immediate translation of the concept of \neighbor".
The main advantage of this approach is that no time is lost investigating infeasible solutions. The main disadvantage is that it is not always easy to select a neighbor in this way, so that the resulting moves may be quite contrived, their computation may be expensive and the search process may become in°exible. On the other hand, this approach seems to be the only reasonable one for certain constraints, like for example the trading constraints.
For each class of constraints, we had to ponder the advantages and disadvan-tages of each approach. When a constraint must be strictly satis¯ed or when it is possible to enforce it e±ciently without penalties in the objective function, then we do so. This is the case for the constraints on budget, return and maximum number of assets. A mixed approach is used for the trading, °oor, ceiling and turnover constraints.
In the next sections, we successively consider each class of constraints, starting with those that are enforced without penalties.
4.2
Budget and return constraints
4.2.1 Basic principle
The budget constraint must be strictly satis¯ed, since its unique goal is to norm the solution. Therefore, it is di±cult to implement this constraint through penal-ties.
The same conclusion applies to the return constraint, albeit for di®erent rea-sons. Indeed, our aim is to compute the whole mean-variance frontier. To achieve this aim, we want to let the expected portfolio return vary uniformly in its feasi-ble range and to determine the optimal risk associated with each return. In order to obtain meaningful results, the optimal portfolio computed by the procedure should have the exact required return. In our experience, the approach relying on penalties was completely inadequate for this purpose.
In view of these comments, we decided to restrict our algorithm to the con-sideration of solutions that strictly satisfy the return and the budget constraints. More precisely, given a portfoliox, the neighborhood of x contains all solutions x0
with the following property: there exist three assets, labeled 1, 2 and 3 without loss of generality, such that
8 > > > < > > > : x0 1 =x1¡ step x0 2 =x2+step¤ (R1 ¡ R3)=(R2¡ R3) x0 3 =x3+step¤ (R2 ¡ R1)=(R2¡ R3) x0i =xi for alli > 3; (4)
to check that x0 satis¯es the return and budget constraints when x does so.
Geometrically, all neighbors x0 of the form (4) lie on a line passing through x
and whose direction is de¯ned by the intersection of the 3-dimensional subspace associated to assets 1, 2, 3 with the two hyperplanes associated to the budget constraint and the return constraint, respectively. Thus, the choice of three assets determines the direction of the move, while the value of step determines its amplitude.
Observe that, in order to start the local search procedure, it is easy to compute an initial solution which satis¯es the budget and return constraints. Indeed, if x denotes an arbitrary portfolio and min (resp. max) is the subscript of the asset with minimum (resp. maximum) expected return, then a feasible solution is obtained upon replacingxmin andxmax byx0min andx0max, where:
( x0
min = [Rexp¡
Pn
i6=min;maxxiRi¡ (xmin+xmax)Rmax]=(Rmin¡ Rmax)
x0max =xmin+xmax¡ x0min:
(5) The resulting solution may violate some of the additional constraints of the prob-lem (trading, turnover, etc.) and penalties will need to be introduced in order to cope with this di±culty. This point will be discussed in sections to come.
4.2.2 Direction of moves
Choosing a neighbor of x, as described by (4), involves choosing the direction of the move, i.e. choosing three assets whose holdings are to be modi¯ed. In our initial attempts, we simply drew the indices of these assets randomly and uniformly over f1; : : : ; ng. Many of the corresponding moves, however, were nonimproving, thus resulting in slow convergence of the algorithm.
We have been able to improve this situation by guiding the choice of the three assets to be modi¯ed. Observe that the assets whose return is closest to the required portfolio return have (intuitively) a higher probability to appear in the optimal portfolio than the remaining ones. (This is most obvious for portfolios with \extreme" returns: consider for example the case where we impose nonnegative holdings and we want to achieve the highest possible return, i.e. Rmax.)
To account for this phenomenon, we initially sort all the assets by nonde-creasing return. For each required portfolio returnRexp, we determine the asset whose return is closest toRexp and we store its position, say q, in the sorted list. At each iteration of the SA algorithm, we choose the ¯rst asset to be modi¯ed by computing a random number normally distributed with mean q and with stan-dard deviation large enough to cover all the list: this random number points to the position of the ¯rst asset in the ordered list. The second and third assets are then chosen uniformly at random.
4.2.3 Amplitude of moves
Let us now turn to the choice of thestep parameter in (4). In our early attempts, step was ¯xed at a small constant value (so as to explore the solution space with high precision). The results appeared reasonably good but required extensive computation time (as compared to later implementations and to the quadratic simplex method, when this method was applicable).
In order to improve the behavior the algorithm, it is useful to realize that, even if a small value of step necessarily produces a small modi¯cation of the holdings of the ¯rst asset, it is more di±cult to predict its e®ect on the other assets (see (4)). This may result in poorly controlled moves, whose amplitude may vary erratically from one iteration to the next.
As a remedy, we chose to construct a ball around each current solution and to restrict all neighbors to lie on the surface of this ball (this is inspired by several techniques for random sampling and global optimization; see e.g. Lov¶asz and Simonovits [19] or Zabinsky et al. [29]). The euclidean length of each move is now simply determined by the radius of the ball. Furthermore, in view of equations (4), step is connected to the radius by the relation:
step =§q radius¤ (R2¡ R3)
(R2¡ R3)2 + (R1 ¡ R3)2+ (R2¡ R1)2
; (6)
where the § sign can be picked arbitrarily (we ¯x it randomly).
Now, how should we choose the radius of the ball? On the one hand, we want this value to be relatively small, so as to achieve su±cient precision. On the other hand, we can play with this parameter in order to enforce some of the constraints which have not been explicitly considered yet (°oor, ceiling, trading, etc.). Therefore, we will come back to a discussion of this point in subsequent sections.
4.3
Maximum number of assets constraint
This cardinality constraint is combinatorial in nature. Moreover, a \natural" penalty approach based on measuring the extent of the violation:
violation =jfi 2 f1; : : : ; ng : xi 6= 0gj ¡ N
(see model (PS)) does not seem appropriate to handle this constraint: indeed, all the neighbors of a solution are likely to yield the same penalty, except when an asset exceptionally appears in or disappears from the portfolio. Other types of penalties could conceivably be considered in order to circumvent the di±culty caused by this \°at landscape" (see e.g. [14, 25] for a discussion of similar issues arising in graph coloring or partitioning problems). We rather elected to rely on an all-feasible approach, whereby we restrict the choice of the three assets whose
holdings are to be modi¯ed, in such a way as to maintain feasibility at every iteration. Let us now proceed with a case-by-case discussion of this approach.
First, observe that the initial portfolio only involves two assets (see Section 4.2.1) and hence is always feasible with respect to the cardinality constraint (we disregard the trivial case whereN = 1).
Now, if the current portfolio involvesN¡k assets, with k ¸ 1, then we simply make sure, as we draw the three assets to be modi¯ed, that at mostk of them are not already in the current portfolio. This ensures that the new portfolio involves at mostN assets.
The same logic, however, cannot be used innocuously when the current portfo-lio involves exactlyN assets: indeed, this would lead to a rigid procedure whereby no new asset would ever be allowed into the portfolio, unless one of the current N assets disappears from the portfolio by pure chance (that is, as the result of numerical cancelations in equations (4)). Therefore, in this case, we proceed as follows. We draw three assets at random, say assets 1, 2 and 3, in such a way that at most one of them is not in the current portfolio. If all three assets already are in the portfolio, then we simply determine the new neighbor as usual. Otherwise, assume for instance that assets 1 and 2 are in the current portfolio, but asset 3 is not. Then, we set the parameter step equal to x1 in equations (4). In this
way, x0
1 = 0 in the neighbor solution: the move from x to x0 can be viewed as
substituting asset 1 by asset 3 and rebalancing the portfolio through appropriate choices of the holdingsx0
2 andx03.
4.4
Floor, ceiling and turnover constraints
The °oor, ceiling and turnover constraints are similar to each other, since each of them simply de¯nes a minimum or maximum bound on holdings. Therefore, our program automatically converts all turnover purchase constraints into ceiling constraints and all turnover sales constraints into °oor constraints.
Suppose now that we know which three assets (say, 1, 2 and 3) must be modi¯ed at the current move from solution x to solution x0, and suppose that
the amplitude of the move has not been determined by the cardinality constraint (see previous subsection). Then, it is easy to determine conditions on the value ofstep such that x0 satis¯es the °oor and ceiling constraints. Indeed, combining
the latter constraints with equations (4) leads to the following conditions: 8 > < > : x1¡ x1 · step · x1¡ x1 x2¡ x2 · step ¤ (R1¡ R3)=(R2¡ R3)· x2¡ x2 x3¡ x3 · step ¤ (R2¡ R1)=(R2¡ R3)· x3¡ x3: (7)
These conditions yield a feasible interval of variation for step and hence (via equation (6)) for the radius of the ball limiting the move fromx to x0. We denote
Let us ¯rst assume that the interval [lb; ub] is non empty (and, for practical purposes, not too \small"). Then, di®erent strategies are applicable. We could start a linesearch optimization process to ¯nd the optimal value of the radius in [lb; ub] (i.e., the value of the radius leading to the best neighbor x0). We have not experimented with this approach and have rather implemented a simpler option. We initially pick a small positive constant½. If, at any iteration, ½ is an admissible value for the radius, i.e. if ½ 2 [lb; ub], then we set the radius of the ball equal to½. Otherwise, if ½ is larger than ub (resp. smaller than lb), then we set the radius equal to ub (resp. lb).
Actually, in practice, we do not work with a single value of ½ but with two values, say½1 > ½2. The larger value½1 is used at the beginning of the algorithm,
so as to accelerate the exploration of the solution space. In a latter phase, i.e. when improving moves can no longer be found, the radius is decreased to the smaller value½2 in order to facilitate convergence to a local optimum.
Let us now consider the case where the feasibility interval [lb; ub] is either empty or very narrow, meaning thatx is either infeasible or close to the infeasible region. In this case, we disregard conditions (7) and simply set the radius of the ball equal to ½, thus generating an infeasible solution x0. In order to handle this
and other situations where infeasible solutions arise (see e.g. the end of Section 4.2.1), we introduce a penalty term of the form a£ jviolationjp in the objective
function for each ceiling or °oor constraint, as discussed in Section 4.1 and further speci¯ed in Table 1. Notice that the penalty approach appears to be suitable here, since limited violations of the °oor, ceiling or turnover constraints can usually be tolerated in practice.
Ceiling: ifxi > xi, then penalty = a(xi¡ xi)p
Floor: if xi < xi, then penalty = a(xi¡ xi)p
Table 1: Penalties for °oor and ceiling constraints
4.5
Trading constraints
The trading constraints are disjunctive: either the holdings of each asset remain at their current valuex(0) or they are modi¯ed by a minimum admissible amount.
These constraints are di±cult to handle, as they disconnect the solution space into 3n feasible subregions separated by forbidden subsets.
We use a similar approach as for the previous class of constraints. Denote by x0 = x + r d the neighbor of x obtained as explained in Section 4.4, where
d is the direction of the move and r is the radius of the ball. If x0 satis¯es the
trading constraints, then there is nothing to be done. Otherwise, we temporarily disregard the °oor/ceiling constraints (which are anyway easier to enforce than
the trading constraints) and we compute the smallest valuet in the interval [r;1) such thatx00 =x + t d satis¯es the trading constraints. If t is not too large (i.e.,
ift does not exceed a predetermined threshold), then we retain x00 as neighbor of
x. On the other hand, if t is larger than the threshold, then we reject the current move and we draw three new assets to be modi¯ed.
Observe, however, that solutions which violate the trading constraints still arise in some iterations of the algorithm. For instance, the initial solution is usu-ally infeasible, and so are the solutions which are generated when the portfolio contains exactly N assets (see the last paragraph of Section 4.3). Such infeasi-bilities are penalized as described in Table 2 (the parameters a and p are ¯xed as in Section 4.1). Observe that penalties are high at the center of the forbidden zones and decrease in the direction of admissible boundaries (associated with no trading or with minimum sales/purchases). Therefore, starting from a forbidden portfolio, the process tends to favor moves toward feasible regions.
Purchase: Qpurchase = xi¡ x(0)i
if Qpurchase2 ]0; Bi[, then
if Qpurchase· Bi=2 then penalty = a Qpurchasep
else penalty = a(Bi¡ Qpurchase)p
Sale: Qsale = x(0)i ¡ xi
if Qsale2 ]0; Si[, then
if Qsale· Si=2 then penalty = a Qsalep
else penalty = a(Si¡ Qsale)p
Table 2: Penalties for trading constraints
4.6
Summary: Neighbor selection
We can summarize as follows the neighbor selection procedure. Move direction
² If the current portfolio involves N ¡ k assets, with k ¸ 1, then
{ select three assets, say 1, 2 and 3, at random as explained in Section 4.2.2, while ensuring that at most k of them are outside the current portfolio (see Section 4.3);
{ go to Case a.
{ select three assets, say 1, 2 and 3, at random as explained in Section 4.2.2, while ensuring that at most one of them is outside the current portfolio (see Section 4.3);
{ if all three selected assets are in the current portfolio, then go to Case a; else go to Case b.
Step length Case a.
² Let d be the direction of the move as de¯ned by equations (4) (with the sign of step ¯xed at random). Compute the feasible interval for the radius of the move, say [lb; ub], and compute the radius r as explained in Section 4.4.
² If x + r d satis¯es the trading constraint, then
{ x + r d is the selected neighbor; if necessary, compute penalties for the violation of the °oor and ceiling constraints as in Table 1;
{ else, try to extend the move to x + t d, as explained in Section 4.5; if t is not too large, then
- x + t d is the selected neighbor; if necessary, compute penalties for the violation of the °oor and ceiling constraints as in Table 1; - else, discard direction d and select a new direction.
Case b.
² Let assets 1 and 2 be in the current portfolio and asset 3 be outside. In equations (4), set the parameter step equal to x1, set x01 = 0 and compute
the corresponding values ofx02 and x03.
² If necessary, compute penalties for the violation of the °oor, ceiling and trading constraints as in Tables 1 and 2.
5
Cooling schedule, stopping criterion and
in-tensi¯cation
5.1
Cooling schedule and stopping criterion
In our implementation of simulated annealing, we have adopted the geometric cooling schedule de¯ned in Section 3. In order to describe more completely this cooling schedule, we need to specify the value of the parameters T0 (the initial
Following the recommendations of many authors (see e.g. [1, 14, 25]), we set the initial temperature T0 in such a way that, during the ¯rst cooling stage
(¯rst L steps), the probability of acceptation of a move is roughly equal to a predetermined, relatively high value Â0 (in our numerical tests, Â0 = 0:8). In
order to achieve this goal, we proceed as follows. In a preliminary phase, the SA algorithm is run for L steps without rejecting any moves. The average increase of the objective function over this phase, say ¢, is computed andT0 is set equal
to:
T0 = ¡¢
lnÂ0
(8) (see equation (2)).
After L moves, the temperature is decreased according to the scheme Tk+1 =
®Tk. We use here the standard value ® = 0:95.
The fundamental trade-o®s involved in the determination of the stage length L are well-known, but di±cult to quantify precisely. A large value of L allows to explore the solution space thoroughly, but results in long execution times. Some studies (see [14, 25]) suggest to select a value of L roughly equal to the neigh-borhood size. In our algorithm, this rule leads to the value L ¼
à n 3
!
, which appeared excessively large in our computational tests. Therefore, we eventually settled for values ofL of the same order of magnitude as n (e.g., we let L = 300 whenn = 150). We elaborate on this topic in the next section.
In this ¯rst, basic version, the algorithm terminates if no moves are accepted during a given numberS of successive stages. In our experiments, we used S = 5.
5.2
Intensi¯cation
We have experimented with several ways of improving the quality of the solu-tions computed by the SA algorithm (at the cost of its running time). In all these attempts, the underlying strategy simply consists in running several times the algorithm described above; in this framework, we call cycle each execution of the basic algorithm. The main di®erence between the various strategies is found in the initialization process of each cycle. Namely, we have tried to favor the exploration of certain regions of the solution space by re-starting di®erent cycles from \promising" solutions encountered in previous cycles. Such intensi¯-cation strategies have proved successful in earlier implementations of local search metaheuristics.
Strategy 1. In this naive strategy, we run several (say M ) cycles successively and independently of each other, always from the same initial solution. The random nature of each cycle implies that this strategy may perform better than the single-start version.
Strategy 2. This second strategy is very similar to strategy 1, except that each cycle uses, as initial solution, the best solution found within the previous cycle. For all but the ¯rst cycle, the initial temperature is de¯ned by formula (8) withÂ0 = 0:3 (the idea is to set the initial temperature relatively low,
so as to preserve the features of the start solution). Also, for all but the last cycle, the stopping criterion is slightly relaxed: namely, each intermediate cycle terminates afterS0 stages without accepted moves, where S0 < S. In our experiments, S0 = 2.
Strategy 3. In the ¯rst cycle, we constitute a list P of promising solutions, where a promising solution may be
a. either the best solution found during each stage,
b. or the best solution found in any stage where the objective function has dropped signi¯cantly (a drop is signi¯cant if it exceeds the average decrease of the objective function during the previous stage).
Next, we perform jP j additional cycles, where each cycle starts from one of the solutions in P . For these additional cycles, the initial temperature is computed with Â0 = 0:3 and the cycle terminates after S0 = 2 stages
without accepted moves.
In the next section, we will compare the results produced by the basic strategy (strategy 0), strategy 1, strategy 2 and strategy 3b. In order to allow meaningful comparisons between the three multi-start strategies, we restrict the number of cycles performed by strategy 3b by setting an upper-bound (M ¡ 1) on the size of the list P . That is, after completion of the ¯rst cycle, we discard solutions fromP by applying the following two rules in succession:
² if several solutions in P imply the same trades (i.e., all these solutions recommend to buy or to sellexactly the same securities), then we only keep one of these solutions; the rationale is here that our algorithm is rather good at ¯nding the best solution complying with any given trading rules, so that all of these solutions yield `equivalent' starting points;
² we only keep the best (M ¡ 1) solutions in P .
6
Computational experiments
6.1
Environment and data
The algorithms described above have been implemented in standard C (ANSI C) and run on a PC Pentium 450MHz under Windows 98. A graphical interface was developed with Borland C++ Builder. All computation times mentioned in
coming sections are approximate real times, not CPU times. Unless otherwise stated, the parameter settings for the basic SA algorithm are de¯ned as follows:
² stage size: L = 2n;
² stopping criterion: terminate when no moves are accepted for S = 5 con-secutive stages;
² ball radius: ½1 = 0:005, decreased to ½2 = 0:001 as soon as fewer than 10
steps are accepted during a whole stage.
For the sake of constructing realistic problem instances, we have used ¯nan-cial data extracted from the DataStream database. We have retrieved the weekly prices of n = 151 US stocks covering di®erent traditional sectors for 484 weeks, from January 6, 1988 to April 9, 1997, in order to estimate their mean returns and covariance matrix. The stocks were drawn at random from a subpopula-tion involving mostly major stocks. (Note that our goal was not to draw any conclusions regarding the ¯rms, or the stock market, or even the composition of optimal portfolios, but only to test the computational performance of the algo-rithms.) These data have been used to generate several instances of model (PS) involving di®erent subsets of constraints.
For each instance, we have approximately computed the mean-variance fron-tier by letting the expected portfolio return (Rexp) vary from -0.3688% to 0.737% by steps of 0.01% (110 portfolios). Linear interpolation is used to graph interme-diate values. In each graph, the ordinate represents the expected portfolio return (expressed in basis points) and the abscissa represents the standard deviation of return.
We now discuss di®erent instances in increasing order of complexity.
6.2
The Markowitz mean-variance model
As a ¯rst base case, we have used the simulated annealing (SA) algorithm to solve instances of the Markowitz mean-variance model (see Section 2.2.1) without non-negativity constraints. Since these instances can easily be solved to optimality by Lagrangian techniques, we are able to check the quality of the solutions obtained by the SA algorithm. Our algorithm ¯nds the exact optimal risk for all values of the expected return. The SA algorithm requires 2 or 3 seconds per portfolio of 151 securities with the standard parameter settings.
The mean-risk frontier for this instance is plotted in Figure 1. It will also be displayed in all subsequent ¯gures, in order to provide a comparison with the frontiers obtained for constrained problems.
For a particular value of the target return, Figure 2 illustrates the evolution of the portfolio variance in the course of iterations.
Figure 1: Mean-variance frontier with short sales
Figure 2: Evolution of the portfolio variance
6.3
Floor, ceiling and turnover constraints
We solved several instances involving °oor, ceiling and turnover constraints. The ¯rst instance (Figure 3) imposes nonnegativity constraints on all assets (no short sales). The second one (Figure 4) adds more restrictions on minimal and maximal holdings allowed: xi = 0 and xi = 0:2 for each security. The hypotheses and
results are more completely described next to each ¯gure.
Here again, the exact optimal solution can be computed e±ciently (e.g., us-ing Wolfe's quadratic simplex algorithm [28]) and can be used to validate the results delivered by the SA algorithm. The quality of the heuristic solutions is usually extremely good. Slight deviations from optimality are only observed for extreme portfolio returns. Moreover, the solutions always satisfy all the con-straints (penalties vanish). Run times are short and competitive with those of
Figure 3
Stop if no accepted move for 5L iterations #equities n: 151 #portfolios: 110 L = 2n xi = 0 8i xi = 1 8i ½1 = 0.005 ½2 = 0.001 ½1 ! ½2: · 10 moves Time < 4"/portfolio Figure 4
Stop if no accepted move for 5L iterations #equities n: 151 #portfolios: 110 L = 2n xi = 0 8i xi = 0:2 8i ½1 = 0.005 ½2 = 0.001 ½1 ! ½2: · 10 moves Time < 3"/portfolio
the quadratic simplex method (less than 4 seconds per portfolio).
6.4
Trading constraints
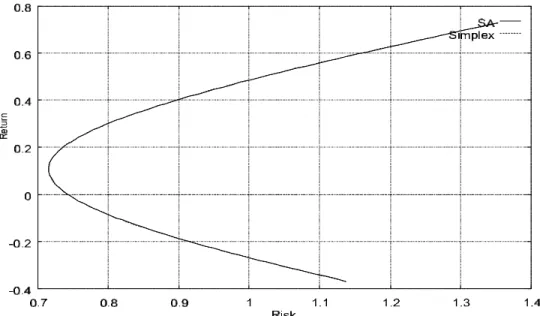
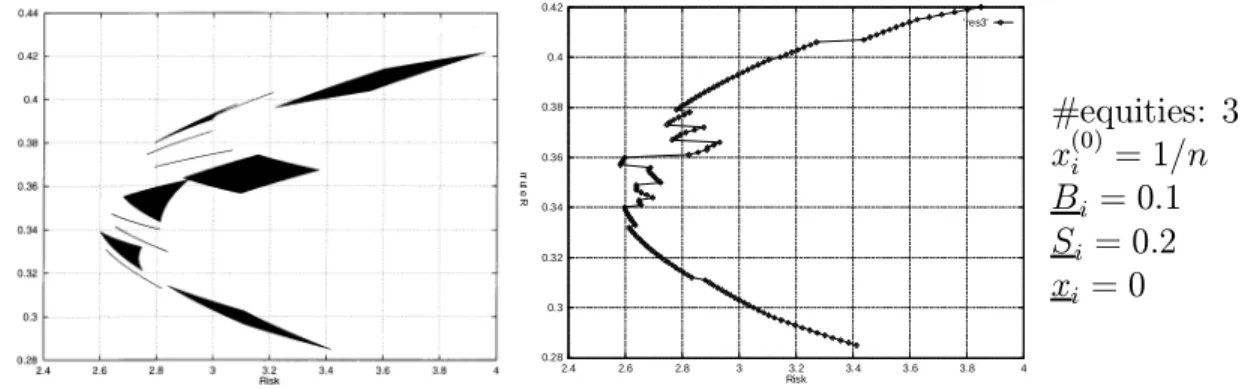
When the model only involves °oor, ceiling and turnover constraints, the mean-variance frontiers are smooth curves. When we introduce trading constraints, however, sharp discontinuities may arise. This is vividly illustrated by Figure 5: here, we have selected three securities and we have plotted all (mean return,risk)-pairs corresponding to feasible portfolios of these three securities. Observe that disconnected regions appear. (Similar observations are made by Chang et al. in [5].) Figure 6 shows the outcome provided by the simulated annealing algorithm: notice that the algorithm perfectly computes the mean-variance frontier for this small example.
Figure 5: all portfolios 0.28 0.3 0.32 0.34 0.36 0.38 0.4 0.42 2.4 2.6 2.8 3 3.2 3.4 3.6 3.8 4 R e tu rn Risk 'res3' Figure 6: SA frontier #equities: 3 x(0)i = 1=n Bi = 0:1 Si = 0:2 xi = 0
When the number of securities increases, the optimization problem becomes extremely di±cult to solve. Figure 7 illustrate the results produced by the basic SA algorithm for the whole set of 151 securities, with trading constraints de¯ned as follows:
² Bi =Si = 0:05 (i = 1; : : : ; n);
² the initial portfolio x(0) is the best portfolio of 20 stocks with an expected
return of 0.24% (see Section 6.5 hereunder).
The computation times remain reasonable (about 10 seconds per portfolio). However, as expected, the frontier is not as smooth as in the simpler cases. The question is to know whether we succeeded in computing the actual frontier or whether the SA algorithm erred in this complex case. The simplex method cannot be used anymore to compute the optimal solutions, because of the mixed integer constraints. Therefore, we have carried out some additional experiments in order to better assess the performance of our algorithm.
First, we have used the commercial package LINGO in order to model and to solve a small instance of the problem. Indeed, LINGO allows to handle nonlinear programming problems involving both continuous and binary variables and to solve such problems to optimality by branch-and-bound. Computation times, however, increase sharply with the size of problem instances. We have therefore restricted the set of underlying assets to 30 equities, with N = 5. A visual comparison between the results obtained by the SA algorithm and by LINGO is provided in Figure 8. We observe that the SA algorithm obtains near optimal solutions for all target returns, within short computational times.
For another test, we have run new experiments on the full data set of 151 equities, using now the three intensi¯cation strategies described in the previous section. Globally, intensi¯cation tends to improve the results obtained by the basic algorithm (see Figure 9). However, there is no clear dominance between the three strategies tested. This is rather disappointing, if one remembers that strategy 1 simply consists in running several times the SA algorithm from the
Figure 7
Stop if no accepted move for 5L iterations #equities n: 151 #portfolios: 110 L = 2n x(0)i jN = 20 Bi = 0:05 8i Si = 0:05 8i ½1 = 0.005 ½2 = 0.001 ½1 ! ½2: · 10 moves Time: 10"/portfolio Figure 8
Stop if no accepted move for 5L iterations #equities n: 30 #portfolios: 30 L = 3n xi = 0 8i xi = 1 8i x(0)i jN = 5 Bi = 0:1 8i ½1 = 0.005 ½2 = 0.001 ½1 ! ½2: · 10 moves Time < 0.5"/portfolio Figure 9
Stop if no accepted move for 5L iterations #equities n: 151 #portfolios: 50 L = 2n x(0)i jN = 20 Bi = 0:05 8i Si = 0:05 8i ½1 = 0.005 ½2 = 0.001 ½1 ! ½2: · 10 moves Time Intens1: 35"/portfolio Intens2: 34"/portfolio Intens3: 49"/portfolio
Figure 10
L = 2n or n2 orn3
Stop if no accepted move: 5L iterat. when L = 2n, 3nL iterat. when L = n2, 2L iterat. when L = n3. #equities n: 151 #portfolios: 50 x(0)i jN = 20 Bi = 0:05 8i Si = 0:05 8i ½1 = 0.005 ½2 = 0.001 ½1 ! ½2: · 10 moves L = 2n: 10"/portfolio L = n2: 23'42"/portfolio L = n3: 7h58'/portfolio Figure 11
Stop if no accepted move for 5L iterations #equities n: 151 #portfolios: 110 L = 2n or n2 N = 20 ½1 = 0.005 ½2 = 0.001 ½1 ! ½2: · 10 moves Time: L = 2n: < 4"/portfolio L = n2: 4'44"/portfolio Figure 12
Stop if no accepted move for 5L iterations #equities n: 30 #portfolios: 30 L = 2n xi = 0 8i xi = 1 8i N = 20 ½1 = 0.005 ½2 = 0.001 ½1 ! ½2: · 10 moves Time: < 0.15"/portfolio
same initial solution. This observation suggests that increased running time, allowing for more exploration of the solution space, may be the key element in improving the performance of the SA algorithm. (Notice that similar conclusions have been drawn by other authors working with simulated annealing algorithms; see e.g. [1] or [14]). On the other hand, restarting the process from promising solutions does not appear to help much (probably because the features of these solutions are lost in the high-temperature phase of the SA algorithm).
In order to con¯rm these tentative conclusions, we have run again the basic SA algorithm on the same instances without intensi¯cation, but with much larger values of the stage lengthL, i.e. with L = n2 andL = n3 (see Section 5.1). The
stopping criterion is adapted forL = n2 to make sure that is it at least as strict
as for L = n3. In this way, we ensure that the improvement obtained for L = n3
is due to the increase of L and not to the stopping criterion. The results of this experiment are displayed in Figure 10. On the average, over the whole range of target values, the standard deviation of the portfolio improves by 7% when L = n2 and by 13% when L = n3. The largest improvements are attained for
intermediate values of the target return. It should be mentioned, however, that such improvements come at the expense of extremely long running times (about 8 hours per portfolio whenL = n3).
6.5
Maximum number of securities
Let us now consider a cardinality constraint limiting the number of assets to be included in the portfolio. Figure 11 displays the results obtained with the basic SA algorithm when we only allow N = 20 assets in the portfolio (without any other constraints in the model, besides the return and budget constraints).
In spite of the combinatorial nature of the cardinality restriction, the com-putation of the mean-variance frontier is rather e±cient for this problem. The solutions obtained by the SA algorithm are always feasible (i.e., no penalties remain when the algorithm terminates). Moreover, the graph in Figure 11 for L = 2n is very smooth: this suggests that the SA algorithm may have achieved near-optimal solutions for all values of the target returns. In order to validate this hypothesis, we performed some experiments with larger stage lengths (L = n2),
and were only able to record minor improvements. We also ran LINGO on a subsample of 30 assets, with N = 5; for this smaller instance, the SA algorithm perfectly computed the whole mean-variance frontier (Figure 12).
6.6
Complete model
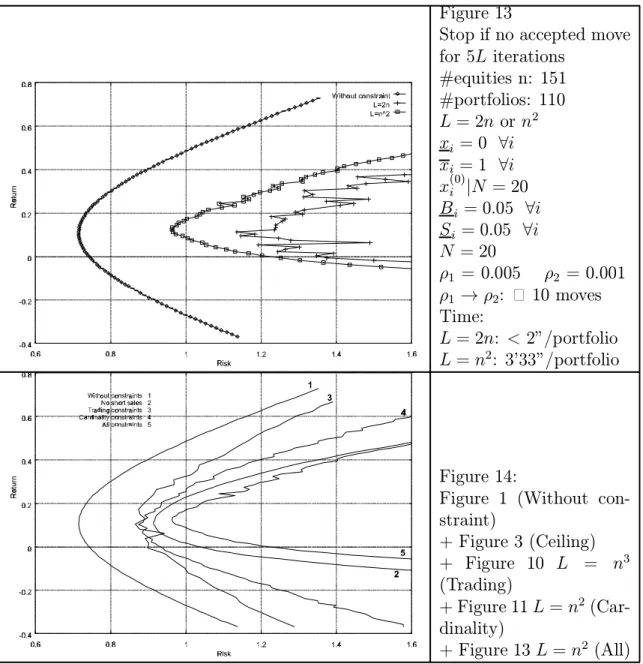
Investigating each class of constraint separately was important in order to un-derstand the behavior of the algorithm, but our ¯nal aim was to develop an approach that could handle more realistic situations where all the constraints are simultaneously imposed. Figure 13 illustrates the results obtained by the basic
SA algorithm withL = 2n or L = n2 for such a complex instance. Observe that,
here again, the results obtained whenL = n2 are signi¯cantly better than when
L = 2n. Even with the higher value of L, however, the computation time remains reasonably low.
Figure 14 sums up all the previous results. It illustrates the e®ect of each class of constraints on the problem and allows some comparison of the mean-variance frontiers computed in each case.
Figure 13
Stop if no accepted move for 5L iterations #equities n: 151 #portfolios: 110 L = 2n or n2 xi = 0 8i xi = 1 8i x(0)i jN = 20 Bi = 0:05 8i Si = 0:05 8i N = 20 ½1 = 0.005 ½2 = 0.001 ½1 ! ½2: · 10 moves Time: L = 2n: < 2"/portfolio L = n2: 3'33"/portfolio Figure 14:
Figure 1 (Without con-straint) + Figure 3 (Ceiling) + Figure 10 L = n3 (Trading) + Figure 11L = n2 (Car-dinality) + Figure 13 L = n2 (All)
7
Conclusions
Portfolio selection gives rise to di±cult optimization problems when realistic side-constraints are added to the fundamental Markowitz model. Exact optimization algorithms cannot deal e±ciently with such complex models. It seems reason-able, therefore, to investigate the performance of heuristic approaches in this framework.
Simulated annealing is a powerful tool for the solution of many optimization problems. Its main advantages over other local search methods are its °exibil-ity and its abil°exibil-ity to approach global optimal°exibil-ity. Most applications of the SA metaheuristic, however, are to combinatorial optimization problems. In particu-lar, its applicability to portfolio selection problems is not fully understood, yet. The main objective of this paper was therefore to investigate the adequacy of simulated annealing for the solution of a di±cult portfolio optimization model.
As SA is a metaheuristic, there are quite a lot of choices to make in order to turn it into an actual algorithm. We have developed an original way to generate neighbors of a current solution. We have also proposed speci¯c approaches to deal with each speci¯c class of constraint, either by explicitly restricting the portfolios to remain in the feasible region or by penalizing infeasible portfolios.
Let us now try to draw some conclusions from this research. On the positive side, we can say that the research was successful, in the sense that the resulting algorithm allowed us to approximate the mean-variance frontier for medium-size problems within acceptable computing times. The algorithm is able to handle more classes of constraints than most other approaches found in the literature. Although there is a clear trade-o® between the quality of the solutions and the time required to compute them, the algorithm can be said to be quite versatile since it does not rely on any restrictive properties of the model. For instance, the algorithm does not assume any underlying factor model for the generation of the covariance matrix. Also, the objective function could conceivably be replaced by any other measure of risk (semi-variance or functions of higher moments) without requiring any modi¯cation of the algorithm. This is to be contrasted with the algorithms of Perold [24] or Bienstock [2], which explicitly exploit the fact that the objective function is quadratic and that the covariance matrix is of low rank. On the negative side, it must be noticed that the tailoring work required to account for di®erent classes of constraints and to ¯ne-tune the parameters of the algorithm was rather delicate. The trading constraints, in particular, are especially di±cult to handle because of the discontinuities they introduce in the space of feasible portfolios. Introducing additional classes of constraints or new features in the model (e.g., transaction costs) would certainly prove quite di±cult again.
Acknowledgments. The authors are grateful to an anonymous reviewer for several helpful comments. The ¯rst author acknowledges partial ¯nancial
support by the O±ce of Naval Research (grant N00014-92-J1375), by NSF (grant DMS-98-06389) and by the project TMR-DONET ERB FMX-CT98-0202 of the European Community.
References
[1] Aarts E., Lenstra J.K., Local Search in Combinatorial Optimization, John Wiley & Sons, 1997.
[2] Bienstock D., Computational study of a family of mixed-integer quadratic programming problems,Mathematical Programming 74 (1996) pp. 121-140. [3] Catanas F., On a neighbourhood structure for portfolio selection problems,
Working paper, Centre for Quantitative Finance, Imperial College, London, 1998.
[4] ·Cern¶y V., Thermodynamical approach to the travelling salesman problem: An e±cient simulation algorithm, Journal of Optimization Theory and Ap-plications 45 (1985) pp. 41-51.
[5] Chang T.J., Meade N., Beasley J.E. and Sharaiha Y.M., Heuristics for cardi-nality constrained portfolio optimisation,Computers & Operations Research 27 (2000) pp. 1271-1302.
[6] Computational Science Education Project, Mathematical Optimization, Electronic book at http://csep1.phy.ornl.gov/mo/mo.html, 1995.
[7] Constantinides G.M., Malliaris A.G., Portfolio theory, in: Finance, R.A. Jar-row, V. Maksimovic and W.T. Ziemba (eds.), Elsevier Science, Amsterdam, 1995, pp. 1-30.
[8] Dahl H., Meeraus A., Zenios S.A., Some ¯nancial optimization models: I Risk management, in: Financial Optimization, S.A. Zenios (ed.), Cambridge University Press, 1996, pp. 3-36.
[9] Dekkers A., Aarts E., Global optimization and simulated annealing, Mathe-matical Programming 50 (1991) pp. 367-393.
[10] Dembo R.S., Mulvey J.M., Zenios S.A., Large-scale nonlinear network mod-els and their application, Operations Research 37 (1989) pp. 353-372. [11] Elton E.J., Gruber M.J.,Modern Portfolio Theory and Investment Analysis
[12] Hamza F., Janssen J., Extension r¶ealiste pour la s¶election de portefeuilles en pr¶esence des co^uts de transaction, Working paper, Universit¶e Libre de Bruxelles, 1997.
[13] Ingber L., Wehner M.F., Jabbour G.M., Barnhill T.M., Application of statis-tical mechanics methodology to term structure bond-pricing models, Math-ematical and Computer Modelling 15 (1991) p. 77.
[14] Johnson D.S., Aragon C.R., McGeoch L.A., Scevon C., Optimization by sim-ulated annealing: An experimental evaluation. Part I, Graph partitioning, Operations Research 37 (1989) pp. 865-892.
[15] Kirkpatrick S., Gelatt C.D., Vecchi P.M., Optimization by simulated anneal-ing, Science 220 (1983) pp. 671-680.
[16] Konno H., Yamazaki H., Mean-absolute deviation portfolio optimization model and its applications to Tokyo stock market, Management Science 37 (1991) pp. 519-531.
[17] Levy H., Sarnat M., Portfolio and Investment Selection: Theory and Prac-tice, Prentice-Hall International, 1984.
[18] Loraschi A., Tettamanzi A., Tomassini M., Verda P., Distributed genetic algorithms with an application to portfolio selection problems, in: Proc. Int. Conf. on Arti¯cial Neural Networks and Genetic Algorithms ICANNGA95, D.W. Pearson, N.C. Steele and R.F. Albrecht (eds.), Springer-Verlag, 1995, pp. 384-387.
[19] Lov¶asz L., Simonovits M., Random walks in a convex body and an improved volume algorithm,Random Structures and Algorithms 4 (1993) pp. 359-412. [20] Luenbeger D.G.,Investment Science, Oxford University Press, 1998.
[21] Markowitz H.M., Portfolio selection, Journal of Finance 7 (1952) pp. 77-91. [22] Nakasato M., Furukawa K., On the number of securities which constitute an
e±cient portfolio, Annals of Operations Research 45 (1993) pp. 333-347. [23] Osman I.H., Laporte G., Metaheuristics: A bibliography, Annals of
Opera-tions Research 63 (1996) pp. 513-623.
[24] Perold A.F., Large-scale portfolio optimization, Management Science 30 (1984) pp. 1143-1160.
[25] Pirlot M., General local search heuristics in combinatorial optimization: A tutorial, Belgian Journal of Operations Research, Statistics and Computer Science 32 (1992) pp. 7-68.
[26] Takehara H., An interior point algorithm for large scale portfolio optimiza-tion, Annals of Operations Research 45 (1993) pp. 373-386.
[27] van Laarhoven P.J.M, Aarts E.H., Simulated Annealing: Theory and Appli-cations, Kluwer Academic Publishers, 1988.
[28] Wolfe P., The simplex method for quadratic programming,Econometrica 27 (1959) pp. 382-398,
[29] Zabinsky Z.B., Smith R.L., McDonald J.F., Romeijn H.E., Kaufman D.E., Improving hit-and-run for global optimization, Journal of Global Optimiza-tion 3 (1993) 171-192.