Full Terms & Conditions of access and use can be found at
https://www.tandfonline.com/action/journalInformation?journalCode=tapx20
Advances in Physics: X
ISSN: (Print) (Online) Journal homepage: https://www.tandfonline.com/loi/tapx20
State-to-state dissociative photoionization of
molecular nitrogen: the full story
T. Ayari , M. Desouter-Lecomte , R. Linguerri , G. A. Garcia , L. Nahon , A. Ben Houria , H. Ghalila , R. Ben Said & M. Hochlaf
To cite this article: T. Ayari , M. Desouter-Lecomte , R. Linguerri , G. A. Garcia , L. Nahon , A. Ben Houria , H. Ghalila , R. Ben Said & M. Hochlaf (2020) State-to-state dissociative
photoionization of molecular nitrogen: the full story, Advances in Physics: X, 5:1, 1831955, DOI: 10.1080/23746149.2020.1831955
To link to this article: https://doi.org/10.1080/23746149.2020.1831955
© 2020 The Author(s). Published by Informa UK Limited, trading as Taylor & Francis Group.
Published online: 23 Oct 2020.
Submit your article to this journal
View related articles
REVIEW
State-to-state dissociative photoionization of molecular
nitrogen: the full story
T. Ayaria,b, M. Desouter-Lecomte c, R. Linguerria, G. A. Garcia d, L. Nahon d,
A. Ben Houriab, H. Ghalilab, R. Ben Saide and M. Hochlafa
aCOSYS/LISIS, Université Gustave Eiffel, Champs-sur-Marne, France; bLaboratoire De
Spectroscopie Atomique, Moléculaire Et Applications – LSAMA, Université De Tunis El Manar, Tunis, Tunisia; cInstitut De Chimie Physique, UMR8000, Université Paris-Saclay, CNRS, Orsay,
France; dSynchrotron SOLEIL, L’orme Des Merisiers, Saint-Aubin, Gif-sur-Yvette Cedex, France; eDepartment of Chemistry, College of Science and Arts, Qassim University, Ar Rass, Saudi
Arabia ABSTRACT
N2 is a major constituent of Earth and planetary
atmo-spheres. First, evidenced in 1952, the dissociative photo-ionization of molecular nitrogen, N2, plays an important
role in the species abundance, out of equilibrium evolu-tion, and chemical reactivity of diverse media including upper atmospheres (the so-called ionospheres) and plasma. Many scenarios were proposed for rationalizing the dissociative ionization mechanisms and exit chan-nels, which are reviewed here, mainly involving the N2+
(C2∑u+, v+) vibrational levels state-to-state dynamics on
which we focus. We show, however, that previous stu-dies are not comprehensive enough for fully shedding light on the complex undergoing processes. As a complementary global work, we used state-of-the-art quantum chemistry, time dependent and independent theoretical approaches associated to advanced experi-mental techniques to study the unimolecular decompo-sition of the N2+ ions forming the N+ + N products. In
addition to the already suggested spin-orbit-induced predissociation of the cationic C2∑u+ state, we
documen-ted a new mechanism based on vibronic coupling and tunneling dissociation. Besides, the quantum processes highlighted here should be also in action in the dynamics of electronically excited larger molecular sys-tems involved in physical and chemical phenomena in plasma and in various natural environments on Earth and beyond. ARTICLE HISTORY Received 20 May 2020 Accepted 29 September 2020 KEYWORDS Molecular nitrogen; photoionization; ab initio computations; dynamical computations; state-to-state reactions
CONTACT M. Hochlaf hochlaf@univ-mlv.fr COSYS/LISIS, Université Gustave Eiffel, Champs-sur-Marne, 77454, France
Presently at Department of Physics, Khalifa University, P.O. Box 127788, Abu Dhabi, United Arab Emirates 2020, VOL. 5, NO. 1, 1831955
https://doi.org/10.1080/23746149.2020.1831955
© 2020 The Author(s). Published by Informa UK Limited, trading as Taylor & Francis Group.
This is an Open Access article distributed under the terms of the Creative Commons Attribution License (http://creativecommons.
org/licenses/by/4.0/), which permits unrestricted use, distribution, and reproduction in any medium, provided the original work is
I. Introduction
The dissociative photoionization of molecular nitrogen, N2, plays an important role in diverse media such as the upper Earth’s atmosphere (ionospheres), in planetary atmospheres, in astrophysical media (inter-stellar medium) and in plasma. Indeed, atomic and molecular nitrogen and their ions are important species in planetary science and astrophy-sics because of the relatively large N2/H2 universal abundance ratio of 1.6 × 10⁻⁴. In particular, molecular nitrogen is a major constituent of Earth’s atmosphere [1] and of the upper atmospheres of Jupiter, Saturn and its largest moon Titan [2,3,4]. It protects the Earth from high-energy vacuum ultraviolet (VUV) and extreme ultraviolet (XUV) radiations and plays a major role in the chemistry of the thermosphere [5,6]. The photochemistry of N2 in a variety of environments, e.g., the interstellar medium, extrasolar planets, and circumstellar envelops is believed to be responsible for the synthesis of N-containing molecules, including pre-biotic molecules (e.g., HCN, CH3CN) [7–9], which are precursors of larger molecules such as the building blocks of life [10–12], and also triggers the formation of N-containing aerosols such as those found in Titan’s atmosphere [13].
VUV and XUV radiations interacting with neutral N2 lead to its ionization and its dissociative ionization to form N2+ and N + N+, respectively. In addition, the neutral dissociation of N2 by absorbing VUV light produces excited N radical atoms and even excited N+ ions [14,15,16]. These processes take place, for instance, in Earth’s upper atmosphere after absorption of the solar radiation in the VUV and XUV ranges [17]. They occur along the potential energy curves (PECs) of the electronic-excited states of the N2+ cation, where both spin-orbit and
nonadiabatic relaxation phenomena are in action. N2+ is also formed in the bow shock wave found in front of heat shields during entry into the Earth’s atmosphere. Moreover, it is suspected to be responsible for the escape of He+ ions from the atmosphere after charge transfer collisions between N2+ and neutral He [18]. For the realistic modeling of these phenomena, one needs accurate descriptions of the electronic states of this ion and in-depth understanding of its formation and destruction dynamics via N2 photo – and dissociative ionizations.
The dissociative photoionization of molecular nitrogen was evidenced for the first time in 1952. Since then, several scenarios were proposed in order to explain the formation of the N + N+ fragments following the predissociation of the cation. These works are reviewed in Section 2. However, we will show, that the various involved processes are complex and cannot be understood within a single picture. At present, we per-formed complementary experimental works on the single photon ioniza-tion of N2 using synchrotron VUV light source coupled to advanced double imaging electron/ion coincidence detector. We investigated the dynamics of the N2+ cation on a newly computed set of N2+ PECs and their couplings using two well-established state-of-the-art theoretical methodologies. These up-to-date experimental and theoretical results complement those already available. The full examination of the pro-cesses that may occur upon formation of an N2+ ion reveals that, in addition to the already suggested spin-orbit-induced predissociation, which are in action for the low vibrational levels of the N2+(C2∑u+) state, the upper levels correspond to resonances, which dissociation is documented here for the first time. In summary, we shed light on the complex dynamics undertaken by the N2+ ions forming the N+ + N products, which remained not fully explained for more than 60 years. This work should help in understanding the state-to-state complex dynamics of electronically excited larger molecular systems relevant for astrophysics, planetary sciences and in plasma physics. Indeed, N2+ C state represents a prototype molecular system, where the observed features and processes are easily found in large molecules.
II. Overview on the dissociative ionization of N2 via the N2+(C2∑u+) state
Back in 1952, Douglas [19] observed a strong enhancement of the N2+ (C2∑u+, v+ = 3) bands in a He + N2 discharge. He showed that this is due to inverse predissociation, i.e. N(4S) + N+(3P) → N2+(C2∑u+), where the N+ ions are produced via charge transfer reactions involving the He+ ions. In 1959, Carroll [20] documented the direct predissocia-tion of the C state to form N+ + N, which occurs in the vicinity of the v+ = 3 level. Since then, a multitude of experimental and theoretical
works were devoted to the identification of the mechanism(s) respon-sible for this predissociation. Indeed, the production of N+ ions was studied using mass spectrometry [21–24]. The N2+(C2∑u+) ions are also characterized to be long-lived enough to fluoresce and hence are responsible for the second negative system of N2+ (i.e. the C2∑u+–X2 ∑g+ emission transition). In the early seventies, Wankenne and Momigny [21] determined a lifetime of 0.8 μs for the N2+(C2Σu+) ion before radiationless decomposition. However, a much shorter radiative lifetime (τ(v+ ≤ 2) = 0.09 μs) was deduced by Govers and co- workers [24,25] using either electron or ion impact-induced N2+(C2 ∑u+) predissociation. In 1976, Erman [26] rationalized both observa-tions after direct measurement of the lifetimes of the N2+(C2∑u+, v+ = 1–5) vibrational levels using high-resolution high-frequency deflection technique. He determined a radiative lifetime of 78.9 ±3.0 ns for v+ = 2 level and lifetimes of 4–5 ns for v+ ≥ 3 and attributed the sharp drop of these lifetimes to the already noticed predissociation of the v+ ≥ 3 states populating the lowest dissociation limit, L1: N(4S) + N+(3P). The corresponding predissociation rate was measured ~2 x 10⁸ s−1. In 1974, Asbrink and Fridh [27] observed the population of the upper dissociation limits by dissociative ionization of N2. Later on, the threshold photoelectron-photoion coincidence spectroscopic investiga-tions of the valence and inner-valence states of N2+ by Nicolas et al. [28] and by Aoto et al. [29] measured the following branching ratios (BRs): BRs = 100% to the L1 limit for C state v+ levels located in the energy range between L1 (N+(3P) + N(4S)), and L2 (N+(1D) + N(4S)); for those located between L2 and L3 (N+(3P) + N (2D)), BRs ~ 60% to L1 and 40% to L2; and BRs ~ 100% to L3 for those located above L3. Recent experimental and theoretical investigation dealing with the dissociation dynamics of N2+ induced by isolated attosecond XUV pulses in combination with few-optical-cycle near-infrared/visible (NIR/VIS) pulses showed that most of the N2+ ions decay to populate L2 (BR = 77.1%) and L3 (BR = 14.0%) and to a lesser extent the following upper limit L4 (BR = 8.5%), whereas a 0% branching ratio is measured for L1 [30]. The use of higher energy XUV femtosecond light induces the population of the upper dissociation limits of N2+ [31]. In sum, different BRs are measured depending on the specific vibrational or electronic states of N2+ populated by ionizing N2(X1∑g+ ). Moreover, Govers and co-workers showed the existence of a large isotope effect on these predissociations [25,32–36]. All these findings are the signature of a complex dynamics undergone by the N2+ ions.
In the 24–28 eV energy domain above N2(X1∑g+, v” = 0), the formation of the N+ + N pair corresponding to the dissociation limits L1, L2 and L3 is ascribed to the predissociation of the N2+(C2∑u+) state. The question of
which states are involved in such predissociation has been the subject of much discussions in the course of which several scenarios were suggested [26,28,37–44]. They can be gathered into two main mechanisms known as the ‘direct’ and the ‘accidental’ mechanisms. The direct predissociation involves the conversion into the continuum of the N2+(B2∑u+) state either due to finite vibrational interaction or after crossing a repulsive state, or a repulsive part of an attractive state. On the other hand, the accidental predissociation starts by the population of a bound intermediate state, which is then predissociated by a second repulsive state. In both cases, the implication of the N2+ quartet states and their spin-orbit couplings with the neighboring doublets was invoked. Up-to-date, none of these mechanisms, however, fully explained the state-to-state dissociative photoionization of N2 and the subsequent complex unimolecular decomposition dynamics undertaken by the N2+(C2∑u+, v+) ions.
III. On the potentials and couplings of the N2+ ion
a. Potential energy curves
The full interpretation of the state-to-state dissociative photoionization of N2 requires the mapping of the PECs of all N2+ cationic electronic states correlating to L1, L2 and L3 and those electronic states correlating to the upper asymptotes lying in energy below 28 eV with respect to N2(X1∑g+, v” = 0). We thus computed N2+ states of doublet, quartet, and sextet spin multiplicities in both ungerade and gerade symmetries. The electronic calculations were performed using the MOLPRO 2015 program suite [45] in the D2h point group symmetry. We used the complete active space self- consistent field (CASSCF) [46,47] technique followed by the internally contracted multi-reference configuration interaction (MRCI) [48–50] approach. We described the nitrogen atom by a large basis set of aug-cc- pV5Z quality [51,52], which is augmented by 3s and 2p diffuse Gaussian- type orbitals (GTOs). This results in 254 contracted Gaussian functions, to be used. In CASSCF, the active space was composed of the valence mole-cular orbitals (MOs) of N2+ to which we added one σg and one πg MOs for better relaxation of the wavefunctions of the N2+ electronic states whose configurations differ in their σ and π orbital occupations. We used an active space larger than the valence and a diffuse basis set for better description of the possible diffuse nature of the valence-Rydberg states of N2+ as discussed for neutral N2 [53,54]. For MRCI calculations, all configurations in the CI expansion of the CASSCF wavefunctions were taken as a reference and all valence electrons were correlated. Hence, we considered more than 4.8 × 10⁸ uncontracted configuration state functions per symmetry. Using these highly correlated wavefunctions, we deduced the radial, the rotational and
the spin-orbit couplings between the electronic states involved in the C2∑u+ state predissociation. The spin-orbit integrals were evaluated, in Cartesian coordinates, over the MRCI wavefunctions, where the effective Breit-Pauli SO operator, HSO, as implemented in MOLPRO was used [55].
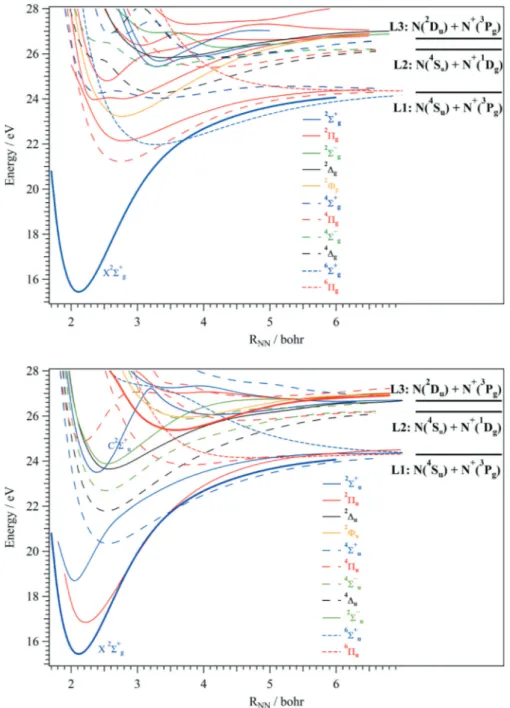
The N2+ MRCI/aug-cc-pV5Z PECs are displayed in Figure 1. For the bound states, the respective potential energy curves were incorporated into nuclear motion treatments in order to deduce a set of spectroscopic con-stants for the N2+ states. Thus, we used the method of Cooley [63] and the derivatives at the minimum energy distances and standard perturbation theory. The corresponding data are listed in Table 1. This table lists the spectroscopic parameters of the bound states including their equilibrium distances, vibrational and rotational constants, and excitation energies. The comparison to the previous experimental and previous theoretical data shows an overall good agreement, asserting the good quality of our PECs. The pattern of the vibrational levels of the C2∑u+ state is also obtained using a variational treatment and time-dependent approach.
Figure 1 shows the high density of electronic states lying in the vicinity of the N2+ (C2∑u+) state that may participate to its direct or accidental predissociation mechanisms. Both of them require the couplings with the N2+(C2∑u+) state either by vibronic or spin-orbit couplings and the subsequent mixings of their wavefunctions. Nevertheless, standard selection rules reveal that only ungerade electronic states are in action in the dissociative single photon ionization of N2, ruling out the contribution of the gerade states in this energy domain. Moreover, only quartet electronic states correlate adiabatically to the second dissociation limit L2. Thus, their implication cannot be excluded for the formation of, at least, N+(1D) + N products. Consequently, we present in
Figures 2 and 3 the electronic states and their mutual couplings that are
a priori participating to the formation of N + N+ ions in the 24–28 eV energy domain.
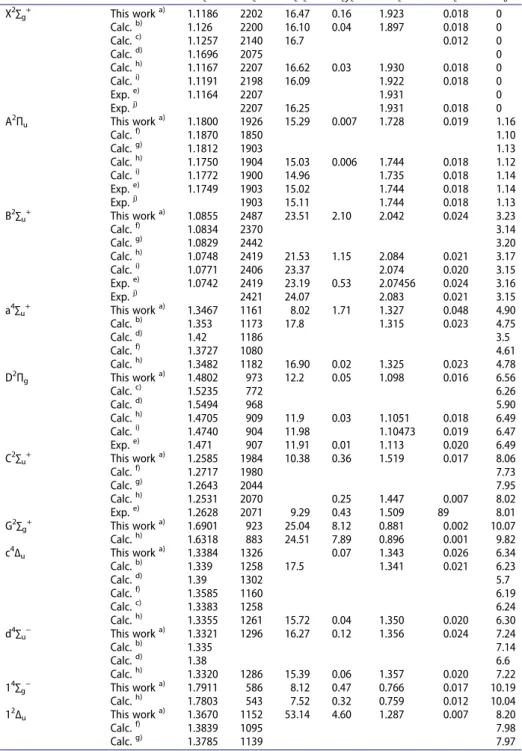
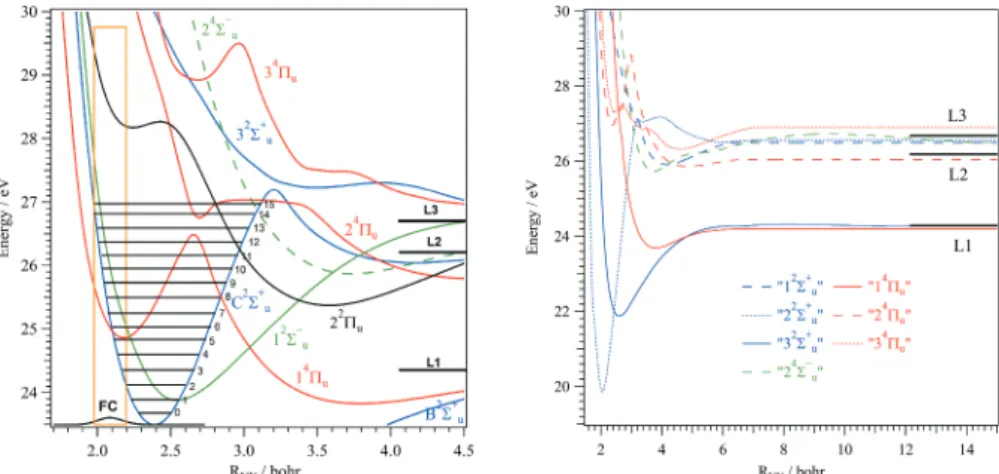
Figure 2 shows that the adiabatic PEC of the C2∑u+ state exhibits two potential energy wells: the inner potential where we locate 14 vibrational levels and two quasi-bound shape resonances; and the outer potential that also accommodates several bound levels with a large interatomic equili-brium distance (see Section VI). Both potential wells are separated by a barrier due to the avoided crossing with the 32∑u+ state. At these large internuclear separations, the C2∑u+ state interacts with the 32∑u+ state by radial coupling (Figure 3(a)) and with the lower B2∑u+ state as discussed in Refs [43,44]. The shape of the radial coupling between the C2∑u+ and 32∑u+ states (Figure 3(a)) exhibits a maximum for NN distances between 3–3.5 bohr i.e. close to the maximum of the C2∑u+ state potential barrier due to the avoided crossing between both states. This indicates thus that the excited vibrational states of the C2∑u+ state are coupled with the 32∑u+. Although the vibronic eigenstates have always components on both electronic states (cf.
Section VI), it is especially the highly excited vibrational states of the C2∑u+ state that are coupled with the 32∑u+ since an important part of these vibrational wavefunctions is located in the region where the radial coupling
Figure 1. MRCI/aug-cc-pV5Z potential energy curves of the gerade (top) and ungerade (bottom) electronic states of N2+. The reference energy is taken as that of N2 (X1∑g+, v” = 0). The adiabatic ionization energy of N2 is taken from Ref [74]. The lowest dissociation limit (L1 @ 24.2884 eV) is located as given in Ref [56]. L2 (@ 26.1874 eV) and L3 (@ 26.6724 eV) were located using the excitation energies of N+ and N, respectively. The thick line corresponds to N2+ ground state PEC.
Table 1. Spectroscopic constants of the electronic states of N2+ investigated in the present work. We give the equilibrium distance (Re in Å), vibrational constants (ωe, ωexe, ωeye, in cm−1)
and the rotational constants (Be, αe, in cm−1). T0 (in eV) is the adiabatic excitation energy
calculated as the difference between the energies of the minimum of the ground state and the minimum of the considered excited state including the zero point vibrational energy corrections. State Method Re ωe ωexe ωeye Be αe T0 X2∑ g+ This work a) 1.1186 2202 16.47 0.16 1.923 0.018 0 Calc. b) 1.126 2200 16.10 0.04 1.897 0.018 0 Calc. c) 1.1257 2140 16.7 0.012 0 Calc. d) 1.1696 2075 0 Calc. h) 1.1167 2207 16.62 0.03 1.930 0.018 0 Calc. i) 1.1191 2198 16.09 1.922 0.018 0 Exp. e) 1.1164 2207 1.931 0 Exp. j) 2207 16.25 1.931 0.018 0 A2Π u This work a) 1.1800 1926 15.29 0.007 1.728 0.019 1.16 Calc. f) 1.1870 1850 1.10 Calc. g) 1.1812 1903 1.13 Calc. h) 1.1750 1904 15.03 0.006 1.744 0.018 1.12 Calc. i) 1.1772 1900 14.96 1.735 0.018 1.14 Exp. e) 1.1749 1903 15.02 1.744 0.018 1.14 Exp. j) 1903 15.11 1.744 0.018 1.13 B2∑u+ This work a) 1.0855 2487 23.51 2.10 2.042 0.024 3.23 Calc. f) 1.0834 2370 3.14 Calc. g) 1.0829 2442 3.20 Calc. h) 1.0748 2419 21.53 1.15 2.084 0.021 3.17 Calc. i) 1.0771 2406 23.37 2.074 0.020 3.15 Exp. e) 1.0742 2419 23.19 0.53 2.07456 0.024 3.16 Exp. j) 2421 24.07 2.083 0.021 3.15 a4∑ u+ This work a) 1.3467 1161 8.02 1.71 1.327 0.048 4.90 Calc. b) 1.353 1173 17.8 1.315 0.023 4.75 Calc. d) 1.42 1186 3.5 Calc. f) 1.3727 1080 4.61 Calc. h) 1.3482 1182 16.90 0.02 1.325 0.023 4.78 D2Πg This work a) 1.4802 973 12.2 0.05 1.098 0.016 6.56 Calc. c) 1.5235 772 6.26 Calc. d) 1.5494 968 5.90 Calc. h) 1.4705 909 11.9 0.03 1.1051 0.018 6.49 Calc. i) 1.4740 904 11.98 1.10473 0.019 6.47 Exp. e) 1.471 907 11.91 0.01 1.113 0.020 6.49 C2∑u+ This work a) 1.2585 1984 10.38 0.36 1.519 0.017 8.06 Calc. f) 1.2717 1980 7.73 Calc. g) 1.2643 2044 7.95 Calc. h) 1.2531 2070 0.25 1.447 0.007 8.02 Exp. e) 1.2628 2071 9.29 0.43 1.509 89 8.01 G2∑ g+ This work a) 1.6901 923 25.04 8.12 0.881 0.002 10.07 Calc. h) 1.6318 883 24.51 7.89 0.896 0.001 9.82 c4∆ u This work a) 1.3384 1326 0.07 1.343 0.026 6.34 Calc. b) 1.339 1258 17.5 1.341 0.021 6.23 Calc. d) 1.39 1302 5.7 Calc. f) 1.3585 1160 6.19 Calc. c) 1.3383 1258 6.24 Calc. h) 1.3355 1261 15.72 0.04 1.350 0.020 6.30 d4∑ u− This work a) 1.3321 1296 16.27 0.12 1.356 0.024 7.24 Calc. b) 1.335 7.14 Calc. d) 1.38 6.6 Calc. h) 1.3320 1286 15.39 0.06 1.357 0.020 7.22 14∑ g− This work a) 1.7911 586 8.12 0.47 0.766 0.017 10.19 Calc. h) 1.7803 543 7.52 0.32 0.759 0.012 10.04 12∆ u This work a) 1.3670 1152 53.14 4.60 1.287 0.007 8.20 Calc. f) 1.3839 1095 7.98 Calc. g) 1.3785 1139 7.97 (Continued)
is large. The radial coupling between the C2∑u+ and B2∑u+ states is max-imum around 2.46 bohr [43], close to the minimum of the C2∑u+ state where the energy gap at the avoided crossing is larger than in the C2∑u+ – 32∑u+ interaction. It is noteworthy that the radial coupling overlap and that the two non-adiabatic interactions cannot be considered as separated two-by- two systems. Indeed, the three 2∑u+ states strongly interact. The 12∑u− and 24 ∑u− states are crossing the C2∑u+ state and may couple together by spin-orbit (Figure 3(d)). The 4πu states are also crossing the C2∑u+ state, where spin- orbit conversions may occur (Figure 3(d)). These states are also mutually coupled vibronically (Figure 3(b)).
Table 1. (Continued). State Method Re ωe ωexe ωeye Be αe T0 12∑ u− This work a) 1.3491 1393 24.04 0.33 1.322 0.011 8.26 Calc. f) 1.3547 1208 8.04 Calc. g) 1.3489 1228 8.03 Calc. h) 1.3325 1309 28.23 2.03 1.353 0.002 8.09 16∑ u+ This work a) 2.6622 0.339 0.362 8.93 f4Π u Inner potential This work a) 1.1488 2148 23.15 0.06 1.823 0.041 9.43 Calc. d) 1.19 2054 9.2 Calc. f) 1.1600 1986 9.44 Calc. c) 1.1580 2038 9.37 Calc. g) 1.1537 2104 9.40 Calc. h) 1.1515 2099 22.42 0.03 1.820 0.020 9.39 f4Π u Outer potential This work a) 1.9925 413 12.35 2.74 0.606 0.025 8.39 Calc. b) 2.008 8.19 Calc. d) 1.84 783 7.5 Calc. h) 2.0103 452 8.76 0.47 0.595 0.012 8.35 b4Π g This work a) 1.4389 1021 12.13 0.26 1.1562 0.019 5.86 Calc. h) 1.4483 1008 11.41 0.11 1.1477 0.017 5.75 22Π u This work a) 1.8929 639 7.18 0.17 0.671 0.004 9.93 Calc. d) 1.7594 911 9.30 Calc. c) 1.8726 705 9.13 Calc. h) 1.8857 657 4.98 0.39 0.677 0.007 9.67 24Π u This work a) 2.4106 399 3.22 2.09 0.414 0.019 10.36 Calc. h) 2.4278 353 2.94 0.27 0.408 0.004 10.29 24∑ u− This work a) 1.9897 532 14.55 3.38 0.60792 0.002 10.42 12Φ u This work a) 1.9661 599 21.07 1.20 0.62254 0.011 10.50 12Φ g This work a) 1.4663 1009 9.76 0.27 1.1304 0.02 7.66 Calc. h) 1.4606 997 9.80 0.15 1.1287 0.016 7.53 32Π u This work a) 2.8691 302 7.94 0.05 0.29234 0.001 11.57 32∑ u+ This work a) 3.1711 222 16.90 2.89 0.23995 0.012 11.81 a.MRCI/aug-cc-pV5Z. b.MRCI/AVQZ. Ref [41]. c.MRDCI/6-311 +G(2d). Ref [57]. d.CI. Ref [58]. e.Ref [59]. f.MRDCI/6-311 +G(2d). Ref [57].
g.Extended Gaussian basis sets and large CASSCF/multireference CI wave functions/(13s 8p 6d 4f)/[4s 3p 2d 1f] ANO. Ref [67].
h.icMRCI+Q/56+CV+DK. Ref [60]. i.MRCI/aug-cc-pCV5Z. Ref [61].
IV. Radiative, predissociative, and natural lifetimes of the N2+(C2∑u+, v+)
vibrational levels
The calculated potentials of Figure 2, spin-orbit couplings and dipole transition moments displayed in Figure 3, were incorporated into the LEVEL [64] and BCONT programs of Le Roy [65] to deduce the radiative and the spin–orbit-induced predissociation lifetimes of the vibrational levels of N2+.
The radiative lifetimes were deduced using the following formula
τrad;vþ¼ X
v00
1
Av0þv00þ
where Av0þv00þ corresponds to the spontaneous emission Einstein coefficient
from an ionic v’+ level to a v”+ level. This needs the transition moments between both initial and final electronic states as well as their potential energy curves. The data are given in Table 2. The validity of our approach was already noticed, for instance, for the SH (A2∑+) state through the direct comparison between our theoretical data and experimental measure-ments [66].
The C2∑u+ vibrational levels may decay radiatively to populate either the X2 ∑g+ or the D2Πg states (Figure 1). The dipole moments of the C-X and C-D of these allowed transitions are given in Figure 3(c). Table 2 lists the radiative lifetimes of N2+(C2∑u+, 0 ≤v+ ≤ 15) as computed using the LEVEL code [64]. For the C2∑u+_X2∑g+ radiative decays of the 0 ≤ v+ ≤ 6 levels, the corresponding radiative lifetimes are in a good agreement with the results deducted using the
Figure 2. Adiabatic (left) and diabatic (right) PECs of the ungerade excited states of N2+ involved in the predissociation branching ratios calculations of the N2+(C2∑u+) state. The reference energy is taken as that of N2(X1∑g+, v” = 0). For obtaining the diabatic PECs from the adiabatic ones, we used the B – C radial coupling from Ref [43]. in addition to the couplings presented in Figure 3
empirical RKR potentials [67]. Again, this confirms the good quality of our ab
initio PECs and dipole moments. When compared to previous experimental
radiative lifetimes, a good agreement is found with those measured by Govers and coworkers and by Erman for v+ ≤ 2 (Table 2). Nevertheless, none of them gave an accurate estimation for v+ ≥ 3 since it is hard to deduce these quantities from experiments. Table 2 shows that the C2∑u+_D2πg radiative decays affect the lifetimes of the upper levels of the C (v+ ≥ 7) states. It is worth noting that the lifetimes of the upper levels exhibit an irregular evolution, which may be related to the non-monotonic evolution of the corresponding transition dipole moments along the NN distance. Experimental measurements are welcomed for confirmation.
Table 2 gives also the predissociative lifetime obtained by three approaches. First, the lifetime is computed using the BCONT code [65]. We considered the C state spin-orbit-induced predissociation by the 14πu, 24
Figure 3. Radial couplings between the 2∑
u+ states (in A) and those between the 4πu states (in B). In C), we give the transition dipole moments between the C2∑u+ state and some electronic- excited states of N2+. In D), we plot the spin-orbit couplings between the electronic states depicted in Figure 2
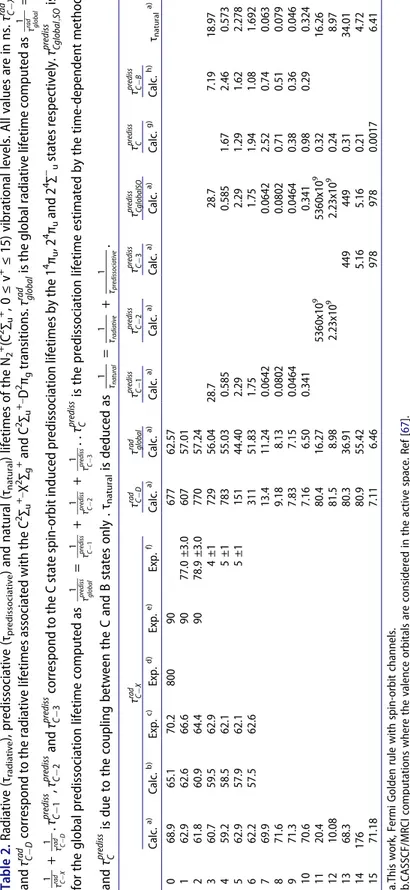
Table 2. Radiative (τradiative ), predissociative (τpredissociative ) and natural (τnatural ) lifetimes of the N2 + (C 2 ∑ u + , 0 ≤ v + ≤ 15) vibrational levels. All values are in ns. τ rad C X and τ rad C D correspond to the radiative lifetimes associated with the C 2 ∑ u +_ X 2 ∑ g + and C 2 ∑ u +_ D 2 π g transitions. τ rad global is the global radiative lifetime computed as 1 τ rad global = 1 τ rad C X + 1 τ rad C D . τ prediss C 1 , τ prediss C 2 and τ prediss C 3 correspond to the C state spin-orbit induced predissociation lifetimes by the 1 4 π u , 2 4 π u and 2 4 ∑ − u states respectively. τ prediss Cglobal ;SO is for the global predissociation lifetime computed as 1 τ prediss global = 1 τ prediss C 1 + 1 τ prediss C 2 + 1 τ prediss C 3 . . τ prediss C is the predissociation lifetime estimated by the time-dependent method and τ prediss C is due to the coupling between the C and B states only . τnatural is deduced as 1 τnatural = 1 τradiative + 1 τpredissociative . τ rad C X τ rad C D τ rad global τ prediss C 1 τ prediss C 2 τ prediss C 3 τ prediss CglobalSO τ prediss C τ prediss C B τnatural a) Calc. a) Calc. b) Exp. c) Exp. d) Exp. e) Exp. f) Calc. a) Calc. a) Calc. a) Calc. a) Calc. a) Calc. a) Calc. g) Calc. h) 0 68.9 65.1 70.2 800 90 677 62.57 1 62.9 62.6 66.6 90 77.0 ±3.0 607 57.01 2 61.8 60.9 64.4 90 78.9 ±3.0 770 57.24 3 60.7 59.5 62.9 4 ±1 729 56.04 28.7 28.7 7.19 18.97 4 59.2 58.5 62.1 5 ±1 783 55.03 0.585 0.585 1.67 2.46 0.573 5 62.9 57.9 62.1 5 ±1 151 44.40 2.29 2.29 1.29 1.62 2.278 6 62.2 57.5 62.6 311 51.83 1.75 1.75 1.94 1.08 1.692 7 69.9 13.4 11.24 0.0642 0.0642 2.52 0.74 0.063 8 71.6 9.18 8.13 0.0802 0.0802 0.71 0.51 0.079 9 71.3 7.83 7.15 0.0464 0.0464 0.38 0.36 0.046 10 70.6 7.16 6.50 0.341 0.341 0.98 0.29 0.324 11 20.4 80.4 16.27 5360x10 9 5360x10 9 0.32 16.26 12 10.08 81.5 8.98 2.23x10 9 2.23x10 9 0.24 8.97 13 68.3 80.3 36.91 449 449 0.31 34.01 14 176 80.9 55.42 5.16 5.16 0.21 4.72 15 71.18 7.11 6.46 978 978 0.0017 6.41 a.This work, Fermi Golden rule with spin-orbit channels. b.CASSCF/MRCI computations where the valence orbitals are considered in the active space. Ref [ 67 ]. c.Derived using an RKR potential using available experimental data. Ref [ 67 ]. d.Ref [ 21 ]. e.Govers and co-workers. Refs. [ 24 , 25 ]. f.Erman [ 26 ] using high-resolution High Frequency Deflection technique. g.This work, time-dependent method. h.Fermi Golden rule with B state, Ref [ 43 ].
πu and 24∑−u states, respectively. Mainly, the predissociative 0 ≤ v+ ≤ 10 levels lifetimes are due to the 14πu induced predissociation leading to L1. For the upper levels, the 24πu and 24∑−u states are in action populating thus L2 and L3. Nevertheless, the corresponding lifetimes are somehow too long to be a realistic, signature of another dynamics (cf. Section VI). Second, we extract a lifetime from the time evolution of the norm P(t) of the wave packet initially prepared in a vibrational level of the C state. By adding an absorbing complex potential in the asymptotic region in each electronic state, the decrease of the total norm is a signature of the dissociation through the different channels. Note that the decay is always non- exponential and the rate is estimated from the initial quasi linear part of ln(P(t)). Finally, we report the lifetimes computed by the Fermi Golden rule in Ref [43] by considering the interaction between the C and B states only. In summary, the first method focuses on the spin-orbit coupling and dis-cards the strong non-adiabatic interaction while the third one disdis-cards both the spin-orbit and the important interaction with the 32∑u+ state, which has a strong influence on the dynamics. It is thus not surprising that the results may be rather different since the methods sometimes use a truncated elec-tronic basis set. The complex dynamics in the complete basis set provides more oscillatory results, which could be explained by the possibility of trapping some components of the wave packet in the wells of the π states leading to a slower decay. Indeed, the expected behavior is more complex than a textbook coupling between a bound state and a continuum. Nevertheless, the comparison of these different results remains interesting since they may illustrate the relative role of the different processes. Still, the results given in Table 2 confirm the already established sudden drop of the natural lifetimes of the N2+(C2∑u+, 3 ≤ v+ ≤ 15) levels because of the dominance of the predissociation processes, which will be our focus on the following parts of this manuscript.
V. Present state-to-state N2+ ion unimolecular decomposition
investigations
To complement previous work on the predissociation of N2+(C2∑u+, v+), we performed a combined experimental and first-principles treatment to fully investigate the state-to-state predissociation of the N2+(C2∑u+, v+) upon ejection of an electron from the neutral N2(X1∑g+, v” = 0). Thus, we recorded the state-to-state BRs for N2+ (C2∑u+, v+) → L1/L2/L3 using the mass-selected kinetically analyzed ions formed after N2 ionization by the VUV light delivered by the DESIRS beamline at the French SOLEIL syn-chrotron facility. Theoretically, we computed the corresponding BRs using time-independent and time-dependent approaches where the nuclear motions were treated on a newly computed set of the N2+ PECs possibly
involved in the C state predissociation and of their radial and/or spin-orbit couplings. In order to highlight the possible-specific contribution of the electronic states lying in close to the C state, we performed several compu-tations, where we examined all the possible processes, and derived their involvement in the C state predissociation. Our data together with those obtained previously are used to shed light on the specific processes under-gone by N2+(C2∑u+, v+) ions.
a. Experimental determination of the BRs
Experiments were performed at the French SOLEIL synchrotron facility, more specifically at the molecular beam endstation SAPHIRS [68] located at the VUV undulator-based beamline DESIRS [69]. Nitrogen gas was sourced from Air Liquide (N60 grade) and used without further purification to create a molecular beam by expanding half a bar of N2 through a 30 µm nozzle. The resulting supersonic beam traversed a 1 mm skimmer before crossing the synchrotron light at the center of the DELICIOUS3 double imaging photoelectron photoion coincidence spectrometer [70]. In the context of the present study of state-selected fragmentation, our imaging- based set-up offers the unique opportunity to collect 100% of the emitted electrons allowing a very efficient measurement of electron/ion coincidences.
The photon energy was set at 27.2 eV with a 1.5 meV bandwidth, while the polarization axis was chosen so that it was contained in the detection plane. The electrons and ions produced were accelerated in opposite direc-tions by a 90 V/cm electric field. The ions were analyzed and detected by a modified Wiley McLaren spectrometer to yield the three dimensional translational energy distribution with a resolution of 15%, while the elec-trons energy distribution was obtained from their velocity map image through an Abel inversion [71] with resolutions down to a few % for the fastest photoelectrons. The data is then organized through the coincidence scheme to yield kinetic energy correlation diagrams, from which dissocia-tion limits can be observed and their relative branching ratios extracted. Note that the translational energy of the parent ion has been fitted to a Boltzmann energy distribution to obtain an estimate of the molecular beam temperature, 80 ± 10 K.
The results of the state-to-state dissociative single photon ionization of N2 are given in Figure 4, which shows the intensity of the N+ collected fragments with respect to the electron and ion kinetic energy. These inten-sities are shown in this figure from the vibrational level (v+ =3) where the predissociation of the C state starts. From this image, obtained at the single photon energy of hv = 27.2 eV, the branching ratios leading to the three accessible dissociation limits can be obtained for each vibrational level.
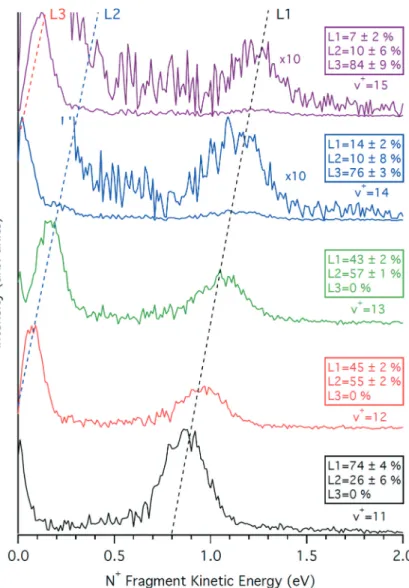
Figure 5 shows the kinetic energy distributions of the N+ fragment for the vibrational levels 11 ≤ v+ ≤ 15 obtained through vertical projections of the matrix shown in Figure 4 centered at the electron kinetic energy corre-sponding to the vibrational levels, and using a width of ± 50 meV to obtain sufficient signal-to-noise, and the branching ratios to the first three limits of dissociation, which are also reported in Table 3. Note that for 3 ≤ v+ ≤ 10 levels, the only dissociation limit energetically available is L1, so that dissociation is 100% to this limit, as shown in Figure 6, while L2 and L3 open for v+≥11 and v+≥13, respectively.
The branching ratios have been extracted by fitting three Gaussian functions to the curves shown in Figure 5, one for each dissociation limit, and agree reasonably well with those deduced earlier by Nicolas
et al. [28] using the TPEPICO technique. There are, however, some noticeable differences, especially for v+ ≥ 14, where our data show some signal in L2 and L1 (see Figure 5) – albeit with relatively high error bars due to the low signal-to-noise – whereas Nicolas et al. found 100% fragmentation to L3. Also, for v+ = 11, they reported more fragmentation to the L2, while we find 74% and 26% BRs to L1 and L2, respectively, in
Figure 4. Intensity of dissociative ionization events yielding N+ fragments recorded at a photon energy of 27.2 eV, as a function of electron kinetic energy (Ele KE) and N+ kinetic energy. Diagonal white dashed lines point the three accessible dissociation limits, while the white vertical lines represent the expected position of the N2+(C2∑u+) vibrational levels from v+ = 3 until v+ =15, according to Yoshii et al. [75].
better accordance with the present theoretical calculations that predict mainly dissociation to L1. These differences could be explained by the different experimental techniques and/or treatment methods, since our BRs are extracted from a single photon energy within a 100 meV electron binding energy bandwidth and the translational energy of the fragment ion is measured in 3D, while Nicolas et al. only had access to the 1D translational energy distribution, which accuracy might depend on the KER angular asymmetry, and performed a photon energy scan with
Figure 5. Kinetic energy release distributions of the N+ fragment generated from N2+ (C2∑u+) v+ =11 to 15, recorded at a fixed photon energy of 27.2 eV. The dashed diagonal lines show the three different dissociation limits available. For v+ =14 and v+ =15, the curves are also shown after multiplication by an order of magnitude to accentuate the weak dissociation to L2 and L1. The branching ratios to the three dissociation limits are provided for the five vibrational levels in Table 3.
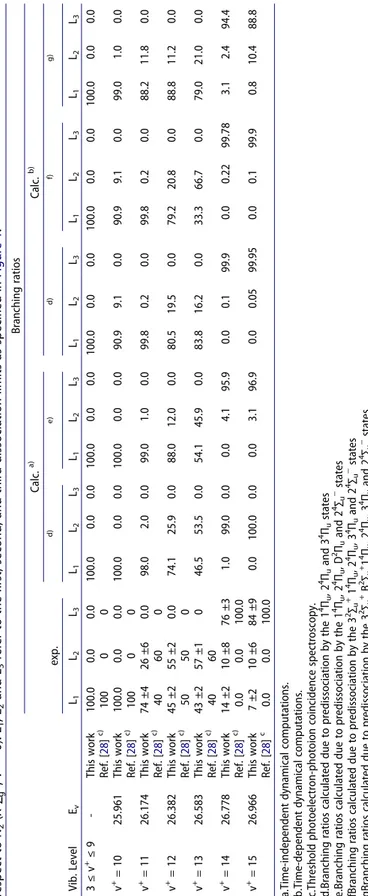
Table 3. Experimental and calculated branching ratios (in %) for the N2 + (C 2 ∑ u + , v + ) vibrational levels. The energies of the vibrational levels (Ev , in eV) are given with respect to N2 (X 1 ∑ g + , v” = 0). L1 , L 2 and L3 refer to the first, second, and third dissociation limits as specified in Figure 1 . Vib. Level Ev Branching ratios exp. Calc. a) Calc. b) d) e) d) f) g) L1 L2 L3 L1 L2 L3 L1 L2 L3 L1 L2 L3 L1 L2 L3 L1 L2 L3 3 ≤ v + ≤ 9 -This work 100.0 0.0 0.0 100.0 0.0 0.0 100.0 0.0 0.0 100.0 0.0 0.0 100.0 0.0 0.0 100.0 0.0 0.0 Ref. [ 28 ] c) 100 0 0 v + = 10 25.961 This work 100.0 0.0 0.0 100.0 0.0 0.0 100.0 0.0 0.0 90.9 9.1 0.0 90.9 9.1 0.0 99.0 1.0 0.0 Ref. [ 28 ] c) 100 0 0 v + = 11 26.174 This work 74 ±4 26 ±6 0.0 98.0 2.0 0.0 99.0 1.0 0.0 99.8 0.2 0.0 99.8 0.2 0.0 88.2 11.8 0.0 Ref. [ 28 ] c) 40 60 0 v + = 12 26.382 This work 45 ±2 55 ±2 0.0 74.1 25.9 0.0 88.0 12.0 0.0 80.5 19.5 0.0 79.2 20.8 0.0 88.8 11.2 0.0 Ref. [ 28 ] c) 50 50 0 v + = 13 26.583 This work 43 ±2 57 ±1 0 46.5 53.5 0.0 54.1 45.9 0.0 83.8 16.2 0.0 33.3 66.7 0.0 79.0 21.0 0.0 Ref. [ 28 ] c) 40 60 v + = 14 26.778 This work 14 ±2 10 ±8 76 ±3 1.0 99.0 0.0 0.0 4.1 95.9 0.0 0.1 99.9 0.0 0.22 99.78 3.1 2.4 94.4 Ref. [ 28 ] c) 0.0 0.0 100.0 v + = 15 26.966 This work 7 ±2 10 ±6 84 ±9 0.0 100.0 0.0 0.0 3.1 96.9 0.0 0.05 99.95 0.0 0.1 99.9 0.8 10.4 88.8 Ref. [ 28 ] c 0.0 0.0 100.0 a.Time-independent dynamical computations. b.Time-dependent dynamical computations. c.Threshold photoelectron-photoion coincidence spectroscopy. d.Branching ratios calculated due to predissociation by the 1 4Π u , 2 4Π u and 3 4Π u states e.Branching ratios calculated due to predissociation by the 1 4 Π u , 2 4 Π u , D 2 Π u and 2 4 ∑ u − states fBranching ratios calculated due to predissociation by the 3 2∑ u + 1 4Π u , 2 4Π u , 3 4Π u and 2 4∑ u − states gBranching ratios calculated due to predissociation by the 3 2 ∑ u + B 2 ∑ u + 1 4 Π u , 2 4 Π u , 3 4 Π u and 2 4 ∑ u − states
a better electron resolution. It is well known that TPEPICO experiments can be affected by the presence of autoionization [72]. Nevertheless, our data show that dissociation to the L1 is gradually quenched by the opening of the L2 and L3 channels, but does not completely disappear, with L2 also dramatically decreasing with the opening of L3. Note however, that due to the experimental resolution the v+ = 11 and perhaps v+ =12 branching ratios might be affected by the presence of the 2Πg progression, that could contribute up to 9% to these bands as reported by Baltzer et al. [73] Other progressions, reported only in threshold photoelectron spectra [36,74,75,76], could also contribute but since they were not seen in the high-resolution photoelectron spectrum by Baltzer et al., they are dis-missed in this work, although they are shown in Figure 6 for reference.
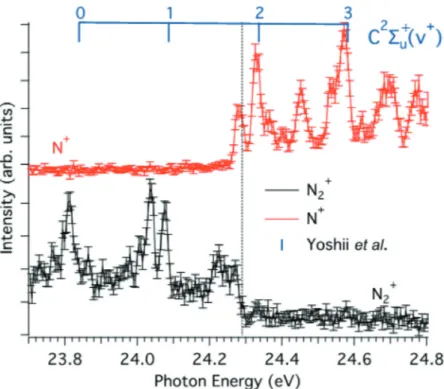
We have also recorded the TPEPICO curves of N2+ and N+ in the photon energy region between 23.6 eV and 24.8 eV, i.e., below the N2+(C2∑u+) v+ =
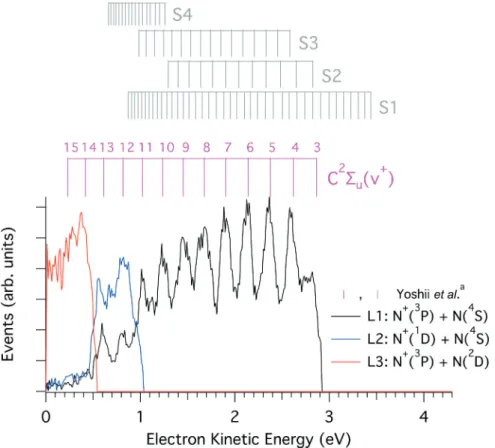
Figure 6. Number of dissociation events towards the three available limits, L1 (black), L2 (blue) and L3 (red), recorded at hv = 27.2 eV as a function of the electron kinetic energy. The relative intensity of the curves corresponds to the branching ratios to the three dissociation limits. The positions of the N2+(C2∑u+) vibrational levels from Yoshii et al. [75] are marked in magenta, as well as four different progressions in gray S1(22Πg), S2(2∑u−), S3(2Δu) and S4(2Πu) from the same reference.
5, and these are shown in Figure 7. These curves have also recently been acquired with a higher signal-to-noise over a larger energy range encom-passing vibrational levels up to v+ = 6, and discussed in great detail by Hrodmarsson et al. [36]. Therefore, they will not be further mentioned here, except to note that N2+ does not fully dissociate above v+ = 3. Hrodmarsson
et al. reported survival rates for the parent ion 14N2+ of a few % for v+ = 3, 4, while for the 15N2+ isotope the survival gradually went from 37% at v+ = 3, to 5% at v+ = 7.
b. Theoretical determinations of the BRs
The C2∑u+ → 12∑u− pathway can be ruled out since the respective spin-orbit integral is close to zero (Figure 3(d)). We considered the C2∑u+ state inter-acting, via spin-orbit, with only the 14Πu, 24Πu and 34Πu quartet states or after adding either the 24∑−u, the 12∑−u or the 22Πu states. Note that the 14Πu state correlates adiabatically to L1, the 24Πu and 24∑u− states to L2, and the 12 ∑u−, 22Πu and 34Πu states to L3. We computed the state-to-state
Figure 7. Threshold photoelectron photoion coincidence (TPEPICO) curves obtained for N+ (red) and N2+ (black) by selecting only the photoionization events that correlate with the emission of a threshold electron. The threshold selection is achieved using the slow photoelectron method outlined by Poully et al. [77] and the parameters are set to deliver a total resolution of 15 meV. The vertical-dashed line represents the first dissociation limit towards N+(3P) + N(4S). Positions of the N2+ (C2∑u+) 0 ≤ v+ ≤ 3 vibrational levels are from Yoshii et al. [75].
predissociation BRs by considering each set of electronic states and their couplings using both a time-dependent and time-independent techniques to solve the nuclear motions. Within the time dependent treatment, the evolu-tion of the C2∑u+ vibrational states is performed in the diabatic representa-tion of the B2∑u+, 32∑u+, 24∑u− and 4Πu states (Figure 2) together with the corresponding spin-orbit and their diabatic potential couplings. This allows us to observe possible vibronic predissociation mechanisms involving either the 4Πu states and/or the 2∑u+ states, in addition to the spin-orbit one.
Predissociation and time-independent dynamics of N2+(C2∑u+) ions
The predissociation branching ratios of the C2∑u+ state for the first 16 vibrational levels (0 ≤ v+ ≤ 15) were calculated using the BCONT code [65]. BCONT allows the calculation of the isoenergetic predissociation from a discrete rovibrational level (v, J) of a bound potential energy curve to the continuum of a second dissociative state whose asymptote is situated below this level (v, J). These calculations consider the potential energy curves of the two electronic states and their spin-orbit couplings to deduce the predissociation lifetimes. For instance, the data introduced in this code are the potentials of the initial state C2∑u+ and those crossing this state and which are coupled to it by spin-orbit coupling. For each vibrational level, the percentage of connection (i.e. the BRs) was calculated as follows:
%Lx ¼ PILx
ILx
where x = 1, 2 or 3 and Lx = L1, L2 or L3 are the different dissociation limits and ILx are the transition intensities assigned to each dissociation limit for each vibrational level. The data are given in Table 3.
Time-dependent wavepacket dynamics of N2+(C2∑u+) ions
Photodissociation dynamics is performed in the diabatic representation by taking as initial condition different vibrational eigenstates of the adiabatic C2 ∑u+ potential energy curve with average internuclear distance centered in the inner-well. The adiabatic-to-diabatic DðRÞtransformation matrix is block diag-onal with respect to ∑ and Π subspaces. For each symmetry, the corresponding block is obtained by solving the coupled equations @RDð�=�ÞðRÞ ¼ Fð�=�ÞðRÞDð�=�ÞðRÞ where Fð�=�ÞðRÞ is the matrix of the radial non-
adiabatic coupling elements of the first derivative @=@R in the ∑ or Π mani-fold. Then, the full adiabatic potential energy matrix VadiaðRÞ containing the
off-diagonal spin-orbit couplings between the ∑ and Π states is transformed to the diabatic representation VdiaðRÞ ¼ DTðRÞVadiaðRÞDðRÞ. The propagation is carried out by the split operator algorithm [78] extended to the non- adiabatic case [79]. The kinetic energy operator is applied in the impulsion
and diabatic representation while the potential energy operator is expressed in the position and eigen basis set of the VadiaðRÞ matrix including the spin-orbit
couplings. The computation uses a grid of 213 points from R = 2 to 15 bohr. The time step is 1 a.u. (0.0241 fs). An optical potential is added at the boundary for R > 12 bohr to avoid unphysical reflection on the grid limit. This induces a decrease of the wavepacket norm as soon as some component in a given electronic state reaches the asymptotic region. The propagation is continued until the residual norm becomes constant when only trapped components survive. The branching ratios are then estimated from the partial photodissociation cross sections that are obtained from the Fourier transform
AvmþðEÞ ¼ 1ffiffiffiffi 2π p
ð1 0
χvmþðR1;tÞeiEt=�hdt of each component χv
þ
mðR1;tÞ in electro-nic state m evolving from the initial vibrational state v+ in the asymptotic region (here R1= 10 bohr). E is here the energy above the minimum of the C2 ∑u+ state. The partial cross-section is given by
σvmþðEÞ ¼4π2αa20km μ E Av þ mðEÞ � � ��2where α ¼ q2=4πε
0hc is the fine structure con-stant, a0 is the bohr radius, μ is the reduced mass and km¼
ffiffiffiffiffiffiffiffiffiffiffiffiffiffiffiffiffiffiffiffiffiffiffi 2μðE EmÞ p
=h is the wave number in dissociative channel m with an asymptotic energy Em [80,81].
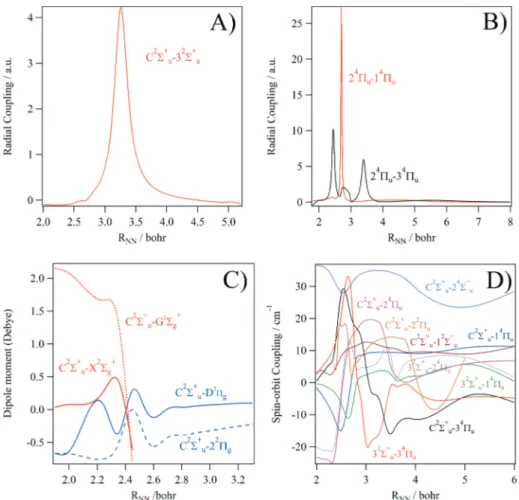
In order to illustrate that the results strongly depend on the complete-ness of the electronic basis set, we compare the cross sections correspond-ing to the Franck-Condon initial wave packet, which is a weighted coherent superposition of all the vibrational states of the C state. The initial wave packet is the ground vibrational state of the ground electronic state promoted in the adiabatic C state (assuming a constant transition dipolar moment in the Condon approximation). In Figure 8, we compare the results obtained with the full basis set including the three 2∑u+, three 4 Πu and one 4∑u− states (panels (a) and (b)) with those given in a truncated basis containing only the three 2∑u+ states (panels ((c) and (d)) or only the coupled B2∑u+- C2∑u+ as in Ref [43] (panels (e) and (f)). This minimum basis set overestimates the role of the B state as can be seen by comparing panels (f) and (d). Moreover, in the Franck-Condon case, the spin-orbit channel plays a significant role as shown in panel (b). Note that this example is a kind of average and the relative contribution in the dissocia-tion towards L1 may depend on the initial vibradissocia-tional state. These com-putations also reveal that both vibronic couplings and spin-orbit couplings are involved in the predissociation. The three 2∑u+ states are strongly interacting by the radial couplings. Models truncating the basis to the couple B2∑u+- C2∑u+ or C2∑u+ – 32∑u+ are not sufficient.
Results
The BRs are listed in Table 3. Although different BRs are obtained using these approaches, we should view them as complementary to fully under-stand the complex dynamics undertaken by the N2+ ions in the C levels. In any case, both theoretical approaches show that the C levels (i.e. 3 ≤ v+ ≤ 10), located in the energy range between L1 and L2, decay to populate L1, those between L2 and L3 (i.e. 11 ≤ v+ ≤ 13) lead to L1 and L2, whereas mainly L3 is reached through the decomposition of N2+ (C2∑u+, v+ = 14, 15) ions. The 14 Πu and 24Πu states are also crucial to explain the predissociation of the v+ ≤
Figure 8. Photodissociation cross-sections of a Franck-Condon wave packet computed in three electronic basis sets. Panels (a) and (b): three 2∑u+, three 4Πu and one 4∑u− states; panels (c) and (d): three 2∑
13 levels to form L1 and L2 species. For the N2+ (C2∑u+, v+ = 14, 15) ions a supplementary channel leading specifically to L3 opens and leads to a different evolution partly due to shape resonances. This involves the electronic states correlating to this dissociation limit such as the 32∑u+, 34 Πu, D2Πu and 24∑u− states. The influence of the 34Πu state or the D2Πu state is viewed however as negligible, and both are ruled out in the predissocia-tion of the N2+(C2∑u+) ions.
VI. The N2+(C2∑u+) state full story
While the first principle computations are well-established accurate meth-odologies, Table 3 shows that none of these methods concord fully with the measured BRs for the C state predissociation. Nevertheless, we can consider them as complementary approaches to shed light on the complex and non- trivial mechanisms undergone by the N2+(C2∑u+, v+) ions. For the v+ ≤ 10 vibrational levels, the C2∑+u state relaxes either by pre-dissociation to the first dissociation limit L1 or by fluorescence to the electronic ground state of N2+. That was proved by the present and previous experimental studies [19–30] and the branching ratios calculated in this work show that this is due to predissociation leading to L1 by vibronic interaction with the B2∑u+ and by spin-orbit coupling with 14Πu. The BR values estimated from the final population in the Π states are in a good agreement with those measured presently and the Nicolas et al. [28] ones. For v+ = 11 and 12, the predis-sociation of the C2∑+u state is distributed between the two first dissociation limits L1 and L2. Experimentally, we determined BRs of ~74% for L1 and ~26% for L2, while time-independent approach and time-dependent simula-tion without the B2∑+u state lead to ~100% for L1. For the v+ = 12 level, both theoretical percentages are distributed between the L1 and L2 limits with a predominance of L1. This is attributed mainly to the predissociation by the 14Πu and 24Πu states. The measured BRs for this vibrational level are however of ~50% for each limit. For v+ = 13, we measure 41.7% to L1, 54.7% to L2 and a small percentage (~3.6%) for the third dissociation limit L3. These values are in close agreement with those computed here by the time-independent method taking into account the spin-orbit predissociation of the C state by the 4Πu and 24∑u− states (Figure 2).
For the v+ = 14 and v+ = 15 vibrational levels, experimental measure-ments show a dissociation predominantly to the third limit with small contributions to L2 and L1, in very good agreement with our both theore-tical predictions. The computations show that the spin-orbit coupling is less efficient here and that predissociation due to vibronic coupling is instead in action. Indeed, the spin-orbit couplings were not enough to change the calculated branching ratios.
The N2+(C2∑u+) predissociative system is difficult to analyze by time- dependent methods because the profile of the potential energy curves of ∑ and Π symmetry is favorable to trapping part of the wavepackets in the bound region leading to long lifetimes. Figure 9 gives the probability of occupying each adiabatic electronic state when the system is prepared in
Figure 9. Time evolution of the wavepacket initially prepared in the v+ = 0, 4, 10, 11, 12, 13, 14 and 15 vibrational levels of the C2∑u+ state of N2+ populating the C2∑u+, B2∑u+, 32∑u+, 14Πu, 24 Πu, 34Πu and 24∑u− states. These evolutions are confirmed by longer dynamics (not shown). For v+ = 15, the populations are almost those at t = 12 ps.
different vibrational states localized in the inner well of the C2∑u+. This reveals the early dynamics. The most remarkable observation is the very fast occupation of the three C2∑u+, B2∑u+ and 32∑u+ states due to the vibronic coupling for any initial state. The three states are populated directly during the first femtoseconds with slightly different weights with respect to v+ and Rabi oscillations of weak amplitudes persist during the whole process. This non-adiabatic interaction is responsible of a part of the leakage towards L1 or L3. Spin-orbit coupling compete with this mechanism and allow the evolution towards the three L1, L2 and L3 asymptotes. The populations in the different states is not sufficient to extract the branching ratio among the dissociation channels due to the trapped components, which can decay by fluorescence only. Insight on the photodissociation is given by the time- dependent localization probability χvmþðR1;tÞ
�
� ��2
at a large internuclear dis-tance (R1= 10 bohr here) and more precisely by the integrated cross sections extracted from each component χvmþðR1;tÞ. The branching ratio (see Table 3) is obtained by summing the contribution coming from the correlated channels (B2∑u+ and 14Πu for L1, 24Πu and 24∑u− for L2, C2∑u+, 32 ∑u+ and 34Πu for L3). The decay towards the B2∑u+ by vibronic coupling confirms the contribution of this state in the predissociation via the L1 asymptote but it is not the only one since transition via the 14Πu also occurs.
The second noteworthy point is the large branching ratio towards L3 and the fast decay of the v+ = 14 and v+ =15 states. For v+ = 14, the full decay requires ~600 ps. For v+ = 15 level, the decay is even shorter and it needs ~6 ps. The difference of behavior is due to the shape of the vibrational initial states. As shown in Figure 10, the vibrational states with v+ < 14 form a progression of successive bound states in the inner well of the C state (with 2 ≤ <RNN> ≤ 4 bohr) while the v+ = 14 and v+ =15 states are shape resonances near the top of the barrier. To illustrate this, Figure 10(a) gives the initial average interatomic distances of the eigenstates of the adiabatic C state. The states of the continuum are discretized by the diagonalization in a finite basis set. We clearly see the eigenstates that correspond to the inner well of the C state (with 2 ≤ <RNN> ≤ 4 bohr) and those which correspond to the outer well (with 4 ≤ <RNN> ≤ 6 bohr). We can see also the quasi continuum eigenstates where the value of the average distance (<RNN> ≥ 8 bohr) is due to the finished grid used. Indeed, the fact that the average is large proves that these are discretized states of the continuum. Note that the parts located in the C state inner part potential are the only ones for which the Franck-Condon factors are large starting from N2(X1∑g+, v” = 0). Afterwards, the levels v+ = 14 and v+ = 15 are shape resonant states in the continuum of state C2∑u+ (Figure 9(e,f)) continuing the series of bound states in the inner-well. For the v+ = 14 level, we see that, although the wavefunction part trapped in the inner-well of the C state exhibits 14 nodes,
noticeable oscillations in the dissociation continuum, i.e., at long inter-nuclear distances, are observed (Figure 10(e)). A similar discussion applies for the v+ = 15 wavefunction (Figure 10(f)), where the area under these oscillations is even larger. These eigenvectors of the C adiabatic state are the only ones having a notable Franck-Condon factor above the L3 dissociation limit (note that Baltzer et al. [73] observe three more resonances above v+ = 15). They are characterized by their localization inside the inner well and a weak amplitude beyond the barrier. All the neighboring eigenvectors have the opposite behavior with a large amplitude outside the barrier and a very weak amplitude in the well. This strong structuration of the eigenvectors is typical of a shape resonance due to tunneling. For instance, we clearly observe a strong variation of the shape of the eigenfunctions close to the barrier, which is typical of what is currently called a shape resonance due to a barrier. It is well-known that below and above the resonance energy the eigenvectors have a large amplitude in the outer region and a very weak amplitude inside the well while it is the contrary close to the resonance. As
Figure 10. In A): Average position of the first 100 vibrational eigenstates of the C2∑u+ state with a discretization of the dissociation continuum. In the blue region, we give those located mainly in the inner potential well of the C state (i.e. v+ = 0–15). The v+ quantum number does not correspond to the eigenstate number for v+ > 10 but continues the series of eigenstates located in the inner well with an increasing number of nodes. The v+ = 0–15 levels are marked by red crosses. In the red region, those located in the outer potential well. In the yellow region, those delocalised in the continum (but artificially localized at long distance due to the finite grid). In the inset, we give an enlargement for the 20 first eigenstates where we can distinguish the v+ =0 – 12 eigenstates located in the inner potential well of the C state (red region). In B-F), we plot the vibrational wavefunctions of the N2+(C2∑u+) state for v+ = 0, 4, 13, 14 and 15, respectively. The energies of these levels with respect to the vibrationless N2 ground state are also given. See text for more details.
this is an adiabatic view, this is not sufficient to describe the dissociation. The prompt direct population of the C asymptotic region by tunneling is only one of the processes that compete with vibronic and spin-orbit transi-tion towards other electronic states. This direct tunneling component explains the faster decay of these states.
In sum, the dynamics for the upper C state vibrational levels was never fully described before by enlightening the competing role of vibronic cou-plings among the three 2∑u+ states and spin-orbit interaction with the 2Πu and 24∑u− states. It is the first time that a resonance-induced dissociation is documented for dissociative photoionization.
VII. Conclusion
In addition to previous experimental and theoretical findings dynamics, we have combined direct state-of-the-art experimental measurements and high
ab initio calculations to highlight the roles of the excited states of N2+ in the predissociation phenomena of the C2∑u+ state. The experiments consisted on the detection of the N+ + N fragments formed after single photon ionization into state-selected vibrational states of N2+ and the deduction of the state-to-state branching ratios populating the three lowest dissocia-tion limits of N2+ via the decomposition of the N2+(C2∑u+) ions. These branching ratios were also computed using both time-dependent and time- independent complementary approaches where the nuclear motions were treated in a full new set of N2+ PECs lying close to the C state. The comparison of experimental data and those derived from these computa-tions exposes the competing processes between vibronic couplings allowing dissociation towards L1 via the B2∑u+ state and the spin-orbit leading to the 4Πu states for the low levels, whereas a new mechanism was identified for the upper ones. Indeed, the v+ = 14, 15 levels are identified as resonances, whose dissociation proceeds via vibronic coupling to the 32∑u+ state and spin-orbit coupling with the D2Πu and 24∑u− states forming directly and dominantly L3 products in good agreement with the experiments.
Although we treated the dissociative single photon ionization of a small (diatomic) molecule, the processes described here are complex. Our work showed that neither the time dependent nor the time independent theoretical approaches can give a complete vision on these complex dynamics undertaken after ionizing N2. In sum, we showed that one needs an interplay between diverse computational and experimental investigations to disentangle the com-plex dynamics of the predissociation of the N2+(C2∑u+), which was pointed out more than 60 years ago. This should help in the correct modeling of these important phenomena in atmospheric, planetary and plasma media. Similar complex situations can be found for other important molecular systems. For instance, the present findings may help to fully understand the isotopic effects
observed recently in the ultrafast dynamics of dissociative photoionization of N2 and the unexpected branching ratios measured recently during the dissociation dynamics of N2+ induced by isolated attosecond XUV pulses in combination with few-optical-cycle near-infrared/visible (NIR/VIS) [30]. Similar approaches can be applied also to explain the isotopic effects in the VUV photodissociation of the N2 and CO molecules [16,82] and that of larger molecular systems relevant for astrophysical, planetary, and atmospheric media and having envir-onmental impacts such as HNCO [83].
Acknowledgments
We are indebted to the general technical staff of Synchrotron Soleil for running the facility. We would like also to thank Jean-François Gil for his technical help on the SAPHIRS molecular beam chamber, and Barbara Cunha de Miranda for her invaluable help in performing the experiments.
Disclosure statement
No potential conflict of interest was reported by the authors.
ORCID
M. Desouter-Lecomte http://orcid.org/0000-0002-6199-7401 G. A. Garcia http://orcid.org/0000-0003-2915-2553
L. Nahon http://orcid.org/0000-0001-9898-5693
References
[1] Feldman PD, Sahnow DJ, Kruk JW, et al. High-resolution FUV spectroscopy of the terrestrial day airglow with the far ultraviolet spectroscopic explorer. J Geophys Res Space Phys. 2001;106:8119.
[2] Owen TC. On the origin of titan’s atmosphere. Planet Space Sci. 2000;48:747. [3] Strobel DF, Shemansky DE. EUV emission from titans upper atmosphere voyager I
encounter. J Geophys Res Space Phys. 1982;87:1361.
[4] Dutuit O, Carrasco N, Thissen R, et al. Critical review of N, N+, N2+, N++, and N2++ main production processes and reactions of relevance to titan’s atmosphere. Astrophys J Suppl S. 2013;204:20.
[5] Torr DG, Torr MR. Chemistry of the thermosphere and ionosphere. J Atmos Sol-Terr Phy. 1979;41:797.
[6] Torr MR, Torr DG. The role of metastable species in the thermosphere. Rev Geo Phys Space Phys. 1982;20:91.
[7] Teanby NA, Irwin PGJ, de Kok R, et al. Latitudinal variations of HCN, HC3N and C2 N2 in titan’s stratosphere derived from cassini CIRS data. Icarus. 2006;181:243. [8] Krasnopolsky VA. A photochemical model of titans atmosphere and ionosphere.