Full Terms & Conditions of access and use can be found at
https://www.tandfonline.com/action/journalInformation?journalCode=wafp20
Journal of Aquatic Food Product Technology
ISSN: (Print) (Online) Journal homepage: https://www.tandfonline.com/loi/wafp20
Sensory Profiling of Meat and Fish Products
Obtained by Traditional Grilling, Smoking and
Smoking-drying Processes
Mahunan François Assogba, Eudes Landry Anihouvi, Laurent Adinsi,
Ben-Sadek Boukary, Yenoukounmè Euloge Kpoclou, Jacques Mahillon,
Marie-Louise Scippo, Djidjoho Joseph Hounhouigan & Victor Bienvenu Anihouvi
To cite this article: Mahunan François Assogba, Eudes Landry Anihouvi, Laurent Adinsi,
Ben-Sadek Boukary, Yenoukounmè Euloge Kpoclou, Jacques Mahillon, Marie-Louise Scippo, Djidjoho Joseph Hounhouigan & Victor Bienvenu Anihouvi (2021): Sensory Profiling of Meat and Fish Products Obtained by Traditional Grilling, Smoking and Smoking-drying Processes, Journal of Aquatic Food Product Technology, DOI: 10.1080/10498850.2021.1888833
To link to this article: https://doi.org/10.1080/10498850.2021.1888833
Published online: 23 Feb 2021.
Submit your article to this journal
View related articles
Sensory Profiling of Meat and Fish Products Obtained by
Traditional Grilling, Smoking and Smoking-drying Processes
Mahunan François Assogba a, Eudes Landry Anihouvia, Laurent Adinsia, Ben-Sadek Boukarya, Yenoukounmè Euloge Kpocloua, Jacques Mahillonb, Marie-Louise Scippoc,
Djidjoho Joseph Hounhouigana, and Victor Bienvenu Anihouvia
aLaboratory of Food Science, School of Nutrition, Food Science and Technology, Faculty of Agronomic Sciences,
University of Abomey-Calavi, Jéricho Cotonou, Benin; bLaboratory of Food and Environmental Microbiology, Earth and
Life Institute-Applied Microbiology, Louvain-la-Neuve, Belgium; cDepartment of Food Science, Laboratory of Food
Analysis, Faculty of Veterinary Medicine, Fundamental and Applied Research for Animals & Health (FARAH), Veterinary Public Health (VPH), University of Liege, Liège, Belgium
ABSTRACT
In interest of improving the traditional processing of meat and fish products, this study aimed to evaluate the sensory profile of traditionally processed grilled pork (GP), smoked fish (SF), and smoked-dried fish (SDF). The study was per-formed with 411 consumers using Check-All-That-Apply methodology and nine- point hedonic scale test. The results showed that all the samples of GP, SF, and SDF were preferred, with acceptability scores ranging between 6.9 ± 1.8–7.4 ± 1.7, 7.2 ± 1.7–7.5 ± 1.5, and 7.3 ± 1.5–7.6 ± 1.5, respectively. The consumers of GP and SF samples were classified into three clusters, while those of SDF were grouped in four clusters whose preference varied significantly. The four samples of GP were characterized by different sensory attributes. The difference between SF and SDF was related to hard texture for SDF and tender and wet texture for SF. Consumer’s perception provided reliable information on the liking drivers of grilled pork, smoked, and smoked-dried fishes. This information could help to know how to maintain consumers’ liking profile of products during the devel-opment of smoking and grilling equipment.
KEYWORDS
Sensory characterization; Check-All-That-Apply method; acceptability; smoked fish products; grilled pork
Introduction
Meat and fish products play an important role in food consumption for a significant fringe of the worldwide population, particularly in Benin. Fresh meat and fish are processed in different ways such as boiling, frying, salting, smoking, and grilling (Egbunike and Okubanjo 1999; Poligné et al. 2001). In West Africa, grilling and smoking are the main processing methods, with different cooking techniques resulting in end-products with variable quality attributes and safety (Kpoclou et al. 2013). Grilled pork (GP), smoked fish (SF), and smoked-dried fish (SDF) are highly appreciated and consumed in many countries due to their organoleptic characteristics (Fuller 2004). Recent studies carried out by Kpoclou et al. (2014), Iko Afé (2017) and Iko Afé et al. (2020) showed that smoked shrimp, grilled pork, smoked fish, and smoked-dried fish were highly contaminated by polycyclic aromatic hydrocarbon (PAH), which is known to be carcinogenic (Mrozik et al.
2003; SCF 2002; Stolyhwo and Sikorski 2005). Thus, there is a need to improve grilling and smoking processes by developing improved processing methods. However, quality improvement must be driven by the consumer expectations and perceptions. Before taking into account other quality dimensions, the sensory properties of products need to be entirely satisfied for consumers (Chambers and Bowers 1993; Issanchou 1996; Touraille 1992). Therefore, it is important to assess the sensory characteristics and consumer expectations for the traditional grilled and smoked products. Innovative techniques in the field
CONTACT Mahunan François Assogba fassogba@gmail.com Laboratory of Food Science, School of Nutrition, Food Science and Technology, Faculty of Agronomic Sciences, University of Abomey-Calavi, Jéricho Cotonou 03 BP 2918, Benin.
https://doi.org/10.1080/10498850.2021.1888833
of sensory perception have developed in a direct link with consumers. Among them, the use of Check-All- That-Apply (CATA) methodology is valuable because it can be applied with a wide range of consumers without prior experience of sensory evaluation (Jorge et al. 2015). It has been successfully applied to characterize a variety of foods and other products such as strawberry cultivars (Lado et al. 2010), vanilla ice cream (Dooley et al. 2010), fiber-enriched apple puree milk deserts (Ares et al. 2010a, 2010b; Laureati et al. 2017), orange juices (Lee et al. 2013), probiotic yogurt (Cruz et al. 2013), and meat products such as cooked ham and dry fermented sausages (Dos Santos et al. 2015; Henrique et al. 2015; Jorge et al. 2015).
The objective of this study was to establish the sensory profile and liking drivers for grilled pork, smoked fish, and smoked-dried fish using CATA methodology.
Materials and methods
Study 1: sensory profiling of grilled pork Grilled pork samples
Pork (carcass) was obtained from local breed pig, purchased from a private farm in Cotonou. Grilled pork samples were produced using the traditional processing method described by Assogba et al. (2020). After removing the hair of slaughtered pork by skin grilling, the pork carcass was washed and gutted before being cut into quarters. Thereafter, it was deboned, and the fat was removed before cutting it into slices that were seasoned in a basin using 0.06 kg of spices (mixture of salt, garlic, pepper, onion, ginger, laurel leaves, and magic cub) for 1 kg of fresh pork. Then, the fresh seasoned slices were grilled for 45 min using a barrel grill as equipment and charcoal as fuel. The temperature in the core of the product was 66°C during the processing. The end-product in this case was coded as slice of grilled pork (SGP). To obtain grilled wrapped pork (GWP), the slices of grilled pork were re- seasoned and wrapped in cement paper before being heated again on the grill. Furthermore, fresh pork without the deboning step was cut into pieces that were seasoned before grilling to obtain the pieces of grilled pork (PGP). Fresh pork after deboning could be cut and seasoned and skewered before grilling; this end-product was coded as skewer of grilled pork (SKGP). The four different samples of grilled pork (SGP, GWP, PGP, SKGP) described above were then evaluated by the consumers.
Panelists
The panelists (n = 105), who commonly consumed grilled pork at least weekly, were recruited from grilled pork restaurants to participate in this study. Panelists were 18–72 years old, 72.4% were male, and were of varied income levels and education levels. The socio-demographic characteristics of the panelists were recorded. Participants gave written informed consent before admission in the panel.
Experimental design and data collection
Approximately 150 g of each sample was served using plastic cups coded with a three-digit random number. All participants were asked to rinse their mouth with water to avoid confusion during their appreciation. Consumers scored their overall liking using a 9-point hedonic scale (Meilgaard et al.
2007) from 1 “dislike extremely” to 9 “like extremely”, and used a Check-All-That-Apply question (Adams et al. 2007) to describe the sample. The CATA questions included the sensory attributes related to taste (salty, grilled, spiced taste), golden color, smoke odor, texture (tender, juicy, and dry), absence of bone, absence of fat, presence of fat, and presence of offal.
Study 2: sensory profiling of smoked fish and smoked-dried fish Fish samples
Five species of fish mainly consumed in smoked form (S. scombrus; M. polli; O. niloticus) and smoked-dried form (C. cyanopterus and E. fimbriata) were processed by the same processor in Cotonou municipality using the traditional method described by Assogba et al. (2019). These species of fish were recognized to be
suitable for these processes. The smoking process was carried out in three main steps. The fresh fish was washed, spread on metal tray before being smoked for 95 min using barrel kiln and wood as fuel. The temperature in the core of the product was 62.8°C during the processing. The smoking-drying process of
C. cyanopterus was achieved following five steps. The fresh fish was dressed (scaled and washed), bent and
spread on the metal tray, and smoked before being dried. E. fimbriata was also processed following the same method, but this species of fish was not subjected to scaling and bending steps. The smoking-drying process was performed for 215 min using the barrel kiln as equipment and wood as fuel. The temperature in the core of the product was 60°C during the processing.
Panelists
The smoked fishes were evaluated by 155 participants (18–70 years old, 87.1% female), and smoked- dried fishes were evaluated by 151 participants (18–65 years old, 86.1% female). Panelists were recruited in the house and in the restaurant based on their consumption of fish products, as well as their interest and availability to participate in this study.
Experimental design and data collection
The participants received a single CATA question featuring 15 and 16 sensory attributes of smoked and smoked-dried fishes, respectively. The sensory attributes were selected according to Assogba et al. (2019). They were related to color (golden, shiny, not shiny, and black), taste (smoked shrimp, salty, and bitter taste), odor (smoke, high smoke, rancid, and ammoniacal), texture (dry, crumbly, firm, wet, tender, elastic, and hard), and other descriptors such as absence or presence of blood trace. The sensory evaluation of smoked and smoked-dried fishes was performed using the same methods as described above in the experimental design and data collection section of Study 1.
Data analysis
Analysis of variance (one-way ANOVA) was used to compare the overall acceptability score. In order to identify groups of consumers with similar preference patterns, a hierarchical cluster analysis (Ares et al.
2010a; Moussaoui and Varela 2010) was performed on overall liking data. Regarding each category of product, principal component analysis (PCA) was performed to show the relationship of socio- demographic characteristics of consumers for each liking segment. For the CATA method, frequency of mention for each sensory attribute (CATA question) was determined by counting of the number of consumers that used each word to describe each product. Cochran’s Q test was carried out on frequencies of each sensory attribute to know if each CATA question was able to significantly discriminate the product (Manoukian 1986; Parente et al. 2011). Principal component analysis was performed to show linkage between products and sensory attributes. A multiple factor analysis (MFA) was performed to investigate the relationship between responses to the CATA question and consumer groups identified (Ares et al. 2010a; Bécue-Bertaut et al. 2008; Bécue-Bertaut and Pagès 2008). All statistical analyses were performed for each product (grilled pork, smoked, and smoked-dried fishes) using XLSTAT software for Windows version 2012.5 (Adinsoft, Paris, France).
Results and discussion
Overall acceptability of pork and fish products
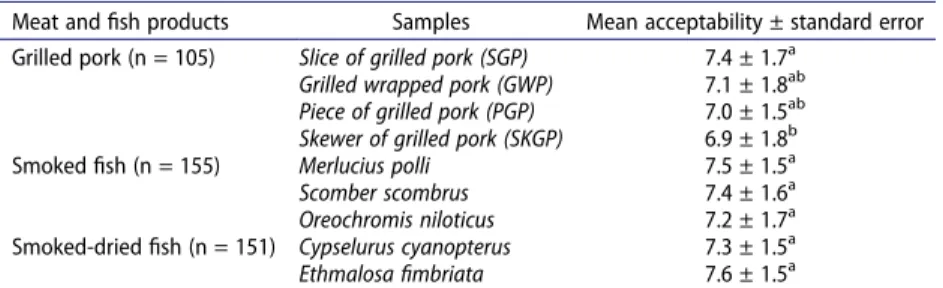
The grilled pork, smoked fish, and smoked-dried fish obtained a score higher than six (6) on a scale of 9, showing good acceptability (Table 1). Although the grilled pork samples were scored higher than 6, slice of grilled pork (SGP) was significantly (P < .05) preferred (score of 7.4) over skewer of grilled pork (SKGP) (6.9), which was the least preferred. Regarding fish, all products were scored higher than seven (7), and the mean acceptability score did not change significantly (P > .05) from one fish species to another for smoked fish and smoked-dried fish. Hierarchical cluster analysis (Ward’s method) showed that consumers of grilled
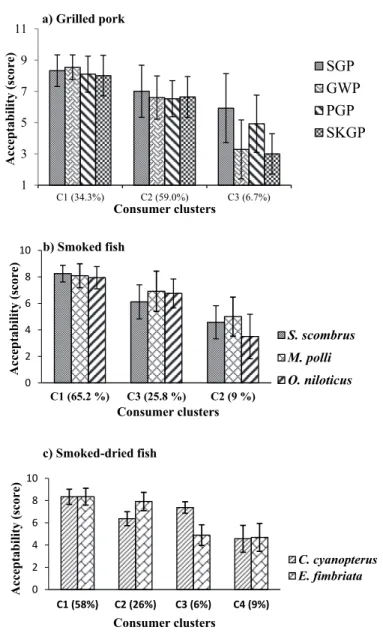
pork and smoked fish were categorized into three clusters. As shown in Figure 1a, the clusters C1 and C2 gathered together more than 90% of consumers of grilled pork who liked all four samples of grilled pork, even though the cluster C1 gave the highest acceptability scores for both products. These two clusters of grilled pork consumers did not grant an importance to presentation forms of grilled pork. The lowest group (less than 10% of consumers) regarding pork products is represented by cluster 3 of consumers who disliked (mean score less than 5) skewer of grilled pork (SKGP) and grilled-wrapped pork (GWP). Regarding socio- demographic characteristics of clusters of consumers, the three clusters (C1, C2, and C3) of grilled pork consumers are distinguished by the fact that consumers in C1 are primarily male, single, and Christian, while consumers in C3 are mainly characterized by high educational level (university level) (Figure 2). The difference observed in their acceptability score could be explained by their difference in socio-demographic characteristics. The age criteria was not taken into account in this analysis, because it did not discriminate the three clusters of grilled pork consumers. Likewise, the clusters C1 and C3 of smoked fish consumers also gathered together more than 90% of consumers who liked all the three smoked fish, even though the cluster C1 gave the highest acceptability scores (Figure 1b). The smoked products of S. scomber and O. niloticus were disliked by smoked fish consumers of cluster C2. These results showed that the majority of consumers liked smoked fish regardless the fish species. As shown in Figure 3, the smoked fish consumers in cluster 1 are Christian; the consumers in cluster 2 practiced traditional religion, while those in cluster 3 are female, married, and illiterate. This difference in socio-demographic characteristics could explain their difference in acceptability score attributed to different species of smoked fish. Different consumer preference patterns were observed for the smoked-dried fish (Figure 1c). Indeed, the largest cluster 1 of smoked-dried fish consumers (58%, n = 88) gave an acceptability score higher than eight (8) for smoked-dried C. cyanopterus and E. fimbriata. For both smoked-dried fishes, the overall acceptability score of consumers of cluster 2 (26%, n = 40) is lower when compared to those of cluster 1, but it was higher than the reference acceptability score of five (5) (neither like, nor dislike). The smoked-dried fish consumers of cluster 2 liked more smoked- dried fish of E. fimbriata than that of C. cyanopterus, whereas the lowest cluster (C3) of smoked-dried fish consumers (6%, n = 9) preferred the smoked-dried fish of C. cyanopterus more than that of E. fimbriata. As regards consumers of cluster 4 (9%, n = 14), the two smoked-dried fish were not well-appreciated, with acceptability scores less than five (5). These differences observed in the preference of smoked-dried fish species by the four consumer clusters could be explained by their difference related to the socio- demographic characteristics. Indeed, as illustrated in Figure 4, the smoked-dried fish consumers in cluster 1 are married; consumers in cluster 2 are young (age <30 years); consumers in cluster 3 are illiterate; and consumers in cluster 4 are single. It could be assumed that these four clusters of smoked-dried consumers did not perceive the preference of smoked-dried fish in the same way.
Sensory profile
Sensory profile of grilled pork
The first six attributes used to describe grilled pork samples were spiced taste, tender texture, absence of bone, juicy texture, grilled taste, and salty taste (Table 2). Among them, spiced taste, tender texture,
Table 1. Overall acceptability scores for grilled pork, smoked fish, and smoked-dried fish. Meat and fish products Samples Mean acceptability ± standard error Grilled pork (n = 105) Slice of grilled pork (SGP) 7.4 ± 1.7a
Grilled wrapped pork (GWP) 7.1 ± 1.8ab
Piece of grilled pork (PGP) 7.0 ± 1.5ab
Skewer of grilled pork (SKGP) 6.9 ± 1.8b Smoked fish (n = 155) Merlucius polli 7.5 ± 1.5a
Scomber scombrus 7.4 ± 1.6a
Oreochromis niloticus 7.2 ± 1.7a
Smoked-dried fish (n = 151) Cypselurus cyanopterus 7.3 ± 1.5a
Ethmalosa fimbriata 7.6 ± 1.5a
and juicy texture did not discriminate significantly (p > .05) the grilled pork samples. This could be due to the fact that the four samples of grilled pork were produced from the same carcass and were seasoned with the same ingredient. Furthermore, tender and juicy characteristics can have bipolar meanings. Indeed, Bryhnia et al. (2003), Moeller et al. (2010), and Becker et al. (2016) reported that these two attributes were the main sensory properties of cooked pork. Nevertheless, Verbeke et al. (1999) pointed out that although tender texture had an importance and potential impact on overall meat products’ acceptability, it was not properly used by consumers during sensory appreciation of grilled pork. This difference from one study to another confirms the complexity of this sensory descriptor regarding the overall acceptability. The four grilled pork samples were discriminated by the sensory attributes related to taste (salty and grilled taste), texture (dry texture), color (golden color), odor (smoke odor), and other sensory descriptors such as absence of bone, presence of offal,
1 3 5 7 9 11 C1 (34.3%) C2 (59.0%) C3 (6.7%) A c c e p t a b il it y ( s c o r e ) Consumer clusters a) Grilled pork SGP GWP PGP SKGP 0 2 4 6 8 10 C1 (65.2 %) C3 (25.8 %) C2 (9 %) A c c e p t a b il it y ( s c o r e ) Consumer clusters b) Smoked fish S. scombrus M. polli O. niloticus 0 2 4 6 8 10 C1 (58%) C2 (26%) C3 (6%) C4 (9%) A c c e p t a b il it y ( s c o r e ) Consumer clusters c) Smoked-dried fish C. cyanopterus E. fimbriata
Figure 1. Mean acceptability scores of grilled pork (a), smoked fish (b) and smoked-dried fish (c) by consumer clusters. Acceptability
was rated on a 9-point scale from 1 = disklike extremely, to 9 = like extremely. SGP- Slice of grilled pork; GWP- Grilled-wrapped pork; PGP- pieces of grilled pork; SKGP- skewer of grilled pork; C1, C2, C3, C4, consumer clusters.
and presence/absence of fat. This result confirmed that texture, color, taste, and odor were important among the sensory attributes of test samples, as revealed by 72.3, 46.8, 39.9 and 18.6% of grilled pork processors, respectively (Iko Afé 2017).
Principal component analysis carried out on sensory descriptors (Figure 5) showed that grilled- wrapped pork, located in the left-hand quadrant, was characterized by presence of offal, while slices of grilled pork were more associated with absence of fat, golden color, and dry texture. Pieces of grilled
Male Female Single
Married
Widow
Other matrimonial status Primary level Secondary level University level Traditional religion Christian Other religions C1 C2 C3 -1 -0.75 -0.5 -0.25 0 0.25 0.5 0.75 1 -4 -3 -2 -1 0 1 2 3 4 5 6 F 2 ( 8 .6 8 % ) F1 (90.19 %)
Biplot (axis F1 and F2 : 98.87 %)
Figure 2. Relationship of socio demographic characteristics of grilled pork consumers for each liking segment.
Male Female Illiterate Primary level Secondary level University level Single Married Divorcee Widow Traditional religion Christian Islam Others religions C1 C2 C3 -0.5 -0.25 0 0.25 0.5 -3.2 -2.4 -1.6 -0.8 0 0.8 1.6 2.4 3.2 4 4.8 5.6 6.4 F 2 ( 3 .2 9 % ) F1 (95.17 %)
Biplot (axis F1 and F2 : 98.46 %)
pork were correlated to tender texture, grilled taste, salty taste, spiced taste, and smoke odor. The skewer of grilled pork was characterized by the presence of fat compared to the other grilled pork samples, mainly SGP, which was more associated with absence of fat.
Considering that the three clusters of grilled pork consumers showed different preference patterns, they could also use the terms of CATA questions differently. Therefore, multiple factorial analysis carried out considering CATA counts for the three clusters of grilled pork consumers (Figure 6) showed that the first dimension (F1) was positively correlated with the sensory attributes of dry texture, absence of fat, and golden color and was negatively correlated with presence of offal. On the other hand, the second dimension F2 was positively correlated with juicy texture for the three clusters of grilled pork consumers and negatively with presence of fat and absence of bone for the three clusters of grilled pork consumers. It could be assumed that these sensory attributes, which present significant
< 30 years 30-40 years 41-50 years > 50 ans Primary level Secondary level University level Illiterate Single Married Divorcee C1 C2 C3 C4 -3 -2 -1 0 1 2 3 4 -3 -2 -1 0 1 2 3 4 5 F 2 ( 3 3 .8 6 % ) F1 (61.62 %)
Biplot (axis F1 and F2 : 95.48 %)
Figure 4. Relationship of socio demographic characteristics of smoked-dried fish consumers for each liking segment.
Table 2. Frequency of responses to CATA questions related to grilled pork samples and result from Cochran Q test (n = 105 consumers).
Grilled pork samples
Sensory descriptors SGP GWP PGP SKGP Total Cochran Q test (P-value) Spiced tastens 121 138 114 117 490 0.528 Tenderns 68 63 70 63 264 0.657 Absence of bone*** 80 55 39 74 248 < 0.0001 Juicyns 57 62 65 51 235 0.065 Grilled taste** 61 45 65 57 228 0.004 Salty taste* 51 45 56 57 209 0.050 Absence of fat*** 62 35 42 35 174 < 0.0001 Golden color*** 49 35 37 39 160 < 0.0001 Presence of fat*** 10 25 17 45 97 < 0.0001 Presence of offal** 21 31 19 19 90 0.002 Dry texture*** 36 11 24 14 85 < 0.0001 Smoke odor*** 14 10 28 23 75 0.001 Total 630 555 576 594
Asterisks indicate significant difference at *** P ≤ 0.001; ** P ≤ 0.01; * p ≤ 0.05; ns indicates no significant difference (p > .05); SGP, slice of grilled pork; GWP, grilled-wrapped pork; PGP, piece of grilled pork; SKGP, skewer of grilled pork.
correlation between the three clusters of grilled pork consumers, were used similarly by people in the three clusters, despite their different preference patterns of the four tested samples of grilled pork. Other sensory attributes such as smoke odor, spiced taste, tender, salty taste, and grilled taste did not show good correlation for the three clusters of grilled pork consumers. This suggests that they were used differently by the three clusters of grilled pork consumers, as there were differences in consumers’ perception of these sensory descriptors. It is then advisable to notice that these sensory attributes were not significantly used in the appreciation of grilled pork quality.
SGP GWP PGP SKGP Salty taste Tender texture Dry texture Absence of bone Presence of fat
Juicy texture Grilled taste
Spiced taste Golden colour Absence of fat Smoke odour Presence of offal -1.5 -1 -0.5 0 0.5 1 1.5 2 -2.5 -2 -1.5 -1 -0.5 0 0.5 1 1.5 2 2.5 F 2 ( 3 1 .5 8 % ) F1 (46.79 %)
Biplot (axis F1 and F2 : 78.37 %)
Figure 5. Sensory mapping of grilled pork. SGP- Slice of grilled pork; GWP- Grilled-wrapped pork; PGP- piece of grilled pork; SKGP-
skewer of grilled pork.
Salty taste Tender texture Dry texture Absence of bone Presence of fat Juicy texture Grilled taste Spiced taste Golden color Absence of fat Smoke odour Presence of offal Salty taste Tender texture Dry texture Absence of bone Presence of fat Juicy texture Grilled taste Spiced taste Golden color Absence of fat Smoke odor Presence of offal Salty taste Tender texture Dry texture Absence of bone Presence of fat Juicy texture Grilled taste Spiced taste Golden color Absence of fat Smoke odor Presence of offal -1 -0.75 -0.5 -0.25 0 0.25 0.5 0.75 1 -1 -0.75 -0.5 -0.25 0 0.25 0.5 0.75 1 F 2 ( 2 9 .7 6 % ) F1 (43.18 %)
Variables (axis F1 and F2 : 72.93 %)
Cluster 1 Cluster 2 Cluster 3
Sensory profile of smoked fish
The descriptors most used to characterize smoked fish samples were golden color, shiny color, smoke odor, wet texture, firm texture, taste of smoked shrimp, and presence of blood trace (Table 3). Regarding the sensory descriptors, the samples were similarly described. Indeed, the descriptors smoke odor, rancid odor, ammoniacal odor, taste of smoked shrimp, salty taste, presence of blood trace, and absence of blood trace did not differ significantly (P > .05) from one smoked fish sample to another. These sensory descriptors did not enable discrimination of the three smoked fish species. The descriptors related to taste (bitter), color (black, golden, shiny, and not shiny), and texture (wet, firm, and tender) strongly discriminated (P < .0001) the smoked fish samples. These descriptors were used by consumers to assess the sensory quality of smoked fish in Iceland and Senegal (Cardinal et al. 2001; Rivier et al. 2010). The difference in the way that these descriptors were used could be due to the difference in fish species with different physicochemical characteristics, notably protein and fat content, as reported by Iko Afé (2017).
As shown by the principal component analysis in Figure 7, smoked O. niloticus fish, mainly preferred by consumers of cluster 3, was strongly correlated with the axis F1 and was described by golden color and shiny color. Smoked S. scombrus fish, which negatively correlated with the axis F2, was characterized by black color, tender, and wet texture and was mainly preferred by consumers of cluster 1. As regards smoked M. polli fish, it was preferred by consumers of clusters 2 and 3 and was characterized by not shiny color. From these results, it could be assumed that the sensory attributes related to color and texture are the most used for smoked fish characterization.
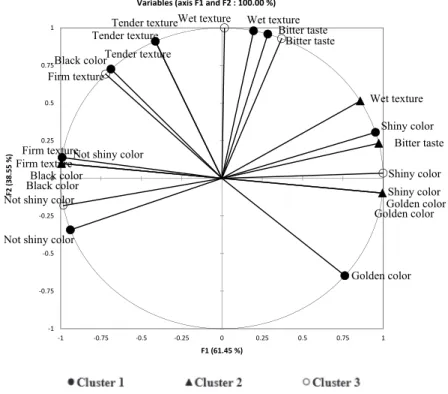
MFA carried out on CATA counts showed the way the three consumer clusters used sensory attributes to appreciate smoked fish. As shown in Figure 8, the three consumer clusters of smoked fish were correlated according to certain sensory attributes. Indeed, the three consumer clusters were positively correlated with the first dimension F1 for shiny color and golden color and negatively contrasted with not shiny color, black color, and firm texture. On the other hand, the three consumer clusters were positively correlated with the second dimension F2 for tender texture. From this report, it appeared that the three consumer clusters of smoked fish similarly used several sensory attributes despite their difference in acceptability scores attributed to different fish species. However, the sensory attributes such of wet texture and bitter taste for both consumer clusters 1 and 3 were positively correlated to dimension F2, while the same sensory attributes of cluster 2 were positively correlated to dimension F1. The cluster 2 could be distinguished from the two other clusters for wet texture and bitter taste sensory attributes.
Table 3. Frequency of responses to CATA questions recorded for smoked fish samples and result from Cochran Q test (n = 155 consumers).
Frequency of consumers per smoked fish
Sensory descriptors S. scombrus M. polli O. niloticus Total
Cochran Q test (p-value) Smoke odorns 152 147 148 447 0.291
Golden color* 144 148 153 445 0.034 Absence of blood tracens 147 144 144 435 0.676
Taste of smoked shrimpns 135 137 132 404 0.542
Shiny color*** 118 107 143 368 < 0.0001 Firm texture*** 119 113 85 317 < 0.0001 Wet texture*** 103 57 85 245 < 0.0001 Tender texture** 92 70 70 232 0.010 Not shiny color*** 33 45 12 90 < 0.0001
Salty tastens 26 28 28 82 0.834
Bitter taste* 9 1 9 19 0.023
Black color* 10 6 2 18 0.049
Presence of blood tracens 4 7 6 17 0.646
Amoniacal odorns 1 3 5 9 0.264
Rancid odorns 2 1 1 4 0.779
Total 1095 1014 1023
Asterisks indicate significant difference at *** P ≤ 0.001; ** P ≤ 0.01; * p ≤ 0.05; ns indicates no significant
S. scombrus M. polli O. niloticus Golden color Black color Shiny color Not shiny color
Wet texture Tender texture Firm texture Bitter taste Cluster 1 Cluster 2 Cluster 3 -8 -6 -4 -2 0 2 4 6 8 -10 -8 -6 -4 -2 0 2 4 6 8 10 12 F 2 ( 4 2 .4 6 % ) F1 (57.54 %)
Biplot (axis F1 and F2 : 100.00 %)
Figure 7. Principal component analysis (PCA) showing correlation between consumers, sensory descriptors and smoked fish samples from different fish species.
Golden color Black color
Shiny color
Not shiny color
Wet texture Tender texture Firm texture Bitter taste Golden color Black color Shiny color Not shiny color
Wet texture Tender texture Firm texture Bitter taste Golden color Black color Shiny color
Not shiny color
Wet texture Tender texture Firm texture Bitter taste -1 -0.75 -0.5 -0.25 0 0.25 0.5 0.75 1 -1 -0.75 -0.5 -0.25 0 0.25 0.5 0.75 1 F 2 ( 3 8 .5 5 % ) F1 (61.45 %)
Variables (axis F1 and F2 : 100.00 %)
Sensory profile of smoked-dried fish
Few differences of perceptions were observed between the two fish species submitted to smoking- drying process. Indeed, only some descriptors related to color (shiny and not shiny) and texture (firm, crumbly, hard, and elastic) significantly (P < .05) discriminated smoked-dried C. cyanopterus and smoked-dried E. fimbriata (Table 4). Except fpr hard and elastic texture, all sensory quality attributes that significantly discriminated smoked fish species also discriminated smoked-dried fish species.
Smoked-dried C. cyanopterus fish positively correlated with F1 (Figure 9) was mainly characterized by hard texture and firm texture, while smoked-dried E. fimbriata fish was determined by shiny color and crumbly texture. Elastic texture negatively correlated with F1, indicating that smoked-dried C. cyanopterus fish could present neither hard nor elastic texture at the same time, nor firm and elastic texture at the same time.
Difference of sensory profile between smoked fish and smoked-dried fish
The sensory profile of smoked fish as perceived by consumers differed from that of smoked-dried fish. As presented above, smoked fish samples were characterized by golden and shiny colour for smoked
O. niloticus, tender and wet texture and bitter taste for smoked S. scombrus, and not shiny colour for
smoked M. polli. The smoked-dried fish samples were described by hard texture for C. cyanopterus and crumbly texture and shiny color for E. fimbriata. The sensory profile difference between these two types of fish (smoked fish and smoked-dried fish) could be explained by the difference related to their species, processing methods (smoking and drying processes), and physico-chemical properties (Iko Afé 2017). The fact that the consumers of smoked fish samples are grouped in three clusters, while those of smoked-dried fish samples were categorized in four clusters, with significant differences in preference, could also justify the difference in sensory profile between smoked fish and smoked-dried fish.
Conclusion
The sensory study gathered information that contributes to a better understanding of the difference in consumer perception of four grilled pork samples, three smoked fish samples, and two smoked-dried fish samples. In general, grilled pork samples received good overall acceptability scores from all consumers. This
Table 4. Frequency of responses to CATA questions recorded for smoked-dried fish samples and result from Cochran Q test (n = 151 consumers).
Frequency of consumers per smoked-dried fish
Sensory descriptors C. cyanopterus E. fimbriata Total Cochran Q test (P-value) Dry texturens 145 146 291 0.705
Golden color 132 151 283 ND
Smoke odorns 138 134 272 0.317
Taste of smoked shrimpns 130 131 261 0.782
Shiny color*** 112 137 249 0.000 Hard texture*** 132 67 199 <0.0001 Firm texture*** 90 45 135 <0.0001 Crumbly texture*** 20 78 98 <0.0001
Spice tastens 31 29 60 0.480
Not shiny color*** 37 14 51 0.000 High smoke odorns 11 14 25 0.405
Black color 17 0 17 ND Elastic texture* 12 2 14 0.002 Bitter tastens 5 4 9 0.739 Rancid odorns 1 2 3 0.564 Amoniacal odorns 1 1 2 1.000 Total 1014 955
Asterisks indicate significant difference at *** P ≤ 0.001; ** P ≤ 0.01; * p ≤ 0.05; ns indicates no significant difference (p > 0.05); ND = Not determined.
was also the case for smoked fish samples and smoked-dried samples, which were appreciated by consumers with high acceptability scores. Within consumers of each product, there was one cluster of consumers, including only a few members, who did not prefer any sample they evaluated, with acceptability score less than five (neither like, nor dislike). Each sample from each category of product was characterized by its sensory attributes. Some sensory attributes used similarly by different consumer clusters for each category of product could be considered as the main sensory descriptors of this product. For the future studies involving processing technology, it is important to determine the optimal processing conditions that could confer the sensory characteristics as perceived by consumers to the end-products.
Acknowledgments
The present study was carried out with the financial support of Belgium Government through QualiSani Project/PRD- ARES-CCD. Authors are very grateful for this support. We also thank consumers for their participation to sensory characterization of meat and fish products.
Author contributions
Mahunan François Assogba designed and performed the study, analyzed data, interpreted the results and wrote the first version of manuscript. Laurent Adinsi contributed to the design of study and participated to the correction of the manuscript. Yénoukounmè Euloge Kpoclou assisted in the writing of the manuscript. Eudes Landry Anihouvi and Ben- Sadek Boukary participated to the execution of sensory tests as the study is part of their work for master degree. Jacques Mahillon, Marie-Louise Scippo and Joseph Hounhouigan contributed to the structuring and correction of the manu-script. Victor Bienvenu Anihouvi, participated in the design, results interpretation and revision of the manumanu-script. All the authors read and approved the final manuscript.
Disclosure statement
No potential conflict of interest was reported by the author(s).
61 62 63 64 65 66 67 68 69 70 Shiny color
Not shiny color
Firm texture Crumbly texture Hard texture Elastic texture
C. cyanopterus
E. fimbriata
-0.8 -0.4 0 0.4 0.8 -2.4 -2 -1.6 -1.2 -0.8 -0.4 0 0.4 0.8 1.2 1.6 2 2.4 2.8 F 2 ( 1 2 .5 8 % ) F1 (87.42 %)Biplot (axis F1 and F2 : 100.00 %)
Funding
This work was supported by the Académie de Recherche et d’Enseignement Supérieur (ARES).
ORCID
Mahunan François Assogba http://orcid.org/0000-0002-6943-2827
References
Adams J, Williams A, Lancaster B, Foley M. 2007. Advantages and uses of check-all-that-apply response compared to traditional scaling of attributes for salty snacks. In 7th Pangborn sensory science symposium; Aug 12–16; Minneapolis, MN.
Ares G, Barreiro C, Deliza R, Gimenez A, Gambaro A. 2010a. Application of a check-all-that-apply question to the development of chocolate milk desserts. J Sens Stud. 25:67–86.
Ares G, Barreiro C, Gimenez A, Gambaro A. 2010b. Use of an open-ended question to identify drivers of liking of milk desserts: comparison with preference mapping techniques. Food Qual Prefer. 21:286–94.
Assogba MF, Anihouvi DGH, Iko Afé OH, Kpoclou YE, Mahillon J, Scippo M-L, Hounhouigan DJ, Anihouvi VB. 2019. Processing methods, preservation practices and quality attributes of smoked and smoked-dried fishes consumed in Benin. Cogent Food Agric. 5(1):1641255.
Assogba MF, Kpoclou YE, Ahouansou RH, Dalode A, Sanya E, Mahillon J, Scippo M-L, Hounhouigan DJ, Anihouvi VB.
2020. Thermal and technological performances of traditional grills used in cottage industry and effects on physico-chemical characteristics of grilled pork. J Food Process Pres. doi:10.1111/jfpp.14562.
Becker A, Boulaaba A, Pingen S, Krischek C, Klein G. 2016. Low temperature cooking of pork meat — physicochemical and sensory aspects. Meat Sci. 118:82–88.
Bécue-Bertaut M, Alvarez-Esteban R, Pagès J. 2008. Ratings of products through scores and free-text assertions: comparing and combining both. Food Qual Prefer. 19:122–34.
Bécue-Bertaut M, Pagès J. 2008. Multiple factor analysis and clustering of a mixture of quantitative, categorical and frequency data. Comput Stat Data Anal. 52:3255–68.
Bryhnia EA, Byrneb DV, Rødbottenc M, Møllerd S, Claudi-Magnussend C, Karlssone A, Agerhemf H, Johanssonf M, Martens M. 2003. Consumer and sensory investigations in relation to physical/chemical aspects of cooked pork in Scandinavia. Meat Sci. 65:737–48.
Cardinal M, Knockaert C, Torrissen O, Sigurgisladottir S, Mørkøre T, Thomassen M, Vallet JL. 2001. Relation of smoking parameters to the yield, colour and sensory quality of smoked Atlantic salmon (Salmo salar). Food Res Int. 34(6):537–50.
Chambers E, Bowers J. 1993. Consumer perception of sensory qualities in muscle foods: sensory characteristics of meat influence consumer decisions. Food Technol. 47(11):116–20.
Cruz AG, Cadena RS, Castroc WF, Esmerinoa EA, Rodrigues JB, Gaze L, Faria JAF, Freitas MQ, Deliza R, Bolini HMA.
2013. Consumer perception of probiotic yogurt: performance of check all that apply (CATA), projective mapping, sorting and intensity scale. Food Res Int. 54:601–10.
Dooley L, Lee YS, Meullenet JF. 2010. The application of check-all-that-apply (CATA) to consume profiling to preference mapping of vanilla ice cream and its comparison to classical external preference mapping. Food Qual Prefer. 21:394–401.
Dos Santos BA, Bastianello Campagnol PC, da Cruz AG, MTEL G, Monteiro RA, Wagner R, Pollonio MAR. 2015. Check all that apply and free listing to describe the sensory characteristics of low sodium dry fermented sausages: comparison with trained panel. Food Res Int. 76:725–34.
Egbunike GN, Okubanjo AO. 1999. Effects of processing upon the quality of Nigerian meat products. Livest Prod Sci. 59 (2/3):155–63.
Fuller MF. 2004. The encyclopedia of farm animal nutrition. Wallingford: CABI Publishing; p. 606.
Henrique NA, Deliza R, Rosenthal A. 2015. Consumer sensory characterization of cooked ham using the Check-All-That -Apply (CATA) methodology. Food Eng Rev. 7:265–73.
Iko Afé OH. 2017. Assessment of the risk related to polycyclic aromatic hydrocabons exposure, in grilled pork, smoked fish and dried/smoked fish processed in Benin [Doctorate training dissertation]. Belgium: University of Liege. Iko Afé OH, Saegerman C, Kpoclou YE, Anihouvi VB, Douny C, Igout A, Mahillon J, Hounhouigan DJ, Scippo M-L.
2020. Polycyclic aromatic hydrocarbons contamination of traditionally grilled pork marketed in South Benin and health risk assessment for the Beninese consumer. Food Addit Contam. doi:10.1080/19440049.2020.1726502
Issanchou S. 1996. Consumer expectations and perceptions of meat and meat product quality. Meat Sci. 43:5–19. Jorge EC, Mendes ACG, Auriema BE, Cazedey HP, Fontes PR, Ramos ALS, Ramos EM. 2015. Application of a check-all-
Kpoclou E, Anihouvi V, Azokpota P, Soumanou M, Douny C, Brose F, Hounhouigan DJ, Scippo M-L. 2014. Effect of fuel and grill type on the polycyclic aromatic hydrocarbon (PAH) levels in smoked shrimp, a beninese food condiment. Food Addit Contam. 31:1212–18.
Kpoclou EY, Anihouvi BV, Azokpota P, Soumanou MM, Daube G, Douny C, Brose F, Scippo M-L, Hounhouigan DJ.
2013. Microbiological and physico-chemical quality of smoked shrimp, an expanding food condiment in beninese local markets. Food Public Health. 3(6):277–83.
Lado J, Vicente E, Manzzionia A, Ares G. 2010. Application of a check-all-that-apply question for the evaluation of strawberry cultivars from a breeding program. J Sci Food Agric. 90(13):2268–75.
Laureati M, Cattaneo C, Lavelli V, Bergamaschi V, Riso P, Pagliarini E. 2017. Application of the check-all-that-apply method (CATA) to get insights on children’s drivers of liking of fiber-enriched apple purees. J Sens Stud. doi:10.1111/ joss.12253
Lee Y, Findlay C, Meullenet JF. 2013. Experimental consideration for the use of check-all-that-apply questions to describe the sensory properties of orange juices. Int J Food Sci Technol. 48:215–19.
Manoukian EB. 1986. Mathematical nonparametric statistics. New York (NY): Gordon & Breach.
Meilgaard M, Civille GV, Carr BT. 2007. Sensory techniques evaluation. 4th ed. Boca Raton (FL): CRC Press. Moeller SJ, Miller RK, Edwards KK, Zerby HN, Logan KE, Aldredge TL, Stahl CA, Boggess M, Box-Steffensmeier JM.
2010. Consumer perceptions of pork eating quality as affected by pork quality attributes and end-point cooked temperature. Meat Sci. 84(1):14–22.
Moussaoui KA, Varela P. 2010. Exploring consumer product profiling techniques and their linkage to a quantitative descriptive analysis. Food Qual Prefer. 21:1088–99.
Mrozik A, Piotrowska-Seget Z, Labuzek S. 2003. Bacterial degradation and bioremediation of polycyclic aromatic hydrocarbons. Polish J Environl Stud. 12(1):15–25.
Parente ME, Manzoni AV, Ares G. 2011. External preference mapping of commercial antiaging creams based on consumers’ responses to a check-all-that-apply question. J Sens Stud. 26:158–66.
Poligné I, Collignana A, Trystramc G. 2001. Characterization of traditional processing of pork meat into boucane. Meat Sci. 59:337–89.
Rivier M, Kebe F, Sambou V, Ayessou N, Azoumah Y, Goli T 2010. Fumage de poisson en Afrique de l’Ouest pour les marchés locaux et d’exportation. Rapport final GP3A Fumage/CIRAD/AUF. p 59.
SCF. 2002. Opinion of the scientific committee on food on the risk to human health of polycyclic aromatic hydrocarbons in food. SCF/CS/CNTM/PAH/29/Final.
Stolyhwo A, Sikorski ZE. 2005. Polycyclic aromatic hydrocarbons in smoked fish - a critical review. Food Chem. 91:303–11.
Touraille C. 1992. Consumer evaluation of meat quality criteria. In Proceedings of the 38th International Congress of Meat Science and Technology; Clermont-Ferrand, France. August 23–28. p. 301.
Verbeke W, Oeckel MJV, Warnants N, Viaene J, Boucque CV. 1999. Consumer perception, facts and possibilities to improve acceptability of health and sensory characteristics of pork. Meat Sci. 53:77–99.