UNIVERSITÉ DE MONTRÉAL
CALIBRATION OF MACHINE TOOLS USING ON MACHINE PROBING OF AN INDIGENOUS ARTEFACT
MD MIZANUR RAHMAN
DÉPARTEMENT DE GÉNIE MÉCANIQUE ÉCOLE POLYTECHNIQUE DE MONTRÉAL
THÈSE PRÉSENTÉE EN VUE DE L’OBTENTION DU DIPLÔME DE PHILOSOPIAE DOCTOR
(GÉNIE MÉCANIQUE) AVRIL 2016
ÉCOLE POLYTECHNIQUE DE MONTRÉAL
Cette thèse intitulée :
CALIBRATION OF MACHINE TOOLS USING ON MACHINE PROBING OF AN INDIGENOUS ARTEFACT
présenté par : RAHMAN Md Mizanur
en vue de l’obtention du diplôme de : Philosophiae Doctor a été dûment accepté par le jury d’examen constitué de :
M. BIRGLEN Lionel, Ph. D., président
M. MAYER René, Ph. D., membre et directeur de recherche M. BARON Luc, Ph. D., membre
DEDICATION
ACKNOWLEDGEMENTS
I would like to express my profoundest gratitude to my research supervisor Professor René Mayer, for his invaluable advice, guidance, support and time (no matter what) whilst encouraging me to pursue my own ideas, allowing me work independently and guiding me at each and every difficult situation throughout all these years. His active research work, ideas, ingeniousness and research methods helped me to complete this research work successfully. He has always been an inspiration to me in all aspects of my life for his wisdom, kindness and trust.
My sincere thanks to the professor Marek Balazinski and Jean-François Châtelain for their valuable advices and suggestions.
I greatly acknowledge Professor Luc Baron, Lionel Birglen and Stephen Veldhuis for the time devoted to evaluate my thesis and for their acceptance to participate in the jury.
I acknowledge the National Science and Engineering Research Council of Canada (NSERC), the Consortium for Research and Innovation in Aerospace in Quebec (CRIAQ), Pratt & Whitney Canada, Meloche Group and SONACA Montreal for their financial support.
I would like to thank Mr. Guy Gironne, Vincent Mayer and François Ménard for the experimental support at Virtual Manufacturing Research Laboratory (LRFV), Ecole Polytechnique de Montreal throughout the completion of this research work.
I would like to thank my colleague, friend and office-mate Mahdi Sabaghi for his constant suggestions, encouragement and assistance. I also express my sincere thanks to Anna Los, Mehrdad Givi, Elie Bitar-Nehme, Maryam Aramesh, Yang Lian Cai, Sebastien Salor, Elisabeth D. Richard and Rachid Guiassa for their friendship, encouragement, suggestions and help during all these years.
A very special thanks to my century old grandfather who always encouraged and supported me for the entire time of this work.
RÉSUMÉ
Les centres d’usinage cinq axes avec deux axes rotatifs facilitent la production des pièces complexes grâce à la capacité de positionnement et d’orientation de l’outil par rapport à la pièce en cours d’usinage. Cependant, le centre d’usinage est vulnérable à de nombreuses sources d’erreurs. L’inspection périodique du centre d’usinage est un élément clé pour obtenir la pièce finie souhaitée dans les limites de tolérances. Les méthodes d’inspection existantes nécessitent un personnel qualifié, un montage spécial et un temps additionnel pour installer les équipements. Par conséquent, l’objectif de cette thèse est de surmonter ces contraintes et développer une nouvelle méthode pour estimer les erreurs paramétrique inter- et intra-axes par palpage d’un artefact indigène directement sur le centre d’usinage. Les palpeurs de déclenchement tactile sont utilisés pour mesurer des facettes de la table de la machine-outil. Un modèle mathématique a été développé pour modéliser les erreurs d’installation de la sonde et des artefacts afin d’enlever leurs effets lors du processus d’étalonnage. Le temps d'étalonnage est de 1 heure et 30 minutes. La validation de cet étalonnage est effectuée en comparant l’artefact du modèle estimé avec les mesures du même artefact obtenu par mesurage sur une Machine à Mesurer Tridimensionnelle (MMT). La capacité de prédiction des erreurs volumétriques du modèle est également validée en prédisant la position de la touche du stylet dans le repère de la pièce usinée pour d’autres facettes sondées pour fin de validation seulement, et les comparer avec les données mesurées par MMT. La distance résiduelle maximale entre l’artefact prédit par le modèle et l’artefact estimé par le MMT est 139.50 µm sans aucun paramètre estimé, et 6.92 µm avec 86 inter- et intra-axes paramètres estimés par le modèle.
La technique de calibration proposée est appliquée au centre d’usinage intégré avec des tables de formes prismatique et sphérique (Mitsui Seiki HU40T et Huron KX8-five). Un schéma est proposé pour examiner les performances de la machine au cours d’une journée et entre les jours. La qualité du schéma est validée avec les incertitudes des paramètres calibrés venant de la covariance de l’ensemble des résultats de cycles de mesures effectuées pendant des jours consécutifs.
La performance de l'étalonnage est évaluée en examinant la répétabilité de la mesure de la sonde de l'artefact indigène étalonné en fonction de la stratégie de sondage de l’artefact, l’indexation des axes rotatifs, les incertitudes de paramètres et le cycle de montage et démontage de l’artefact. Une nouvelle technique de mesure avec une sphère unique pour machines cinq axes est proposée pour évaluer directement sur les centres d’usinage leur capacité à prendre des mesures de position. Des facettes, sur une sphère de précision, sont mesurées pour des mouvements des cinq axes et ces mesures exprimées dans le référentiel de la table utilisant le modèle nominal sans erreurs puis le modèle estimé. Les défauts de sphéricité calculés sont analysés pour évaluer les performances de la machine. Les défauts de sphéricité d'un modèle non compensé et compensé sont 268.27 µm et 60.51 µm (HU40-T). Enfin, les performances du processus sont également étudiées en fonction du changement du statut de la machine, la surface mouillée de l’artefact, les irrégularités de surface et la répétabilité de la sonde de déclenchement tactile.
ABSTRACT
Five-axis machine tools with two rotary axes facilitate the production of intricate parts due to the position and orientation capability of the tool with respect to the workpiece but this flexibility also renders the machine tool vulnerable to numerous sources of error. Periodic inspection is the key to obtain finished part within the prescribed tolerance limits. Existing machine tool inspection methods require trained personnel, special setups and additional time to setup the test equipments. Therefore, the aim of this thesis is to overcome these limitations and develop a new method to calibrate inter- and intra-axis error parameters by on-machine probing of an indigenous artefact. A touch trigger probe is used to measure facets on the existing machine tool table. A mathematical model is developed to model the probe and the artefact setup errors and remove their effects from the estimation process. The calibration time is 1 hour and 30 minutes.
The validation of the calibration is done by comparing the model estimated artefact with the Coordinate Measuring Machine (CMM) measured artefact. The volumetric error prediction capability of the model is also validated by predicting the stylus tip positions in the last workpiece branch frame (rigidly connected to the machine table frame) for each facet probing and comparing them with the CMM measurements. The maximum residual distance between the model predicted artefact and CMM artefact is 139.50 µm with no parameters estimated and 6.92 µm with 86 inter- and intra-axis parameters estimated.
The proposed calibration technique is applied to the machine tools integrated with prismatic and cylindrical shape tables (Mitsui Seiki HU40T & Huron KX8-five). A scheme is proposed to investigate the machine performance throughout a day and between days supported by the uncertainties of the calibrated parameters estimated from the pooled covariance of the repeated measurement cycles performed for consecutive days.
The calibration performance is also evaluated by investigating the repeatability of the uncalibrated indigenous artefact probing against artefact probing strategy, rotary axes indexations, parameters’ uncertainties and artefact dismount and remount cycle.
Finally, a new technique using a single ball measurement in five-axis is proposed to assess the on machine coordinate measurement capability of the machine tool. Facets on a precision sphere are measured for five-axis positioning and expressed in the machine table frame using in turn nominal and compensated machine models. The out of sphericity of the calculated sphere is analysed to assess the performance of the machine tool. The out of sphericity of the uncompensated and compensated models are 268.27 µm and 60.51 µm respectively (HU40-T). The effects of the machine tool’s status change, artefact’s surface wetness, surface irregularities and repeatability of the touch trigger probe are also investigated.
TABLE OF CONTENT
DEDICATION ... III ACKNOWLEDGEMENTS ... IV RÉSUMÉ ... V ABSTRACT ...VII TABLE OF CONTENT ... IX LIST OF TABLES ... XIV LIST OF FIGURES ... XVII LIST OF SYMBOLS AND ABBREVIATIONS... XXIIICHAPTER 1 INTRODUCTION ... 1
1.1 Problem definition ... 2
1.2 Research objectives ... 3
1.3 Hypothesis ... 4
CHAPTER 2 LITERATURE REVIEW ... 6
2.1 Introduction ... 6
2.2 Errors in machine tool ... 6
2.2.1 Inter-axis errors ... 7
2.2.2 Intra-axis errors ... 8
2.2.3 Thermally induced errors ... 9
2.2.4 Error induced by cutting force ... 9
2.2.5 Error due to the machine load ... 10
2.2.6 Fixturing errors ... 10
2.3.1 Direct aproaches ... 10
2.3.2 Ballbar test ... 13
2.3.3 Indirect approaches ... 15
2.3.4 Errors of touch probe in calibration ... 33
2.3.5 Parameter uncertainty estimation ... 40
2.4 Conclusion of the literature review ... 42
CHAPTER 3 OVERALL THESIS STRUCTURE ... 44
CHAPTER 4 ARTICLE 1: FIVE AXIS MACHINE TOOL VOLUMETRIC ERROR PREDICTION THROUGH AN INDIRECT ESTIMATION OF INTRA- AND INTER-AXIS ERROR PARAMETERS BY PROBING FACETS ON A SCALE ENRICHED UNCALIBRATED INDIGENOUS ARTEFACT ... 46
4.1 Abstract ... 46
4.2 Introduction ... 47
4.3 Concept of an Indigenous Artefact ... 49
4.4 Mathematical model ... 50
4.5 Probing strategy ... 57
4.6 Results of preliminary tests ... 60
4.7 Results for TANGO ... 65
4.8 Results analysis ... 67
4.9 Conclusion ... 75
4.10 Acknowledgements ... 77
CHAPTER 5 ARTICLE 2: AN UNCALIBRATED CYLINDRICAL INDIGENOUS ARTEFACT FOR MEASURING INTER-AXIS ERRORS OF A FIVE-AXIS MACHINE TOOL
... 80
5.1 Abstract ... 80
5.2 Introduction ... 80
5.3 The artefact ... 82
5.4 Mathematical model ... 84
5.5 Parameter estimation and results analysis ... 86
5.6 Parameter’s uncertainty analysis ... 91
5.7 Conclusion ... 93
5.8 Acknowledgements ... 94
5.9 References ... 94
CHAPTER 6 ARTICLE 3: PERFORMANCE OF A FIVE-AXIS MACHINE TOOL AS A COORDINATE MEASURING MACHINE ... 96
6.1 Abstract ... 96 6.2 Introduction ... 96 6.3 Probing Procedure ... 99 6.4 Mathematical Model ... 102 6.5 Results of simulations ... 103 6.6 Measurement Results ... 106 6.7 Conclusion ... 110 6.8 Acknowledgement ... 110 6.9 References ... 111
CHAPTER 7 ARTICLE 4: MEASUREMENT ACCURACY INVESTIGATION OF
TOUCH TRIGGER PROBE WITH FIVE AXIS MACHINE TOOLS ... 113
7.1 Abstract ... 113
7.2 Introduction ... 113
7.3 Measurement methods and results ... 115
7.4 Conclusions ... 130
7.5 Acknowledgments ... 130
7.6 References ... 130
CHAPTER 8 ARTICLE 5: CALIBRATION PERFORMANCE INVESTIGATION OF AN UNCALIBRATED INDIGENOUS ARTEFACT PROBING FOR FIVE-AXIS MACHINE TOOL ...132
8.1 Abstract ... 132
8.2 Introduction ... 132
8.3 Mathematical background ... 134
8.4 Calibration performance analysis ... 134
8.4.1 Influence of the probing strategies ... 135
8.4.2 Influence of artefact dismount and remount cycle ... 137
8.4.3 Influence of rotary axes indexations change ... 139
8.4.4 Uncertainties of the estimated parameters ... 141
8.5 Conclusion ... 142
8.6 Acknowledgments ... 143
8.7 References ... 143
CHAPTER 10 CONCLUSION AND SCOPE OF FUTURE WORKS ... 150
10.1 Conclusion and original contribution ... 150
10.2 Scope of future works ... 151
LIST OF TABLES
Table 4-1 All potential polynomial coefficients of intra-axis errors parameters of the WCBXFYZT machine tool. Subset S1 contains none of those parameters. Subset S2 includes coefficients in red bold. Subset S3 also includes coefficients in purple underlined and subset S4 also includes coefficients in blue bold underlined ... 57 Table 4-2 Facets probing strategy. Facet numbers are followed according to Figure 4-2. Numbers 1 and 2 (Red and bold) refer to the sphere of the scale bar measured only once ... 59 Table 4-3 Variability of probing due to non-repeatability, surface irregularities, drift and direction of probing ... 64 Table 4-4 Estimated parameters for the four subsets ... 66 Table 4-5 Estimated parameters (subset S3) using the TANGO (Touch ANd GO) method; all machine position compensation tables are set to 0 ... 67 Table 4-6 Unexplained volumetric error norms for different estimated parameter subsets ... 68 Table 4-7 Comparison of the TANGO estimated artefact geometry with the CMM metrology of the facets; maximum, mean and standard deviations for the four different estimation subsets ... 70 Table 4-8 Volumetric position prediction capability, all data used for estimation and for validation: maximum, minimum, mean and standard deviation of the residuals distances for the four different subsets ... 72 Table 4-9 Volumetric position prediction capability, five indexation data used for validation only: maximum, minimum, mean and standard deviation of the residuals between predicted stylus tip in C frame using 5 ABC indexations vs. CMM measurements of the artefact ... 74 Table 5-1 Inter-axis error (symbols as per ISO 230-1:2012(E) [1]) ... 84 Table 5-2 Mean and range of the estimated errors for Procedure B (Strategies S1 and S2 alternating four times in a single day); data is processed per Strategy or combined with the
points on the top surface of the machine table (S1+S2) or without those points
(S1+S2-Points on the table) ... 88
Table 5-3 Variation of inter-axis and relative scale errors between the days and the cycles for Procedure A ... 90
Table 6-1 Effect of individual error parameters on measurement’s out of sphericity ... 104
Table 6-2 Estimated machine error parameters by probing an uncalibrated indigenous artefact 107 Table 6-3 Out of sphericity of the probing results, maximum and minimum residuals and standard deviation when using the machine nominal model and estimated model to calculate the tool tip position in the machine table frame (Strategy I and Strategy II) ... 108
Table 7-1 Range and standard deviation of the probing measurements for 300 repetitions in each of the selected directions ... 116
Table 7-2 Pooled standard deviation for a window of 25 probing measurements based on the probing measurements for 300 repetitions in each of the selected directions ... 118
Table 7-3 Range and standard deviation for all four approaches in Procedure II ... 119
Table 7-4 Range and standard deviation of the 5×5 spatial grid probing ... 121
Table 7-5 Individual standard deviation for each grid point ... 123
Table 7-6 The range and standard deviations of six spatial grid probing in CMM ... 126
Table 7-7 The range and standard deviations of six spatial grid obtained by a Mitutoyo MPP-300 scanning probe on CMM ... 129
Table 8-1 Effect of strategies: Analysis criteria ... 135
Table 8-2 Effect of change in probing strategy (change in facets location). Mean values of the estimated parameters of all strategies, individual strategy and the range of means of the strategies ... 136
Table 8-3 Effect of artefact dismount and remount cycle in parameter estimation ... 138
Table 8-5 Mean and standard deviations of the estimated parameters for the five ABC subsets applied to the 20 measurement cycles ... 141 Table 8-6 Uncertainties of the estimated parameters ... 142
LIST OF FIGURES
Figure 2-1 Machine error of an X–Y machine with magnified errors on the X-axis guide way
(Ekinci and Mayer 2007) ... 7
Figure 2-2 Inter-axis errors of C axis (rotary) and inter-axis errors of Z axis (linear) (Schwenke, Knapp et al. 2008) ... 8
Figure 2-3 Intra-axis errors of linear (Z-axis) and Rotary (C-axis) axes (Schwenke, Knapp et al. 2008) ... 9
Figure 2-4 Laser Interferometer for positioning accuracy measurement (Schwenke, Knapp et al. 2008) ... 11
Figure 2-5 Straightness interferometer with a Wollaston prism (Schwenke, Knapp et al. 2008) .. 12
Figure 2-6 Angular Interferometer (Schwenke, Knapp et al. 2008) ... 13
Figure 2-7 Machine behavior observed from a ball bar measurement (Ballbar 1999-2009) ... 14
Figure 2-8 Polygon and autocollimator (left); Master ball and LVDTs (right) (Suh, Lee et al. 1998) ... 16
Figure 2-9 Ball bar configurations to estimate intra-axis errors of a trunnion axis (Zargarbashi and Mayer 2006) ... 18
Figure 2-10 3D probe-ball for five-axis machine tool’s accuracy test ... 21
Figure 2-11 Proposed test paths for the 3D probe-ball device (Lei and Hsu 2002) ... 21
Figure 2-12 R-test device mounted on a five-axis machine tool (Weikert and Knapp 2004) ... 22
Figure 2-13 Ball plate artefact(left) and the measuring device (right) (Bringmann, Kung et al. 2005) ... 23
Figure 2-14 Model Based “Chase-the-Ball” technique (Bringmann and Knapp 2006) ... 24
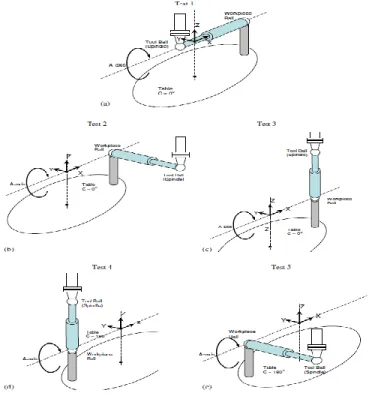
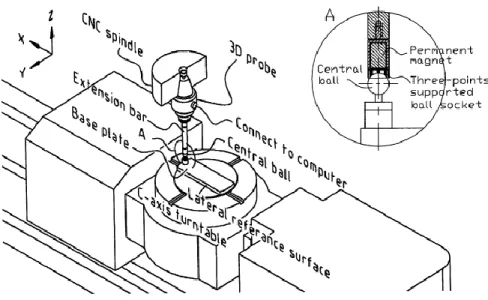
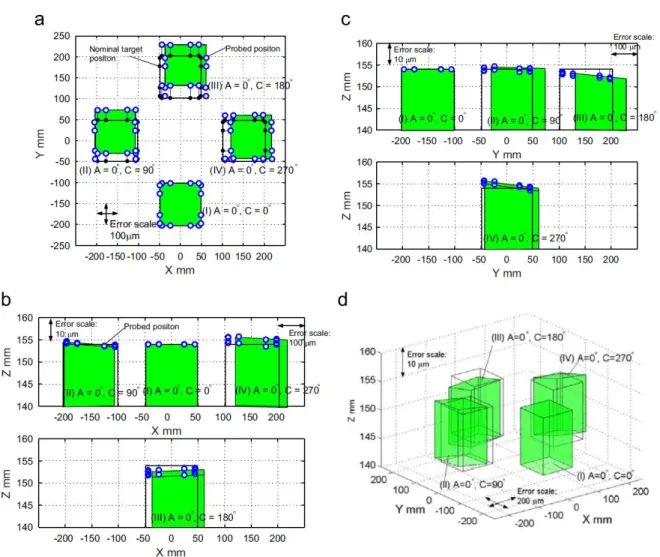
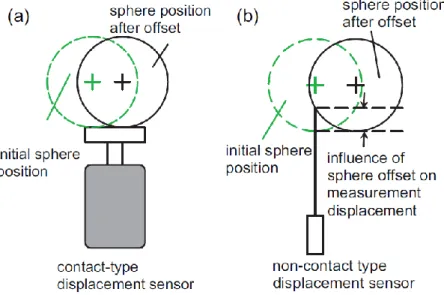
Figure 2-16 A 3D Reconfigurable Uncalibrated Master Ball Artefact (RUMBA) probing (top). Ball center measurement (bottom) (Erkan, Mayer et al. 2011) ... 26 Figure 2-17 SAMBA probing on a WCBXbZYT machine tool (left) and the estimated inter-axis error parameters (right) (Mayer 2012) ... 27 Figure 2-18 Test piece probing pattern (Ibaraki, Iritani et al. 2012) ... 28 Figure 2-19 Experimental setup (Ibaraki, Iritani et al. 2012) ... 29 Figure 2-20 a) Influence of A-axis squareness to Z-axis and linear offset of C-axis in X-direction, b) position of the probing points (Ibaraki, Iritani et al. 2012) ... 30 Figure 2-21 Projection of the probing points in a) XY, b) XZ and YZ plane. d) 3D view of the errors (Ibaraki, Iritani et al. 2012) ... 31 Figure 2-22 Effects of the sphere center offset on displacement sensors (Hong and Ibaraki 2013)
... 32 Figure 2-23 Sphere center offset correction for non-contact type laser displacement sensors (Hong and Ibaraki 2013) ... 33 Figure 2-24 2-D and 3-D probe lobing assessment (Cauchick-Miguel and Kings 1998) ... 35 Figure 2-25 a) One stage type touch trigger probe, b) Two stage type touch trigger probe (Dobosz and Wozniak 2003) ... 35 Figure 2-26 Touch trigger probe testing using reference axis: a) schematic and b) test set up (Dobosz and Wozniak 2005) ... 37 Figure 2-27 Characteristics of an average triggering radius: a) TP200 and b) OMP40-2 (Jankowski and Wozniak 2016) ... 39 Figure 2-28 a) Set-up and application of 3D-ball plate for machining centers. b) Distorted workpiece obtained from 3D-ball plate measurements (left), change of squareness between Y- and X-axes (EC0Y) at different measuring lines (12000x) (right) ... 41
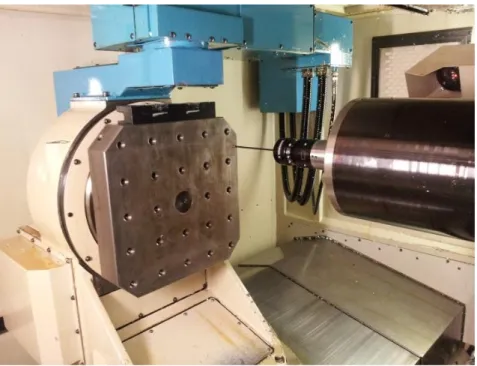
Figure 4-1 Machine table, of a WCBXFZYST five-axis machine tool, used as indigenous artefact for probing ... 49 Figure 4-2 Selection of facets defined as nominal points’ coordinates on the surface and their respective nominal local unit normal vector. Facets are numbered from 3 to 28; number 1 and 2 are kept for the identification of the two spheres of the scale bar ... 50 Figure 4-3 WCBXFZYST machine tool with inter-axis error parameters (adapted from [11]) .... 53 Figure 4-4 Linear and rotational displacements of axes with their intra-axis errors ... 53 Figure 4-5 Facet probing. The red circle is the probe stylus tip ... 55 Figure 4-6 Wetness effect on probing in Z-axis (left) and 3D-direction (right). Each probing takes approximately 11.3 seconds ... 61 Figure 4-7 Unexplained volumetric residual vectors magnified 10000x. Each arrow color corresponds to a (b, c, s) indexation triplet. Top left: using subset S1 (stylus tip centre and facets errors only). Top Right: using subset S2 (Subset S1 plus the linear axis linear positioning errors). Bottom left: using subset S3 (subset S2 plus the inter-axis error parameters and backlashes). Bottom Right: using subset S4 (all identifiable inter- and intra-axis errors coefficients). All residuals are projected in the artefact frame ... 69 Figure 4-8 Residuals between TANGO estimation and CMM measurement of the artefact (10000x). a) Subset S1, b) Subset S2, c) Subset S3 and d) Subset S4 ... 71 Figure 4-9 Volumetric position prediction capability, all data used for estimation and for validation: residual distances (1000x) between predicted probe stylus tip position in C frame and CMM measured artefact ... 73 Figure 4-10 Volumetric position prediction capability, five indexation data used for validation only: residual distances (1000x) between TANGO predicted facets using a subgroup of probing information vs. CMM measured artefact. a) Subset S1, b) Subset S2, c) Subset S3 and d) Subset S4 ... 75
Figure 5-1 Indigenous artefact probing on the wCAYbXZ(C1)t machine tool. A-axis is shown
slightly rotated. Facets are shown for Strategy S1 ... 82
Figure 5-2 Indigenous artefact with the nominal target points and their local nominal normal for Strategy S1 ... 83
Figure 5-3 Indigenous artefact with the nominal target points and their local nominal normal for Strategy S2 ... 83
Figure 5-4 Kinematic model of the wCAYbXZ(C1)t machine tool with inter-axis errors ... 85
Figure 5-5 A- and C-axis indexation combinations (Strategies S1 and S2) ... 87
Figure 5-6 Variation of the estimated errors between days (Strategy S1) ... 89
Figure 5-7 Variation of the estimated errors between cycles (Strategy S1) ... 90
Figure 5-8 Calibration results for the four cycles of procedure B and four data sets with the pooled by cycles and pooled by days uncertainties ... 91
Figure 5-9 Results for repeated measurement of strategies S1 and S2 with the uncertainty including daily changes attached only to extreme values ... 92
Figure 6-1 B- and C-axis combinations (calibration set). The first 20 B- and C- axis indexations are also used as Strategy I validation set ... 100
Figure 6-2 B- and C-axis combinations for Strategy II validation set ... 100
Figure 6-3 Points distribution on the test sphere for machine model validation purposes ... 101
Figure 6-4 The precision sphere probing on the wCBXfZY(C1)t machine tool ... 101
Figure 6-5 Merging the various indexations probing results. B- and C-rotary axis indexations are in degrees ... 103
Figure 6-6 Effect of EA0B, EA0C, EA0Y and EB0C on the out of sphericity measurement ... 105
Figure 6-7 Effect of EB0Z, EC0B, EC0Y and EX0C on the out of sphericity measurement ... 105
Figure 6-9 Effect of EXX, EYY, EZZ and No parameters on the out of sphericity measurement ... 106
Figure 6-10 Residuals without machine compensation (100x) ... 108
Figure 6-11 Residuals with machine compensation (100x). (Strategy I validation set) ... 109
Figure 6-12 Residuals with machine compensation (100x). (Strategy II validation set) ... 109
Figure 7-1 Probing on a WCBXFZYT machine tool ... 115
Figure 7-2 Procedure I (Unidirectional repeatability) ... 116
Figure 7-3 Spindle with nozzle to spray cutting fluid holding the probe ... 117
Figure 7-4 Procedure II (Approaches A, B, C and D)... 119
Figure 7-5 Effect of surface irregularities on probing of a 2 by 2 mm spatial grid along the X-, Y-, Z-, 2D- and 3D-directions ... 121
Figure 7-6 A typical trends for spatial grid measurement along X-, Y-, Z-, 2D- and 3D- direction (14th grid point) denoted by a, b, c, d and e respectively. As the spatial grids measurement repeats for 19 times hence the point is measured for 19 times. The variations are in “mm” ... 124
Figure 7-7 Spatial grid probing on a CMM (grid size is 200 µm × 200 µm) ... 125
Figure 7-8 The Coordinate Measuring Machine (CMM) and surface quality at X-, Y- and Z-direction ... 126
Figure 7-9 Surface irregularity effect on a 200 µm × 200 µm spatial grid. a) Negative X-probing, b) positive X-probing, c) positive Y-probing, d) negative Y-probing, e) negative Z-probing in X+ region and f) negative Z-probing in X- region of the artefact ... 127
Figure 7-10 Mitutoyo MPP-300 scanning probe to measure 15 mm by 15 mm spatial grid on CMM ... 128
Figure 7-11 Residuals for a sphere probing (1000x) (a) and (b), probe lobing error (c) and interpolated lobing error (d) ... 129
Figure 8-1 Effect of change in probing strategy (change in facets location). Mean values of the estimated parameters of all strategies ... 137 Figure 8-2 Mean values of the estimated parameters for the five ABC subsets applied to the 20 measurement cycles ... 140 Figure 8-3 Uncertainties vs standard deviaiton of the estimated parameters ... 142
LIST OF SYMBOLS AND ABBREVIATIONS
The list of symbols and abbreviations are used in the thesis in alphabetical order along with their meanings.
CMM Coordinate Measuring Machine
HTM Homogeneous Transformation Matrices
RUMBA Reconfigurable Uncalibrated Master Ball Artefact SAMBA Scale And Master Ball Artefact
TANGO Touch ANd GO
CNC Computer Numerical Control
1D One Dimensional
2D Two dimensional
CHAPTER 1
INTRODUCTION
Manufacturing industries involving metal removal processes are desired to obtain geometrically accurate finish parts within the design tolerance. In order to achieve dimensionally conform part, accuracy of the machine tools is a prior concern to the manufacturer hence periodic inspection is essential. Five-axis machine tools with two rotary axes provide enormous flexibility to fabricate complex geometric parts with a reduced number of setups and higher precision. The downside is the rotary axes bring further sources of errors. Direct calibration techniques attempt to measure the individual error sources. Laser interferometer, electronic level, autocollimator, dial gauge etc. are the most widely used instruments for direct calibration. For the linear axes it is comparatively easy to estimate the error parameters whereas for the rotary axes it is more difficult. Moreover, the estimation process is time consuming, requires trained personnel and is sometimes too difficult to conduct. To avoid these complexities, researchers pursued indirect calibration techniques.
In 1972 David McMurty invented the touch trigger probe (Renishaw plc - 2015) which was only used on CMMs but later on integrated to machine tools as an interchangeable device with the cutting tool mounted in the machine’s spindle. Hence, machine tool programmers exploit this device to locate the workpiece prior to the machining operation. Over time indirect calibration techniques have utilized the touch trigger probe for calibration purposes. Indirect approaches measure the combined effect of multiple error sources and use mathematical models to estimate the individual error sources. Indirect approaches have involved either calibrated or uncalibrated artefacts measurements or special instruments (double ball bar) to gather machine’s geometric information. Aside from the artefact measurements by touch probe, ball bar is one of the most popular devices that is used for indirect calibration.
Numerous research work has been carried out to calibrate five-axis machine tools in an indirect manner in the past decades (Bringmann and Knapp 2006; Hong and Ibaraki 2013; Ibaraki, Iritani et al. 2012; Lei and Hsu 2002; Mayer 2012; Weikert and Knapp 2004). R-test device, RUMBA or SAMBA technique, 3D probe ball artefact, test piece measurement, non-contact R-test, 2D ball plate artefact, model based chase-the-ball etc. used artefacts and some techniques involve double ball bar device (Abbaszadeh-Mir, Mayer et al. 2002; Zargarbashi and Mayer 2006).
All these research work require artefacts or instruments (externally brought into the machine tool), operator intervention and most cases trained personnel.
1.1 Problem definition
Minimizing the production down time, high quality product with accurate geometric dimension, rapid and automated inspection have always been a challenge to the manufacturer thus periodic but automated inspection of the machine tools is needed. Existing inspection techniques involve artefacts/instruments attachment within the machine’s working envelop. The artefacts/instruments setup requires time, their handling and storing can be costly, and trained personnel may be required during the inspection process. Consequently, the inspection process no longer remains automated; this increases the chances of human error occurrence. Moreover, handling the artefacts or instruments may require special care causing additional expenses. Additional artefact can also add undesirable geometric errors therefore the question remains, is it possible to calibrate inter- and intra-axis errors of machine tools without human intervention in an automated manner?
The answer to this question involves the following elements:
an error model to identify the inter- and intra-axis error parameters of five-axis machine tools;
a technique or strategy to gather machine geometric information, which can be used in the error model to calibrate the parameter, that is fully automated;
a procedure to validate the proposed error estimation process; variables that might influence the calibration quality;
scheme to evaluate machine tool’s measuring performance utilizing the proposed calibration approach;
1.2 Research objectives
General objectiveThe substantial drawback in the existing calibration techniques is that, they require brought-in artefacts or special instruments thus hindering the automation of the process. The main objective of this thesis is to “develop a calibration technique by on machine probing of an uncalibrated indigenous artifact in order to rapidly obtain the machine parameters in an automated manner”.
Specific objectives
a) Use an existing error model to identify inter- and intra-axis error (link and motion error) parameters by on-machine probing of an uncalibrated indigenous artefact.
Use an error model based on homogeneous transformation matrices to use facet probings on existing machine tool’s features considered as indigenous artefact. Facets are distinct features with nominal locations and local nominal normals. Actual position and orientation of the facets are unknown.
b) Propose artefact probing strategy to gather machine tool’s data for calibration and artefact geometry estimation.
To gather machine tool data faster and efficiently, different artefact probing strategies need to be studied. The number of measurement points should be greater than the number of unknowns and the probing strategies should be optimized to limit the time taken.
c) Justify the error model and artefact probing strategy by simulation against the numerical stability of the estimation.
Error model and artefact probing strategies need to be numerically validated. The mathematical quantity called condition number1 of the sensitivity matrix (Jacobian) is observed. Ideally the value is 1 to infinity for a singular matrix.
1
The idea of the condition number was suggested by Wolfgang Knapp during a conversation with Professor Mayer and validated numerically in this work
d) Perform calibration, validate through artefact estimation and model’s volumetric position prediction capability.
A well-defined artefact probing strategy with an extensive error model is sought based on the simulated results followed by CNC programming. Artefact measurements provide rich information about the machine tool’s geometry for calibration. CMM measurements of the artefact and the estimated artefact can be compared for the validation purposes. Predicted tool position obtained from the estimated model can also be compared with the CMM measurements for additional validation.
e) Investigate the machine tool’s performance for coordinate measurements.
Calibration results can be used to investigate the machine tool’s coordinate measurement performance. Facets on a precision sphere can be measured and data can be analyzed by both the nominal and the calibrated machine model.
f) Evaluate the robustness of the calibration.
Repeatability of the proposed calibration method can be investigated against calibration process variables such as: probing strategies, rotary axes indexations, artefact dismount and remount cycle.
1.3 Hypothesis
a) A local artifact measurement data can provide the necessary machine tool
information to estimated inter- and intra-axis parameters.
Five-axis machine tool has built-in machine tool table or fixtures that are typically used to attach the workpiece for the machining operation. These table or fixtures can provide necessary machine tool data for calibration.
b) Surface form errors of the artefact have little or no influence on the calibration quality.
The error model is independent to the geometric shape of the artefact since the probing involves measuring facets in a considerably small area where the variation of the shape is negligible.
c) Position and orientation of the artefact is only nominally known.
Actual artefact may depart from nominal values due to the effect of the machine errors and artefact geometric errors. Hence the sensitivity of the probe stylus tip to the artefact is projected along the nominal normal direction.
d) Constraining the artefact degree of freedom at each machine pose is required to
have better estimation.
To gather machine tool data, the artefact is required to be measured at different machine tool’s axes combinations (or at different pose) and at each such pose, artefact’s degree of freedom needs to be metrologically constrained i.e. the distribution of the measurement points should be similar to a kinematic set of constraints blocking all six degrees of freedom.
CHAPTER 2
LITERATURE REVIEW
2.1 Introduction
Five-axis machine tool provides better positioning, higher accuracy at higher machining speed with minimum number of setups due to its position and orientation capability of the tool with respect to the workpiece. Geometric errors related to the rotary axes are very difficult to estimate using existing instruments. Additionally, dynamic errors of the rotary axes adds new challenge to the metrologist. Many works in the literature can be found that focused on the linear axes error estimation and different instruments are successfully applied to compute these errors directly. But the interdependent rotary and linear axes errors, axis location and positioning errors of rotary axes still remains a challenge for high speed precision machining. Proper error modelling is required to estimate the error parameters when the calibration is done indirectly. Prior to the error modelling, knowledge of the nature and sources of the errors are important. At the beginning of this section, different types of machine tool errors and their sources will be discussed. Later on, existing calibration approaches will be addressed followed by the inaccuracies induced by the measuring instrument and parameters’ uncertainty. Finally a brief conclusion clarifying the limitations of the existing methods will be discussed.
2.2 Errors in machine tool
In a geometrically perfect machine tool, the position and orientation deviation of the tool with respect to the workpiece is zero. But in reality, it is likely impossible to find a geometrically perfect machine tool. Temperature changes, gravitational force of the components, fixtures, workpiece and the motion of the axes yield inaccuracies. For five-axis machine tools, rotary axes provide additional geometric complexities thus machine tools are susceptible to numerous error sources. Some errors are position independent known as link errors or inter-axis errors and some are position dependent known as motion errors or intra-axis errors. Inter-axis error describes the relative position and orientation deviation of the machine’s successive joints (prismatic and rotary) which includes joint misalignments, angular offsets and rotary axes separation. Intra-axis error describes the erroneous motion of the machine joints such as scale gain errors, straightness
errors, roll, pitch and yaw of the linear axes and angular positioning errors, tilt errors, radial and axial errors of the rotary axes (Abbaszadeh-Mir, Mayer et al. 2002). Therefore, in the actual machine tools, the combined effects of inter- and intra-axis errors yield position and orientation deviation of the tool with respect to the workpiece. Such deviation is known as the volumetric error (Figure 2-1).
Figure 2-1 Machine error of an X–Y machine with magnified errors on the X-axis guide way (Ekinci and Mayer 2007)
2.2.1 Inter-axis errors
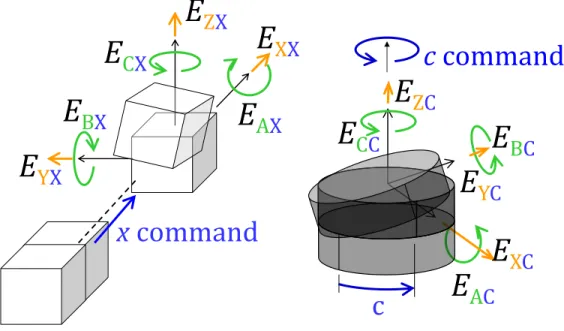
Inter-axis errors or the axis location errors are the deviations of the axes average line from its nominal position and orientation. Rotary axes have five inter-axis errors: two positioning errors, two orientation errors and one zero angular positioning error as shown in Figure 2-2. The linear axes have two orientation errors and one zero positioning error (Figure 2-2).
Figure 2-2 Inter-axis errors of C axis (rotary) and inter-axis errors of Z axis (linear) (Schwenke, Knapp et al. 2008)
2.2.2 Intra-axis errors
The intra-axis errors are also known as the motion errors. They describe the deviation of an axis from its perfect motion. Linear axes have six intra-axis errors which include two straightness errors, one positioning error, one pitch, one roll and one yaw error. Rotary axes have two radial errors, two tilt errors, one axial and one angular positioning error (Figure 2-3).
Figure 2-3 Intra-axis errors of linear (Z-axis) and Rotary (C-axis) axes (Schwenke, Knapp et al. 2008)
2.2.3 Thermally induced errors
When machine tools are in operation, heat is generated by the moving elements and causes expansion to the different structural elements. The expansion creates geometric deviations of the tool location with respect to the workpiece. Bearing, gear and hydraulics, drives and clutches, pumps and motors, guide ways, cutting action and swarf, external heat source etc. are significant sources of heat causing thermal error.
2.2.4 Error induced by cutting force
During machining, force created by the cutting operation may propagate through different machine tool causing elastic deviations. The deformation in the machine tool’s structure induced by cutting force causes dimensional and form errors in the machined part and tool wear affects the dimension of the machined part. The components of the machine tools under load considered as Elastically Linked System (ELS) in order to observe the individual deformation of any particular components (Archenti and Nicolescu 2013).
2.2.5 Error due to the machine load
Depending on the size, position and weight of the workpiece in the machine tool’s working volume, the geometry of the machine tool can be altered (Schwenke, Knapp et al. 2008).
2.2.6 Fixturing errors
Location of the workpiece on the fixture and the flexibility of the fixture cause fixturing errors. Position of the fixturing elements, clamping sequence, clamping intensity, type of contact surfaces etc. can cause workpiece displacement (Ramesh, Mannan et al. 2000).
2.3 Inter- and intra-axis error calibration approaches
To calibrate five-axis machine tools, both direct and indirect approaches have been sought. Direct techniques required special instruments and precise setups along with specially trained personnel. The investigation process is sometimes arduous and time consuming which increases the production down time. Thus, indirect methods are becoming more popular for five-axis machine tool calibration. Since most of the five-axis machine tools are equipped with touch trigger probe, researchers are pursuing strategies to utilize the touch probe to gather necessary machine tool data for calibration.
2.3.1 Direct aproaches
Direct calibration involves the mechanical error measurement of a single axis without the involvement or influence of the other axes (Schwenke, Knapp et al. 2008). Straight edges, line scales, step gauges, squares, precision levels, slip gauge etc. are the most common calibration instruments for the errors associated with the prismatic axes and dial gauges and autocollimators can be used to measure the rotary axes errors. The following subsections will discuss the direct measuring techniques of linear axis positioning errors, such as straightness errors, angular errors and squareness errors, as well as the rotary axes errors.
2.3.1.1 Positioning errors measurement
Laser interferometer is the most widely used instrument to compute positioning errors. Gauge blocks, step gauges, line scales, calibrated scales or encoder systems can also be used. In interferometric techniques, linear positioning errors are converted into wavelength measurements. Figure 2-4 shows a typical laser interferometer technique for positional error measurements. The laser interferometer is aligned with the axis to measure the positioning error. The laser beam emitted from the leaser head (1) is split into two beams at the beam splitter (2). The beams are then reflected by the two retro reflectors (3) and recombined at the beam splitter before reaching the detector (Figure 2-4). The phase changes between these two beams provide the displacement of the axis in motion.
Figure 2-4 Laser Interferometer for positioning accuracy measurement (Schwenke, Knapp et al. 2008)
2.3.1.2 Straightness error measurement
Straightness errors are the lateral displacement along the axis motion. This is a motion error since the lateral displacement depends on the position of the corresponding axis. A straightness reference, such as a straightedge aligned with the average axis motion, and a dial indicator are typically used to measure the straightness error of an axis. As the axis moves, the dial indicates. The lateral displacement can also be measured using a capacitance or other proximity electronic
gauge. Alternately, a Wollaston prism and a roof reflector prism can be used with the laser interferometer to build a straightness interferometer (Figure 2-5). The prism splits the incoming laser beam into two separate beams at an angle. The beams are then reflected by the straightness reflector and recombined to generate an interference signal that allows to determine the lateral displacement (Schwenke, Knapp et al. 2008).
Figure 2-5 Straightness interferometer with a Wollaston prism (Schwenke, Knapp et al. 2008)
2.3.1.3 Angular error measurement
Angular errors can be measured by interferometry using an angular interferometer. In an angular interferometer, the source laser beam is split into two parallel beams both reflected by a separate retro reflector (Figure 2-6). The path variation of the beams results from the angular deviation of the linear axes. An autocollimator can also be used to measure the angular motion error. In an autocollimator, a light beam is aligned with a mirror attached to the machine tool`s moving axis (Schwenke, Knapp et al. 2008).
Figure 2-6 Angular Interferometer (Schwenke, Knapp et al. 2008)
2.3.1.4 Rotary axes error measurement
ISO 230-1 (ISO 2012) proposed a technique that involves dial gauge to measure the radial and the axial offsets of the rotary axes in a direct fashion. Capacitive or inductive sensors can also be used to measure these offsets. Two sensors are used to measure two radial error motions of the rotary axes by placing them along the respective axis directions. To measure the axial error motion, one sensor is placed in the center of the front surface of the rotary axes (Schwenke, Knapp et al. 2008).
2.3.2 Ballbar test
Ballbar is one of the most widely used device to have a quick snapshot of the machine tool’s performance. Ball bar test provides graphical representation of the machine tool’s behavior and allow the users to take corrective actions. In a ball bar test, one of the two precision magnetic sockets is attached to the machine tool table and the other to the machine spindle. A telescoping linear sensor with precision balls at each end is attached to the sockets. The distance between the two balls are precalibrated and known. Then a circular path is followed using the axis command of the machine tool where the ball connected to the spindle is considered as the center of the
circle and the other ball mounted on the machine table follows a circular path. The length of the ball bar measured as the radius of the circle. Ideally the circular path should form a perfect circle but due to the machine tools errors the table moves away from the programmed radius and create different pattern as shown in Figure 2-7 (Ballbar 1999-2009). These test patterns provide the necessary information about the eccentric behavior of the machine tools or the type of errors that the machine tool is suffering from. For example, if the circular test of a machine tool has a pattern like Figure 2-7 (top left) where there are inward or outward steps toward or from the center of the plot, it means that the machine is experiencing a jump in motion when the direction of motion is changing. This represents the backlash error of the machine tool. Negative backlash causes inward steps and positive backlash causes outward steps in the circular test. The backlash error can be due to the play in the guide ways or the drive system, the encoder hysteresis or a worn ball screw. Hence, the operator must check the machine backlash compensation, check if the machine is affected by the encoder hysteresis, remove the play in guide ways or drive system or check the possible wear in ball screw or guide ways.
Figure 2-7 Machine behavior observed from a ball bar measurement (Ballbar 1999-2009)
Backlash Error Cyclic Error Servo Mismatch
Even though the ballbar test provides enormous information about the machine tool’s eccentric behavior there are still geometric and motion error parameters remains uncalibrated for both rotary and linear axes which might significantly influence the accuracy of the machine tools.
2.3.3 Indirect approaches
In this section, existing indirect calibration approaches for five-axis machine tool will be discussed followed by the inaccuracies added by the measuring instruments and the uncertainties of the estimated parameters.
Schwenke et al. reviewed the indirect calibration techniques which involve partially or totally uncalibrated artefacts, ball bar and calibrated artefacts for the measurements for CNC machine tool. The authors suggested that the identification of the geometric errors through a proper error modeling, geometric data acquisition strategy and proper validation is required for this type of inspection. Considering the rigid body kinematics, these models can be based on the following hypotheses: for linear axes, six components errors and three location errors, and for rotary axes, six component errors and five location errors (Figure 2-2 and Figure 2-3) since these component and location errors cause the volumetric deviation in the machine tools (Schwenke, Knapp et al. 2008). Srivastava et al proposed a volumetric error model induced by the propagation of both scalar and position dependent geometric errors and time dependent thermal errors. The authors used small angle approximations considering the shape and joint transformations for inaccurate links and joints. The authors concluded that, the angular deviations are independent from the translational errors but the deviations of the tool point are dependent on rotational and translational errors. Authors also suggested that, CNC compensation for X-, Y- and Z- are possible based on simulated results (Srivastava, Veldhuis et al. 1995). Later on, Veldhuis and Elbestawi proposed a neural network model to compensate the errors induced by the thermal and axis motion change. Machine geometric data was obtained by ball bar measurements (Veldhuis and Elbestawi 1995).
Suk-Hwan et al. (Suh, Lee et al. 1998) proposed an error model based on homogeneous transformation matrix and compensation algorithm for rotary axes errors. A homogeneous transformation matrix carries the information of the rotational and translational deviation of the
machine tool axes. A polygon mirror with 12 faces at every 30 and two autocollimators (Figure 2-8) is used to measure the rotational error of the rotary table. For the translational errors, a master ball and three linear variable differential transformers (LVDTs) are used. The compensation algorithm modify the CL-data using the error model and the measured rotational and translational errors.
Figure 2-8 Polygon and autocollimator (left); Master ball and LVDTs (right) (Suh, Lee et al. 1998)
For the verification of error model and compensation algorithm, a ball table with 12 master balls of 18 mm diameter are manufactured and attached to the rotary table while the center of the rotary table considered as the origin of the ball table. A touch probe is then used to measure one surface point on each master ball at different rotary table indexations and the machine tool data is recorded to find the error components of the rotary table. Based on the rotational and translation errors, the surface point measurements are then analyzed to verify the error model and compensation algorithm. The authors claimed that, the precision of the rotary table can be improved by the developed algorithm but the misalignment of the ball table and the rotary axis is avoided which can be a greater sources of inaccuracy. Thus, a good error model includes the minimum number of machine error parameters which explains the maximum volumetric deviation. Abbaszadeh-Mir et al. developed a method based on the mathematical analysis of
singularities of the linear system to identify the minimum number of inter-axes error parameters to calibrate five-axis machine tools (Abbaszadeh-Mir, Mayer et al. 2002). The authors demonstrated the effectiveness of the method to identify the inter-axis error parameters accurately through numerical simulations. Forward kinematic model is used to calculate the position of the tool relative to the workpiece. Based on (Everett and Suryohadiprojo 1988), a machine model is constructed then the minimal set of inter-axis error parameters are selected. Simulated data is obtained from a telescoping magnetic ball-bar measurements used to support the parameter selection.
Mir et al. used Chebyshev polynomials to model inter- and intra-axis error parameters and compute the errors associated with the tool tip for a given command location. The authors proposed an approach to verify the machine tool’s capability to produce a part within the desired tolerance while the influences of the inter- and intra-axis error parameters are considered. The effect of inter- and intra-axis errors on the tool path data is demonstrated for a curve and a surface profile. CAD/CAM system (e.g. CATIA) is used to generate the cutter location (CL) data for the tool path of the curve and surface profiles and a post-processor generates the machine axis commands based on its nominal inverse kinematics. The polynomial functions are then used to calculate the corresponding inter- and intra-axis errors. Forward kinematic error model is used to predict the tool path in the form of curve or surface profile (Mir, Mayer et al. 2002).
According to (Abbaszadeh-Mir, Mayer et al. 2002) eight parameters are required to define the geometry of five-axis machine tools in space. Thus, Tsutsumi et al. (Tsutsumi and Saito 2003) developed a method to estimate and compensate these eight inter-axis error parameters through exploiting the relative displacement between the tool and the workpiece measured by a telescoping ball bar system. The measurement involves only three axis motion including a rotary axis. Four measurements are required for the precise evaluation of the deviations and eccentricities of a circular arcs, afterwards, the authors proposed a calibration method for inter-axis parameters based on simultaneous control of four axes of five-inter-axis machine centers with a tilting rotary table (Tsutsumi and Saito 2004). Two prismatic axes and both rotary axes are moved simultaneously. The first four of the eight inter-axis parameters are identified and computed from the observation equations while the observations are made using double ball bar.
The remaining four parameters are geometrically calculated. Zargarbashi et al. proposed a technique involving double ball bar measurements to estimate the intra-axis error parameters of the trunnion axes of five axis machine tools while only the trunnion axes moves for data acquisition. Five different ball bar configurations are obtained by a single set up and the ball bar positions remain unchanged in the work piece side (Figure 2-9) (Zargarbashi and Mayer 2006).
Figure 2-9 Ball bar configurations to estimate intra-axis errors of a trunnion axis (Zargarbashi and Mayer 2006)
In five-axis machine tools, rotary axes error parameters play an important role on the machining accuracy. Thus, Lei et al. proposed a method to measure intra-axis errors of the rotary axes using double ball bar measurements where three translational axes remains stationary and only the rotary axes are used to follow a particular circular path. The research concluded that, tracking speed of the double ball bar reflects the motion errors estimation quality. The servo mismatch of the two rotary axes was detected successfully (Lei and Hsu 2003). Later on, A National Aerospace Standard (NAS) proposed a scheme to test the machine’s final performance by machining a cone frustum (NAS979 standard). The exact location of the cone frustum in the
machine’s working envelop is not defined in the proposed method. Moreover, the influence of the machine errors on the geometric inaccuracy of the cone frustum is not covered. To understand this issue Uddin et al. proposed a simulator to analyze the effect of kinematic errors (inter-axis errors-relative location and orientation of the linear and rotary axes) on the machined cone frustum geometry. Kinematic model from (Tsutsumi and Saito 2004) was adapted and a similar error identification procedure is used. An error compensation model for the tool position and orientation is proposed to improve the machine tool’s performance. Hong et al. demonstrated the influence of the error motions of the rotary axes on the geometric accuracy of the cone frustum. The authors analyzed the sensitivity of the circularity error of the cone frustum to the position dependent geometric error parameters of the rotary axes. The authors concluded that, angular positioning error of the rotary axis (C-axis) and the augmentation of the radial or the tilt error motions of the B-axis have critical influence on the circularity. On the other hand, the gravity-induced Z-direction deformation of the rotary axis and the radial or the tilt error motion of the C-axis have less influence on the circularity of the machined cone frustum (Hong, Ibaraki et al. 2011).
Hong et al. (Hong, Ibaraki et al. 2012) signified how the error motions of the rotary table change depending on the tilting axis by demonstrating some intuitive and graphical presentation of R-test measurements considering insignificant contribution of linear axis error motions and separation of the linear axes squareness errors. For the systematic geometric error correction and compensation, Khan and Chen (Khan and Chen 2011) proposed an efficient methodology capable of compensating the overall effect of intra- and inter-axis error parameters. To remove the effect of the machine errors from the tool path, recursive compensation methodology is used and NC codes are generated by the developed post processing software from the modified tool path which is directly fed to the machine controller. The cutter location (CL) data is obtained through CAD/CAM software and the tool path is generated. The machine tool’s error information is used to generate a second cutter location data file. Later on, by defining the tool pose vector in the workpiece coordinate frame and the correction vector in the machine coordinate frame, the effect of machine tool’s errors are removed and a new output code is obtained.
Zhu et al. proposed a new error identification model including six error components errors of the rotary axes. The proposed model integrates the geometric error model, error identification and compensation altogether into a software system where the geometric error data are the prerequisite and obtained from laser interferometer and ball-bar measurements. Using CAD/CAM system, the tool path is generated and converted into NC code. Later on, the NC code for machining operation is modified based on the geometric error data. Finally the actual tool tip position and orientation is modified to reach the desired position in an iterative manner (Shaowei, Guofu et al. 2012). Aside from all these approaches to estimate the inter- and intra-axis error parameters, some approaches gain higher popularity and some of them are already practiced in industry. In the following subsections, some well-known indirect calibration techniques will be discussed.
2.3.3.1 The 3D probe-ball
3D probe-ball is proposed for error modeling (Lei and Hsu 2002) and error estimation (Lei and Hsu 2002) of five-axis machine tools. A 3D probe is installed in the machine spindle and a base plate is installed on the machine table, a central ball is connected with the probe by an extension bar used to make contact with the base plate to create a close kinematic chain (Figure 2-10). The probe-ball device adapted the idea of the double ball bar and the three-dimensional measuring probe to measure the deviation of the relative position between the probe and the base plate. The deviation of the probe to the base plate is used in an error model which includes 59 machine tool errors as well as the linear positioning errors. Different test paths are defined (Figure 2-11) to make sure that all the machine tool axes move simultaneously to estimate the error parameters included in the model. The error model can also estimate the constant link errors of the rotary axis, main spindle and tool holder.
Figure 2-10 3D probe-ball for five-axis machine tool’s accuracy test
Figure 2-11 Proposed test paths for the 3D probe-ball device (Lei and Hsu 2002)
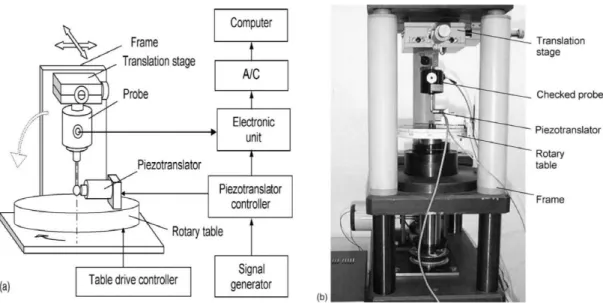
2.3.3.2 The R-test device
The R-rest device is developed by Weikert and Knapp to calibrate backlash, positioning, squareness and parallelism errors of the five-axis machine tools. In the proposed method, the
rotary axes are used in combination with the linear axes in order to achieve all the axes movements.
Figure 2-12 R-test device mounted on a five-axis machine tool (Weikert and Knapp 2004) Three analogous incremental probes are mounted on the workpiece side to measure the 3D displacement deviations of a ceramic sphere of 28 mm diameter mounted on the tool holder (Figure 2-12). A circular path of 130 mm is measured both in clockwise and counter-clockwise directions while the machine tool’s X-, Y- and C-axis move simultaneously. Z-axis displacement of 50 µm is used for both direction of motion and executed at 90 and at 630. The method is in principle, similar to the 3D probe ball (Lei and Hsu 2002). The R-test device takes 20 minutes to evaluate the location of the rotary C- and A-axis and 42 geometric errors are measured for a parallel kinematic machine tool. Figure 2-12 shows the functional prototype of the device (Weikert and Knapp 2004).
2.3.3.3 Ball plate artefact
A measuring device was introduced by Bringmann et al. that allows to measure three dimensional deviations of X-, Y- and Z-axis to compute the relevant machine errors (Bringmann, Kung et al. 2005). The device is composed of a 2D ball plate and is used to create a pseudo 3D artefact. The
vertical position of the ball plate can be altered by using spacer which is kinematically coupled with the base plate. The ball plate can directly be used on the base plate (Figure 2-13).
Figure 2-13 Ball plate artefact(left) and the measuring device (right) (Bringmann, Kung et al. 2005)
The ball plate consists of 6×6 array of aluminum sphere of 22 mm diameter. To measure the location of the spheres in the machine working volume, a measuring device composed of four one-dimensional analogous probes is used in a manner similar to the concept of the R-test device as described in (Weikert and Knapp 2004). The measuring device can compensate the direct 3D space error of three axis robots, machine tools and coordinate measuring machines without the involvement of any rotary axes. The measurement uncertainty is 5 µm in a working volume of 500 × 500 × 150 mm3.
2.3.3.4 Model based chase the ball
Model based calibration developed by Bringmann and Knapp required a single set up and the measurement method is similar to the 3D probe ball (Lei and Hsu 2002). A ceramic precision sphere mounted on the machine spindle represents the tool center position (TCP) (Figure 2-14) and its 3D deviations are measured. A calibration strategy is proposed. A suitable parameter set
is identified for the appropriate measuring poses. Mathematical stability of the model is assessed for the identified machine tool errors. The calibration quality is verified by a 3D circular test made with a double ball bar. Unidirectional mean diameter deviations for clockwise and counter clockwise direction are +106 µm/ 100 µm before calibration and -14 µm/ -19 µm after calibration. The Monte-Carlo method is used to simulate the calibration process, measurements and identification for 1000 error combinations. The tool center position deviations are calculated to verify the quality of the parameter set for 1000 runs. The average value found is 20 µm and for 95% it is below 32 µm (Bringmann and Knapp 2006).
Figure 2-14 Model Based “Chase-the-Ball” technique (Bringmann and Knapp 2006)
2.3.3.5 The CapBall device
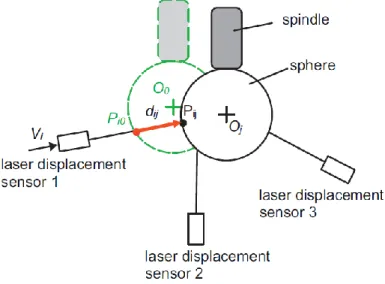
A non-contact measuring instrument called “CapBall” is proposed and used to measure machine tool’s volumetric error which is affected by the inter-axis errors (Zargarbashi and Mayer 2009). Figure 2-15 shows the “CapBall” instrument which consists of a sensing head equipped with
three capacitive sensors mounted on the tool holder and a precision ball of 19.05 mm diameter mounted on the machine table. The “CapBall” measures the relative position between the tool and the ball on the fly while all machine tool axes move simultaneously. A Jacobian matrix describing the sensitivity of the tool to workpiece position to the machine error parameters is used to extract the tool and workpiece setup errors as well as the inter-axis error parameters.
Figure 2-15 Functional prototype of the “CapBall” instrument (Zargarbashi and Mayer 2009) The effect of the setup errors is removed from the estimated inter-axis parameters and volumetric error. Using the estimated inter-axis errors, volumetric errors are predicted for different axes combinations which are not used for the parameter estimation process. The estimated machine model can predict 52-84% of the measured volumetric error (Zargarbashi and Mayer 2009).
2.3.3.6 RUMBA & SAMBA
Erkan and Mayer proposed an uncalibrated 3D artefact to analyse the volumetric error of five-axis machine tools. A model based approach is proposed to estimate the artefact geometry without the effect of the isotropic scale gain errors. A point to point cluster analysis of the measured and predicted artefact is carried out to validate the artefact estimation quality. The
authors recommended that, simultaneous estimation of probe and artefact setup errors along with the machine link errors provide better picture of the machine tool’s volumetric status (Erkan and Mayer 2010). Afterward, on-machine measurement of 3D Reconfigurable Uncalibrated Master Ball Artefact (RUMBA) was proposed to assess machine tool’s volumetric distortion.
Figure 2-16 A 3D Reconfigurable Uncalibrated Master Ball Artefact (RUMBA) probing (top). Ball center measurement (bottom) (Erkan, Mayer et al. 2011)
The proposed mathematical model successfully identified the setup errors and was included in the machine model to improve volumetric distortion prediction. Figure 2-16 shows the artefact with four master balls connected with stems of different heights and the location of these master balls are reconfigurable. Combinations of all machine axes are used to measure the master balls. Four points are probed diagonally on the equator and one point on the accessible pole to obtain the
center coordinates of the ball. Homogeneous transformation matrices are used to calculate the stylus tip positions with respect to the master ball centers. The artefact geometry is validated by CMM measurement of the ball center using distance method (Erkan, Mayer et al. 2011).
Later on, Mayer (Mayer 2012) proposed a method where RUMBA is enriched by a scale bar artefact as a reference length called Scale And Master Ball Artefact (SAMBA) to estimate the inter-axis errors and the axis positioning errors. 24 master balls of 12.7 mm diameter mounted on carbon fiber tubes along with a scale bar of 304.6686 mm are measured at 11 B- and C-rotary axis combinations to gather the necessary machine tool data for the estimation process (Figure 2-17). Seven B- and C-axis combinations are used to estimate the parameters and another four combinations are used to predict machine’s volumetric errors to assess the prediction capability of the proposed model. Author demonstrated that, the effectiveness of a thermally stable reference length measurement provides accurate picture of the positioning error of the linear axes and the importance of the data acquisition time vs. machine tool’s thermal state change to the parameter estimation.
Figure 2-17 SAMBA probing on a WCBXbZYT machine tool (left) and the estimated inter-axis error parameters (right) (Mayer 2012)
2.3.3.7 Test piece measurement
Ibaraki et al. proposed a set of machining test patterns to identify the kinematic errors. The relationship between the kinematic errors and the finished work piece geometry is formulated for five-axis machine tools. A total of 11 straight side cutting patterns is proposed to estimate eight