Journal of Applied Biosciences 119: 11888-11903
ISSN 1997-5902Agropedological characterization of the soils in the
region of Djebel El Ouahch, Constantine, Algeria
Lamia KEHAL, Md El Habib BENDERRADJILaboratory of Development and Valorisation of Phyto-Genetics Resources, Department of Biology and Ecology, University of Frères Mentouri Constantine, Algeria
Corresponding author : [email protected]
Original submitted in on 10th October 2017. Published online at www.m.elewa.org on 30th November 2017
https://dx.doi.org/10.4314/jab.v119i1.6 ABSTRACT
The region of Djebel El Ouahch is characterized by topography very rough, marked juxtaposition high plains, hills, depressions and sharp breaks of slopes, thus yielding a heterogeneous Site. The physicochemical characterization of three soil classes representing the region of Djebel El Ouahch (three depths0-40 cm and 40-80 cm and80-120 cm)allowed to put in evidence the domination of the clay fraction in vertisols and soil calcimagnesic while are the sand and silt that dominate the soil isohumic.In all three types of soils mentioned above the organic matter present low levels of. The capacity of cation exchange is highly related at the mineral fraction and so those are clays who determining the amount of bases exchangeable in soil. The average value of pH (7-7, 4) is the tree type of soil is among the soil neutral to slightly basic. The soil calcimagnesic show the contents of total limestone high compared the vertisols and the soil isohumic. For the majority of the soils studied, contents of Nitrogen and phosphates are relatively important in surface compared in depth.
Keywords : Djebel El Ouahch, Algeria, physicochemical, vertisols, soil calcimagnesic, soil isohumic. INTRODUCTION
The agricultural sector plays an important role in the growth of the Algerian economy. Indeed, it constitutes a strong support for the development of the country since it represents up to 20% of the gross domestic product and employs about 40% of the active population. (1976) In Algeria, several types of soil that have developed on different geological substrates and in various climatic, topographic and biotic contexts. In the Djebel El Ouahch massif in Constantine, which is the subject of this study, the main types of soils are calcimagnic soils, most predominant (63%), isohumic soils (15%) and vertisols (11%). C.U.R.E.R.(1975). Geographical location of the study area: The region covered by this study
corresponds to the Jebel El Ouahch region, Northeast of the town of Constantine, covers an area of 66,535 ha. It is included between 36°14'20,19 "and 36°33'55,81" north latitude and between 6°38'0,82 "and 6°58'37,65" East of longitude, this massif is part of the series of small chains known as Numidiennes or Constantine (BOUDY, 1955), deforestation, fires and pastoral overload caused the degradation of the forest is individualized limestone mountains surrounding by their blunted appearance under the effect of a very significant erosive action that a sandy and weak substratum has strongly favoured. It is an area that is located straddling two floors bioclimatic; the semi-arid stage (500-600 mm/year), the
south-eastern semi-arid zone corresponds to the great erosion glaze of the El Haria depression, essential agricultural land; the municipality of Ain Abid in the south, the commune of Didouche Mourade and Zighoud in the north, and Constantine in the west, the middle of the north, mountainous "1100 to
1300m" of altitude belongs to the subhumid stage, here corresponds to the region of cork oak, homogeneous region from edaphic point of view (Numidian sandstone) and forest (ANONYMOUS, 1977).
Map 1: Geographical location of the study area
MATERIALS AND METHODS
Sampling: The sampling adopted in this study consists of exploiting the main soils that characterize Djebel El
Ouahch (calcimagnesic soils, isohumic soils and vertisols). Each type of soil is represented by three
representative profiles of the studied area. The choice of these profiles was based on the geomorphological and topological map along a toposequence of the Jebel El Ouahch region (Table 1). In each profile, the samples were taken at three depths (0-40cm and 40-80cm and 80-120cm). The choice of these depths is dictated by the fact that they are the parts of the soil where the roots thrive by fixing the plant on its support and feeding it in different factors of plant growth: heat, water, all trace elements ; it is also there, where the notion of the fertility of a soil is well connected.
Physico-chemical analyzes: The physico-chemical characteristics of the studied soils were determined using the following techniques: Mathieu C., Pieltain F (2003). - Granulometry: carried out with the Robinson pipette, after destruction of organic matter with hydrogen peroxide, total limestone with 1N sodium acetate, dispersion with sodium hexametphosphate. - pH "water": measured at pH-meter on a soil / water
solution at 1 / 2.5. - Organic matter quantified by the Walkley-Black method. - Total limestone: determined by
Bernard's calcimeter, after attack HCL 6N.
Exchangeable bases: saturation with a solution of 1N ammonium acetate adjusted to pH = 7. The cations were assayed by atomic absorption and flame photometer. - Cation exchange capacity (CEC): determined by the sodium acetate method. - Total nitrogen: determined by concentrated sulphuric acid. Total phosphorus: determined using 0.5M sodium bicarbonate (NaHCO3) at pH: 8.5. - Moisture: determined by the difference between the weights of the soil dried in ambient air and heated to 105 ° C. - Calculation of the Pearson correlation coefficients: For all studied soils, two Pearson correlation coefficients were determined: one between the CEC and the percentage of clay and the other between the CEC and the percentage of the organic material.
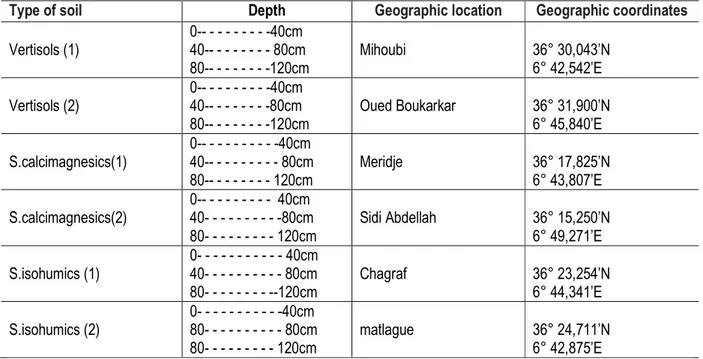
Table 1: Geographical situations and colours of the studied soils
Type of soil Depth Geographic location Geographic coordinates
Vertisols (1) 0-- - - -40cm 40-- - - 80cm 80-- - - -120cm Mihoubi 36° 30,043’N 6° 42,542’E Vertisols (2) 0-- - - -40cm 40-- - - -80cm 80-- - - -120cm Oued Boukarkar 36° 31,900’N 6° 45,840’E S.calcimagnesics(1) 0-- - - -40cm 40-- - - 80cm 80-- - - 120cm Meridje 36° 17,825’N 6° 43,807’E S.calcimagnesics(2) 0-- - - 40cm 40- - - -80cm 80- - - 120cm Sidi Abdellah 36° 15,250’N 6° 49,271’E S.isohumics (1) 0- - - 40cm 40- - - 80cm 80- - - --120cm Chagraf 36° 23,254’N 6° 44,341’E S.isohumics (2) 0- - - -40cm 80- - - 80cm 80- - - 120cm matlague 36° 24,711’N 6° 42,875’E
The soil samples taken are dried in air, crushed and screened at 2 mm. Statistical analysis the statistical analysis: was
carried out using Software R (Core Team, 2014). The data were analyzed using the analysis of the variance and the comparison of the means was made by the test of Tukey, Lafaye de Micheaux P., Drouilhet R., Liquet B (2011). The test was applied at a probability level of p = 0.05 to find significant differences between the means. These analyzes were carried out in order to compare
the average characteristics of the three soil types studied. This comparison was made, on the one hand, without distinction between the two depths and, on the other hand, separately for each of the two depths. To do this, the descriptive analysis of the different characteristics that was carried out in this study is as follows: mean, standard deviation and median and analysis of variance.
RESULTS AND DISCUSSION
Physical constituents of the studied: soils the particle size analysis (Table 2) shows the dominance of the clay fraction in the vertisols and the calcimagnesic soils, while the less evolved soils are enriched in silt and sands. From a quantitative point of view, vertisols
are the richest in surface clay fraction (55% and 70%) and in depth (35% and 47%). Soils with little development have the lowest proportion of surface clays (10% and 20%) and depth (4% and 17%).
Table 2: Physical constituents of the three soil types studied.
Type of soil Depths Granulometry (%)
Clays Silts Sands
Vertisols (1) 0-- - - 40 cm 70 20 10 40-- - - 80 cm 50 22 28 80--- - - 120 cm 47 33 19 Vertisols (2) 0-- - - 40 cm 55 40 5 40-- - - 80 cm 70 25 5 80-- - - - 120 cm 35 55 10 S. calcimagnesics(1) 0-- - - 40 cm 62 32 6 40-- - - 80 cm 61 32 7 80-- - - 120 cm 43 24 33 S. calcimagnesics (2) 0-- - - 40 cm 64 21 15 40-- - - 80 cm 65 20 15 80-- - - 120 cm 58 25 17 Soil isohumics (1) 0-- - - 40 cm 10 53 38 40-- - - 80 cm 7 45 48 80-- - - 120 cm 4 53 43 Soil isohumics (2) 0-- - - 40 cm 20 71 9 40-- - - 80 cm 23 56 21 80-- - - 120 cm 17 80 3
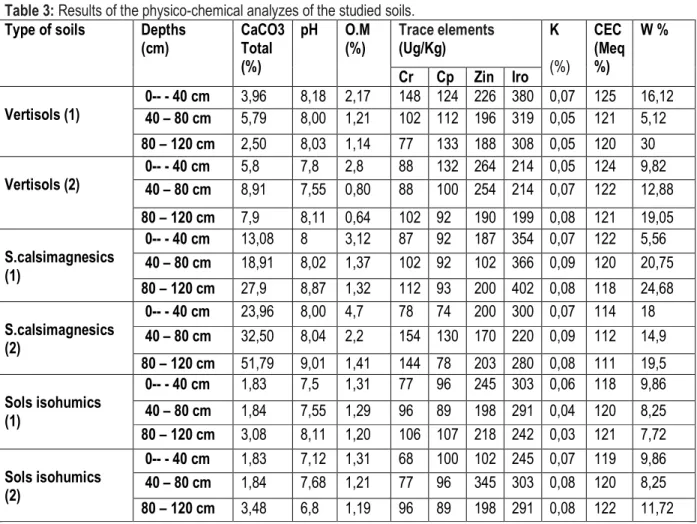
Physical-chemical characterization of soils: The results for total limestone, pH, organic matter, and
cation exchange capacity (CEC) and trace elements and potassium and moisture are shown in Table 3.
Table 3: Results of the physico-chemical analyzes of the studied soils.
Type of soils Depths (cm) CaCO3 Total (%) pH O.M (%) Trace elements (Ug/Kg) K (%) CEC (Meq %) W % Cr Cp Zin Iro Vertisols (1) 0-- - 40 cm 3,96 8,18 2,17 148 124 226 380 0,07 125 16,12 40 – 80 cm 5,79 8,00 1,21 102 112 196 319 0,05 121 5,12 80 – 120 cm 2,50 8,03 1,14 77 133 188 308 0,05 120 30 Vertisols (2) 0-- - 40 cm 5,8 7,8 2,8 88 132 264 214 0,05 124 9,82 40 – 80 cm 8,91 7,55 0,80 88 100 254 214 0,07 122 12,88 80 – 120 cm 7,9 8,11 0,64 102 92 190 199 0,08 121 19,05 S.calsimagnesics (1) 0-- - 40 cm 13,08 8 3,12 87 92 187 354 0,07 122 5,56 40 – 80 cm 18,91 8,02 1,37 102 92 102 366 0,09 120 20,75 80 – 120 cm 27,9 8,87 1,32 112 93 200 402 0,08 118 24,68 S.calsimagnesics (2) 0-- - 40 cm 23,96 8,00 4,7 78 74 200 300 0,07 114 18 40 – 80 cm 32,50 8,04 2,2 154 130 170 220 0,09 112 14,9 80 – 120 cm 51,79 9,01 1,41 144 78 203 280 0,08 111 19,5 Sols isohumics (1) 0-- - 40 cm 1,83 7,5 1,31 77 96 245 303 0,06 118 9,86 40 – 80 cm 1,84 7,55 1,29 96 89 198 291 0,04 120 8,25 80 – 120 cm 3,08 8,11 1,20 106 107 218 242 0,03 121 7,72 Sols isohumics (2) 0-- - 40 cm 1,83 7,12 1,31 68 100 102 245 0,07 119 9,86 40 – 80 cm 1,84 7,68 1,21 77 96 345 303 0,08 120 8,25 80 – 120 cm 3,48 6,8 1,19 96 89 198 291 0,08 122 11,72
Total limestone and pH: The calcimagnesic soils have high levels of total limestone compared to vertisols and isohumic soils (Table 3, Figure 2). The latter are decarbonated on all their thicknesses. The pH
in the water of the studied soils (Table 3) varies between 7.46 for isohumic soils and 8.30 for calcimagnesic soils.
Vertisols soil calcimagenics soil isohumics
Figure 2: Soil distribution as a function of CaCO3 content. Organic matter: the organic matter content of the surface horizons of the profiles studied varies between 1.46%, 1.25% and 2.35% (Table 3, Figure 3), these
contents are higher than those of the horizons of depth (beyond 30cm).
Vertisols sols calcimagenics sols isohumics
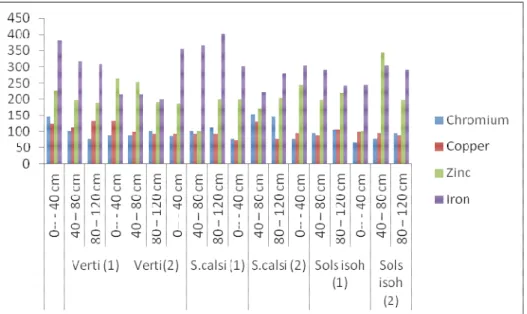
Fig 3: Distribution of soils according to their organic matter content The oligoelements : iron is the most dominant
element; it accounts for 70% to 80% of trace elements
in all soils (Table 3, Figure 4). Despite their decarbonation, vertisols and isohumic soils have high
iron content. Zinc levels are relatively high; the latter element has no desaturation. Despite its importance for the majority of plants, iron shows low grades in all soils.
The copper contents are very low; in excess, this latter element becomes harmful.
Figure 4: Distribution of soils according to their oligoelements content
Potassium: Despite its importance for the majority of plants, potassium shows low levels in all soils
Vertisols sols calcimagenics sols isohumics
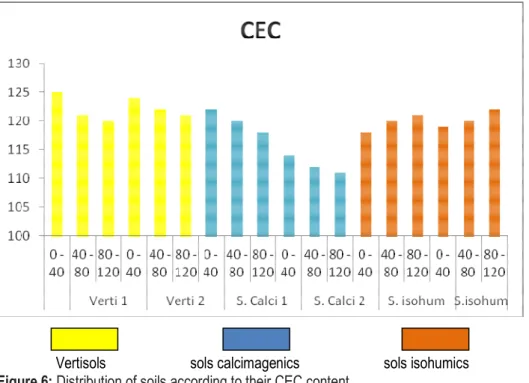
Figure 5: Soil distribution according to potassium content. CEC (cation exchange capacity): In general, CEC is relatively high in vertisols (Table 3, Figure 6); it is of the order of 125meq / 100g to 124 meq / 100g on the surface and 120 meq / 100g to 122meq / 100g in depth.
In calcimagnesic soils, CEC ranges from 122 meq / 100g to 114 meq / 100g on the surface, these values fall deeply to reach values of 118meq / 100g and 111meq / 100g. This suggests that there is a
differentiation in the mineralogical proportions of clay between the surface and the depth; this decline in CEC along the profile can be explained by the fall in K + concentrations from the surface to the underlying
horizon. In isohumic soils, the CEC is low. It is of the order of 118meq / 100g to 119meq / 100g on the surface and 121meq / 100g to 122meq / 100g in depth.
Vertisols sols calcimagenics sols isohumics
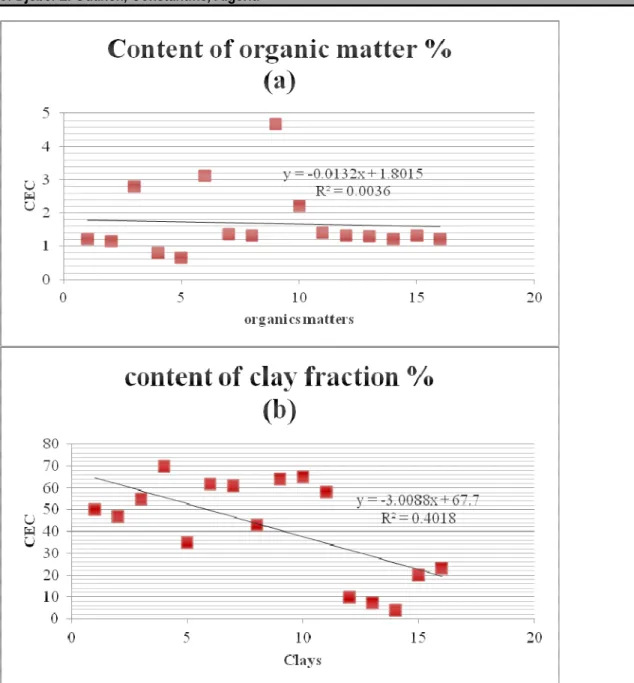
Figure 6: Distribution of soils according to their CEC content. Theoretically, CEC is a parameter that would depend on both the clay fraction and the organic matter. For this purpose, two Pearson correlation coefficients were determined for all studied soils: one between the CEC and the percentage of organic matter (Figure 6a) and the other between the CEC and the percentage of clay (Figure 6b). The coefficients of determination obtained
show that the clay fraction explains 40% of the variation of the CEC whereas the organic matter explains only 3% of the variation of the CEC. Thus, the quantity of exchangeable bases in these soils is determined chiefly by clays;therefore , the CEC depends mainly on the mineral fraction.
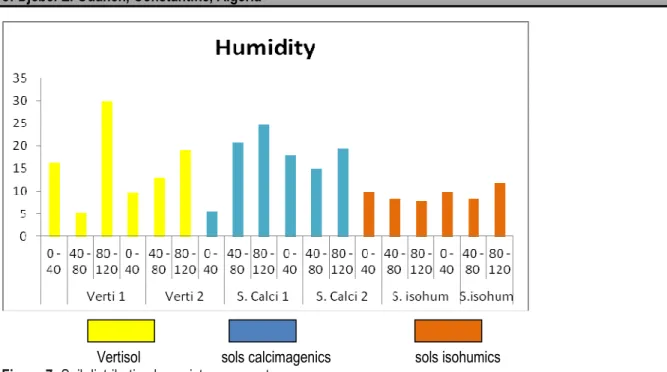
Figure 6: Relationship between organic matter content and CEC (a) and between clay content and CEC (b). Humidity: Vertisols are the moistest followed by
calcimagnesic soils, while the isohumic soils are the
driest (Table 3, Figure 7); the deep horizons of the vertisols are the most plastic and the most malleable
Vertisol sols calcimagenics sols isohumics
Figure 7: Soil distribution by moisture percentage Total nitrogen and phosphorus : Aside from vertisol (2) and calcimagnesic soil (1), nitrogen levels in vertisol (1), calcimagnesic soil (2) and isohumic soils are relatively large in surface area and depth (Table 4) . As for phosphates (Table 4), vertisol (1) shows the highest
contents at the surface (0.061%) and at the depth (80.33%). Apart from the two calcimagnesics, it can be noted that in the other two types of soils (calcimagnesic and isohumic), the total phosphorus concentration increases from surface to depth.
Table 4: results of total nitrogen and phosphorus
Type of soils Depths
(cm) Nitrogen (%) Phosphorus (%) Vertisols (1) 0 -- - - 40 cm 0,11 0,061 0 -- - - 80 cm 0,033 0,054 0 -- - - -120 cm 0,021 0,33 Vertisols (2) 0 -- - - 40 cm 0,033 0,053 0 -- - - ---- 80 cm 0,011 0,072 0 -- - - -120 cm 0,007 0,084 S.calcimagnesics (1) 0 -- - - 40 cm 0,134 0,052 0 -- - - 80 cm 0,071 0,05 0 -- - - -120 cm 0,063 0,011 S.calcimagnesics (2) 0 -- - - 40 cm 0,072 0,063 0 -- - - 80 cm 0,071 0,099 0 -- - - -120 cm 0,063 0,016 S.isohumics (1) 0 -- - - 40 cm 0,053 0,011 0 -- - - 80 cm 0,07 0,012 0 -- - - -120 cm 0,019 0,063 S.isohumics (2) 0 -- - - 40 cm 0,099 0,019 0 -- - - 80 cm 0,064 0,016 0 -- - - -120 cm 0,053 0,07
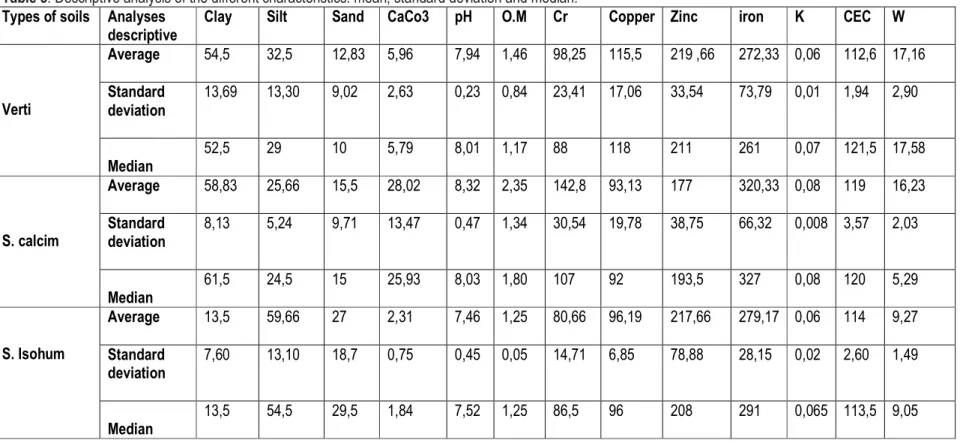
Table 5: Descriptive analysis of the different characteristics: mean, standard deviation and median.
Types of soils Analyses descriptive
Clay Silt Sand CaCo3 pH O.M Cr Copper Zinc iron K CEC W
Verti Average 54,5 32,5 12,83 5,96 7,94 1,46 98,25 115,5 219 ,66 272,33 0,06 112,6 17,16 Standard deviation 13,69 13,30 9,02 2,63 0,23 0,84 23,41 17,06 33,54 73,79 0,01 1,94 2,90 Median 52,5 29 10 5,79 8,01 1,17 88 118 211 261 0,07 121,5 17,58 S. calcim Average 58,83 25,66 15,5 28,02 8,32 2,35 142,8 93,13 177 320,33 0,08 119 16,23 Standard deviation 8,13 5,24 9,71 13,47 0,47 1,34 30,54 19,78 38,75 66,32 0,008 3,57 2,03 Median 61,5 24,5 15 25,93 8,03 1,80 107 92 193,5 327 0,08 120 5,29 S. Isohum Average 13,5 59,66 27 2,31 7,46 1,25 80,66 96,19 217,66 279,17 0,06 114 9,27 Standard deviation 7,60 13,10 18,7 0,75 0,45 0,05 14,71 6,85 78,88 28,15 0,02 2,60 1,49 Median 13,5 54,5 29,5 1,84 7,52 1,25 86,5 96 208 291 0,065 113,5 9,05
The mean is the sum of the values of the variable divided by the number of individuals. The median is a number that divides the population into two parts so that each part contains the same number of values. The average has a big defect: it is very sensitive to extreme values. The median is an indicator that does not pay attention to extreme values. Therefore, it is used in addition to the average. The standard deviation is the measure of dispersion most commonly used in statistics. It measures the dispersion around the mean. The standard deviation is influenced by the extreme values; only one of these values could have a large influence on the results of the standard deviation. For vertisols, and with respect to the mean of all variables, the standard deviation is smaller. The dispersion of measures around the mean is narrower. The results are therefore more consistent. For calcimagnetic soils The standard deviation is influenced by the extreme values in total limestone and iron; these values could have a large influence on the results of the standard deviation. However, the higher the heterogeneity of the scores, the higher the standard deviation will be. Conversely, in the other variables where the scores are relatively close
to the mean, the standard deviation is smaller. For isohumic soils, it is in zinc and iron where the standard deviation represents how far the scores are from the mean, whereas in the other variables, the standard deviation is small and the values are close to the
average (D. Touhtouh and al.2014)
Analysis of the variance to compare the average characteristics of the three soil types (without distinction between the two depths). The application of ANOVA using the Tukey test to compare the average characteristics of the three soil types and without distinction between the three depths is presented in Table 6. The latter shows that in the three types of soils, the mean difference is not significant for the parameters pH, MO, PO4, NO3, and K; it is also not significant at first between the vertisols and the calcimagnesic soils for the silt and sand variables, then between the vertisols and the isohumic soils for the total limestone, and finally between the calcimagnesic soils and the isohumic soils for the chromium variables copper zinc and iron. While for, clays, CEC, and moisture, the mean difference is significant between the three soil types.
Table 6: Application of the ANOVA (Tukey test) to compare the average characteristics of the 3 soil types without distinction between the three depths.
Type of soils Clay Silt Sand Ca
Co3
O.M pH PO4 N CEC Chromium Copper Zinc iron K W
Vertisols 54,5 a* 32,6 a 12,83a 5,95 b 1,46 a 7,94 a
0,109a 0,019a 112,6a 93,25a 115,5a 219,6a 272,3a 0,06a 17,1a
S.calcimagnesics 58,5 a* 25,66 a 15,6 a 28,02a 2,35a 8,32 a
0,047a 0,079a 119 a 142,8b 93,13b 177b 320,3b 0,08a 16,2a
S. isohumIcs 13,5 b* 59,66 b 27 b 2,31 b 1,25 a 7,46 a
0,03 a 0,05 a 114 a 80,66a 96,19b 217,2a 279,1a 0,06a 9,2 b
* (a, b, ab and c: alphabetical outputs of the Tukey test).
Tables 7: Application of the ANOVA (Tukey test) to compare the average characteristics of the three soil types separately for each of the three depths (0 - 40 cm and 40 - 80 cm and 80 - 120 cm).
Depth 0 – 40 cm
Types of soils Clay Silt Sand Ca Co3 O.M pH PO4 N CEC Cr Copper Zinc iron K W
Vertisols 62,5a* 30a* 7,5a* 4,88a 2,48a 7,99a 0,057a 0,07a 124,5a 118a 128a 245a 297a 0,06a 12,9a
S. calcimagnesics 63a 26,5a 10,5a 18,52b 3,91a 8a 0,057a 0,103a 118a 87,5b 183a 193,5b 327b 0,07a 14,8a
S. isohumicss 15b 62b 23,5b 1,83a 1,31a 7,15a 0,076a 0,076a 118.5a 72,5b 98b 173,5b 274a 0,065a 9,8b
Depth 40 – 80 cm
Types of soils Clay Silt Sand Ca Co3 O.M pH PO4 NO2 CEC Cr Copper Zinc iron K W
Vertisols 60 a* 23,5 a 16,5a 7,3 b 1 a 7,77a 0,063a 0,022a 121,5a 95 a 106a 225a
256,5a 0,06a 9 a
S. isohumics 15 b* 50,5 a 34,5b 1,82 b 1,25a 7,4a 0,094a 0,067a 120a 86,5a 92,5a 276a 297 a 0,06 a 8,25 a Depth 80 – 120 cm
Types of soils Clay Silt Sand Ca Co3 O.M pH PO4 N CEC Cr copper Zinc iron K W
Vertisols 41a* 44 b 14,5b 5,2b 0,89a 8,07a 0,20a 0,014a 120,5a 89,5a 112,5a 189a 253,5a 0,065 24,52a
S. calcimagnesics 50,5a* 24,5a 25a 39,84a 1,36a 8,94a 0,013a 0,063a 114,5b 128b 85,5b 201,5b 341b 0,08 22,09a
S. isohumics 10,5b* 66,5b 23a 3,28b 1,19a 7,45a 0,036a 0,036a 121,5a 101b 98b 208b 266,5a 0,055 9,72b
From a granulometric point of view, the vertisols have a clay texture. The clay is distributed evenly throughout the profile. The calcimagnesic soils show a higher clay content at the surface and appear to decrease with the increase of the limestone level at depth. In isohumic soils developed on sands and silt, the texture is very liminous-sandy, with a slight increase of the clays in the deep horizon. With the exception of liminous-sandy soils, the structure is generally lumpy on the surface. In depth, it is polyhedral and becomes prismatic when the texture is clayey. In general, the structure is well developed and stable and gives the soils of the region good resistance to certain factors of degradation. The studied soils are rarely totally decarbonated, and at least some traces of free carbonate are detected at one level or the other of the profile. Vertisols and isohumic soils show low levels of total limestone. The calcimagnesic soils have a high limestone content; we observe the presence of a calcareous crusting, as has been pointed out by other authors Vila.J.M. (1980). The average pH value (7.74) places these soils among neutral to slightly basic soils; this shows that these soils remain influenced by limestone. Examination of the distribution of organic matter with depth shows that all soils are impregnated with humus throughout their thickness except in the deep horizon of isohumic soils. For vertisols and isohumic soil, organic matter content decreases progressively and steadily with depth, whereas for isohumic soils and calcimagnesic soils, the decrease in organic matter is sharp from surface to horizon -jacent. Oligoelements, which act as soil fertilizers, also play an essential role in the development of the plant, the maintenance of biological activity and the structuring of soil Duchauffour P. (2001). Iron and zinc are generally in sufficient quantity to satisfy the needs of plants; the absorbent complex is substantially saturated with these alkaline earths. Copper is not essential to plants; in excess, it becomes harmful. The potassium essential to the life of the plant is often present in clay soils; on the other hand, it shows deficiencies in the deep horizons of sandy soils. Despite the low organic matter content, which rarely
exceeds 1.5% in surface area and falls to depth, it is the clay fraction that behaves as the main agent in the construction of the soil structure and as a plant nutrition. In agreement with certain authors Duchauffour P (1997), Calvet R. (2003) the clay minerals available to vertisols and calcimagnesic soils allow water to penetrate easily between their leaves and create important water reserves in the soil good nutrition of plants. While clays of isohumic soils are unable to fix water between their leaves. Nitrogen is available for plants, it is activated in well-ventilated soils, non-acid, and rich in calcium, as is the case with soils studied. For phosphorus, the form is represented by the exchangeable ions (PO43-), absorbed by the anionic complex; it is mobilized progressively. The availability of phosphorus is closely related to the nature and condition of the absorbent Duchauffour P (1997). In our case, it is low in vertisols and calcimagnesic soils, which have high clay contents; whereas this availability is important in the soil isohumic and which has a low content of clay fraction. The analysis of variance to compare the average characteristics of the three soil types and without distinction between the three depths showed that in the three soil types the difference in mean is significant only for clays, CEC, Ca, and moisture, whereas this difference is not significant for pH, MO, PO4, N, and K. The application of ANOVA, using the Tukey test to compare the average characteristics of the three soil types separately for each two depths (0 - 40cm and 40 - 80cm and 80 - 120cm) showed that in the surface horizon, the mean difference is significant only for the Zinc, and this in the three types of soils; whereas the isohumic soils are the least moist and the richest in sand, while only the calcimagnesic soils are characterized by a high total limestone content. In the deep horizon, and in the three soil types, the mean difference is significant for clays and calcium; vertisols are individualized by the presence of soil fertilizer oligoelements, the calcimagnesic soils have the highest CaCO3 content; and isohumic soils are characterized by the highest levels of sand and silt.
CONCLUSION
The massif of Djebel El Ouahch is one of the great agricultural regions of the east Constantine. It is characterized by three main types of soils (Vertisols, calcimagnesic soils and isohumic soils) Y. Boulfelfel (1977). In this work, we carried out a comparative study of the physicochemical characteristics of these three soil classes. In vertisols, clays, which are dominant, are
distributed regularly over the whole profile, with a slight increase in depth; the clay fraction is more abundant at the surface and appears to rise with the increase of limestone in depth. The isohumic soils developed on sands and silt by a different textural profile with a slight increase in the clay fraction and a dominance of sands and silt along the profile. For all soils, the structure is
generally lumpy on the surface; it becomes prismatic when the texture is clayey. In general, all three types of soil have a balanced texture to clay and a well-developed, stable structure that provides good resistance to degradation and contributes to satisfactory drainage. From a chemical point of view, the clay-humic complex of vertisols and calcimagnesic is saturated with oligomers and mainly zinc and iron;
this is justified by the presence of a clay mineralogical unit , which actively acts in the fertilization of the soil. Despite the presence of a low content of organic matter, it is the mineral matter, which intervenes essentially in the cation exchanges. So the fertility of the soils and the reasoning of their fertilization are attributed to the quantity and nature of the clays present in the soils.
ACKNOWLEDGEMENTS
This work was supported by the Forest Conservation Department. We thank Mr. Houssine Majdoub, Mr. Mohamed Saighi, and Mr. Bouzide Mesbahi for their
valuable assistance during the fieldwork. We are also grateful to anonymous reviewers for their comments and constructive criticisms.
REFERENCES
Anonymous, report of the activity of Ardenne and Gaume during the exercise. 177-182p. (1977). Boudy.P., African economy. Tom IV. Forest description of Algeria and Tunisia. Paris: Larose. 481p. (1955).
Boulfelfel.Y. Integrated Development of Djebel El Ouahch, (1975).
Calvet R. Soil, properties and functions. Tome 1. Constitution and structure, phenomena at the interfaces. Paris-Grignon. 456 p. (2003). C.U.R.E.R. soil study - Constantine (1975).
D. Tahtouh et al. Physicochemical properties of three types of soils of Sais, Morocco. 1524-1534p. (2014)
Duchauffour P. Pedology abstract. Soil, vegetation, environment. 5th Edition. MASSON. 291p. (1997).
Duchauffour P. Introduction to soil science. Ground. Vegetation, environment. 6th edition of the abstract of pedology. DUNOD. 331P. (2001). Mathieu C., Pieltain F. Chemical analysis of soils.
Methods chosen. TEC & DOC. 387p. (2003). Lafaye de Micheaux P., Drouilhet R., Liquet B. The
software R. Mastering the language. Conduct statistical analyzes. Springer-Verlag. 488p. (2011).
Rivier.F, the objective of the intensification of Algerian agriculture thesis of 3 rd cycle .(1976). Vila.J.M. . The Alpine plain of eastern Algeria and its
Algerian-Tunisian confines. Ph.D. University of