DOI 10.1007/s00382-016-3016-8
West African monsoon intraseasonal activity and its daily
precipitation indices in regional climate models: diagnostics
and challenges
E. D. Poan1 · P. Gachon1 · G. Dueymes1 · E. Diaconescu1,2 · R. Laprise1 · I. Seidou Sanda3
Received: 11 June 2015 / Accepted: 28 January 2016 / Published online: 18 February 2016 © The Author(s) 2016. This article is published with open access at Springerlink.com
effects of the African Easterly Waves and the associated mesoscale convective systems are substantially underes-timated, especially over continental regions. Finally, the study investigates the skill of the models with respect to hydro-climatic indices related to the occurrence, intensity and frequency of precipitation events at the intraseasonal scale. Although most of these indices are generally bet-ter reproduced with RCMs than reanalysis products, this study indicates that RCMs still need to be improved (espe-cially with respect to their subgrid-scale parameterization schemes) to be able to reproduce the intraseasonal vari-ance spectrum adequately.
Keywords West African monsoon · Regional climate
modeling · Intraseasonal variability · Precipitation indices 1 Introduction
More than three hundred million people live in West Africa and this population is expected to double in the next two decades. The economy of West Africa is mainly based on the rain-fed agricultural and pastoral sectors, so West Africans and, more specifically, the people of the Sahel, are strongly dependent on the four-month rainfall season that generally occurs between June and September. This dependence seems to have been exacerbated recently, prob-ably due, at least partly, to climate variability and change: local surveys and reports indicate concerns about a later monsoon onset, increasingly severe dry spells and flash floods, destruction of biodiversity, etc. (e.g. IPCC 2013, 2014).
Recognition of the vital role of the West African mon-soon (WAM) has led to some international multidiscipli-nary research projects in recent years, such as AMMA
Abstract The West African monsoon intraseasonal
vari-ability has huge socio-economic impacts on local popu-lations but understanding and predicting it still remains a challenge for the weather prediction and climate scientific community. This paper analyses an ensemble of simula-tions from six regional climate models (RCMs) taking part in the coordinated regional downscaling experiment, the ECMWF ERA-Interim reanalysis (ERAI) and three satellite-based and observationally-constrained daily pre-cipitation datasets, to assess the performance of the RCMs with regard to the intraseasonal variability. A joint analy-sis of seasonal-mean precipitation and the total column water vapor (also called precipitable water—PW) suggests the existence of important links at different timescales between these two variables over the Sahel and highlights the relevance of using PW to follow the monsoon seasonal cycle. RCMs that fail to represent the seasonal-mean posi-tion and amplitude of the meridional gradient of PW show the largest discrepancies with respect to seasonal-mean observed precipitation. For both ERAI and RCMs, spec-tral decompositions of daily PW as well as rainfall show an overestimation of low-frequency activity (at timescales longer than 10 days) at the expense of the synoptic (time-scales shorter than 10 days) activity. Consequently, the
* E. D. Poan
1 Centre pour l’Étude et la Simulation du climat à l’Échelle Régionale (ESCER), Dép. des sciences de la Terre et de l’atmosphère, Université du Québec à Montréal (UQAM), PO Box 8888, Stn. Downtown, Montreal, QC H3C 3P8, Canada
2 Centre Eau Terre Environnement, Institut national de la recherche scientifique (INRS), Quebec, QC, Canada 3 AGRHYMET Regional Centre, Niamey, Niger
(African Monsoon Multidisciplinary Analysis; Redelsper-ger et al. 2002), THORPEX-AFRICA (THe Observing sys-tem Research and Predictability EXperiment; Shapiro and Thorpe 2004), WAMME (West African monsoon modeling and evaluation; Druyan et al. 2010), IRIACC/FACE (Inter-national Research Initiative on Adaptation to Climate Change/Faire face Aux Changements Ensemble; http:// face.ete.inrs.ca/). A major objective of these initiatives was to understand the physical mechanisms involved in the WAM variability at different spatial and temporal scales and thus to improve the numerical models used for weather prediction and for climate projections. Special attention has been devoted to the intraseasonal1 scales that affect day-to-day life and economic activities more directly. Three main intraseasonal scales of variability have been studied: (1) the 30–90-day scale, which is an MJO- (Madden and Julian Oscillation; Madden and Julian 1971) like activity (Janicot et al. 2009), (2) the 10–25-day scale (Sultan et al. 2003) involving atmosphere–ocean interactions, and (3) the 1–10-day scale, which is driven by meteorological events occur-ring at synoptic scale to mesoscale, such as the African Easterly Waves (AEWs; Kiladis et al. 2006) and Mesoscale Convective Systems (MCSs; Mathon et al. 2002), respectively.
Short-term weather forecasting and future projection of the WAM intraseasonal activity are a huge challenge for the scientific community (Hourdin et al. 2010) because of the complexity of the dynamical and physical processes of the WAM. Roehrig et al. (2013) pointed out the poor suit-ability of coarse-mesh Global Climate Models (GCMs) for handling the intraseasonal and meteorological scales over-all. Yet, Mathon et al. (2002) highlighted the importance of the meteorological events over the Sahel: about 80 % of the annual rainfall is brought by a relatively small number of MCSs, mainly associated with AEWs through complex physical processes (Cornforth et al. 2009). The representa-tion of such scales requires a more precise descriprepresenta-tion of the physical processes related to surface conditions over land and ocean, the boundary layer, clouds, and also radia-tion and convecradia-tion (e.g. see Taylor et al. 2011; Guichard et al. 2009). Therefore, more sophisticated models involv-ing finer resolution and more detailed parameterization (e.g. McCrary et al. 2014) need to be designed for this particular WAM region. Regional modeling is one of these tools and it is expected to provide a better representation of the local or regional weather events than can be obtained from coarse-mesh modeling (Gallée et al. 2004; Paeth et al. 2005), thus offering a way to develop applications for adaptation to and mitigation of specifically severe weather
1 Intraseasonal scale activity refers to phenomena occurring in a time period encompassing 1 to 90 days during any given year.
events. For example, Oettli et al. (2011) investigated the perspective of using Regional Climate Models (RCMs) for crop-yield prediction and highlighted a promising result with the RCM ensemble prediction approach. Crétat et al. (2013) assessed the representation of the monsoon physics during intense rainfall events and showed the significant added value of RCMs in comparison with GCMs.
In line with these ideas, the Coordinated Regional Downscaling Experiments (CORDEX, Giorgi et al. 2009) project is one of the leading endeavors aiming to provide a complete and homogeneous dataset describing the recent past and the future of the WAM region. From these simu-lations, Nikulin et al. (2012) and Gbobaniyi et al. (2013) have shown, for time scales ranging from interannual to seasonal, an added value of RCMs when they are driven by ERA-Interim reanalysis (ERAI; Dee et al. 2011) rather than by coarse-mesh driving boundary conditions.
Fewer studies have targeted the ability of RCMs to reproduce the monsoon intraseasonal events such as rain-fall onset and retreat, AEW intermittency, or the precipita-tion diurnal cycle. Druyan et al. (2010) have shown that reanalysis-driven RCMs are much more realistic (relatively to GCM-driven) in representing the African monsoon dynamics, such as the structure of the African Easterly Jet (AEJ), the low-level circulation and, hence, the humidity and heat transport. Sylla et al. (2010) have investigated the intraseasonal variability of the WAM using RegCM32 (Regional Climate Model version 3). They demonstrated the model’s ability to represent the WAM dynamics and, more specifically, the AEWs and their related AEJ. Even though this study showed the high potential of RegCM3 to handle very subtle interactions between the AEWs and the AEJ, it was quite limited in terms of quantitative evidence, such as the extent to which this synoptic-scale activity determines the monsoon precipitation. The recent studies by Gbobaniyi et al. (2013), Diallo et al. (2014) and Mounkaila et al. (2015) broadly show a good representa-tion of the WAM onset by RCMs participating in COR-DEX. Mariotti et al. (2014) have shown better performance of RCMs in comparison with GCMs in reproducing the AEW activity, but their analysis is qualitative. Crétat et al. (2015) conducted a more detailed analysis on the relation-ship between AEWs and daily rainfall, using various regional simulations, and revealed the fairly good perfor-mance of RCM in terms of spatial and temporal phases. Although a set of arguments tends to confirm the real added value of RCMs, Flaounas et al. (2011) have shown a deci-sive impact of physical parameterizations on the monsoon onset and precipitation intraseasonal variability, implying
2 RegCM3 is the regional model developed at the International Cen-tre for Theoretical Physics (ICTP).
that substantial work is still needed to calibrate or to adapt RCMs for Africa.
As previously noted, a large part of the WAM precipita-tion is attributable to intraseasonal activity and, therefore, the ability of RCMs to represent the intraseasonal vari-ability is closely related with their performance regarding the day-to-day rainfall. Parry et al. (2007) highlighted the necessity of understanding and representing these daily rainfall statistics since they are often more useful (than seasonal means) for impact and adaptation studies. Diaco-nescu et al. (2015) used two ERAI-driven RCMs to ana-lyze the local onset and retreat of the WAM, as well as the daily precipitation statistics such as the occurrences of wet days, consecutive wet and dry days, and extreme rainfall. Their study reveals the difficulty that reanalyses, such as ERAI, have in adequately representing these indices, in particular the statistics of events with precipitation higher than 10 mm day−1. More recently, a study by Klutse et al.
(2015) compared 10 RCMs with observations and noted a generalized weakness of RCMs in producing higher-order daily precipitation statistics such as intensity, frequency or duration. The WAM local onset/retreat is another intrasea-sonal event of great interest but, until now, it has been the subject of only a few comprehensive assessments, espe-cially at local scale (in contrast with large-scale onset) in RCM simulations. Diaconescu et al. (2015) pointed out the difficulties of RCM simulations as well as reanalyses to simulate the local onset over the Sahel region. In this paper, in order to obtain a more comprehensive idea of the intra-seasonality in RCMs and its impacts (quantitatively), a set of daily precipitation indices are evaluated against satellite observations and presented as a performance matrix.
Assessments of the intraseasonal variability may be strongly related to the meteorological variable involved overall in the tropical region. For example, a model with good skill in capturing dynamical AEWs does not neces-sarily have good skill in capturing the associated convec-tive features (MCSs) since these two phenomena, although strongly interacting, occur at different time and space scales (Fink and Reiner 2003). It has to be added that the interactions between the WAM dynamics and convective processes are complex but determine the monsoon activity overall at synoptic scales (Poan et al. 2014). Investigating the intraseasonal variability therefore requires looking into both dynamical and convective parameters.
This paper will use the integrated-column water vapor (also called Precipitable Water, hereafter PW) as a proxy integrating the monsoon dynamics and thermodynam-ics. PW presents the advantage of being relatively better predicted for time scales longer than the diurnal cycle in models (Bock et al. 2007). In addition, Poan et al. (2013) have shown that PW is well suited to following the intra-seasonal activity of the WAM, particularly over the Sahel.
Concerning convective activity, the daily total precipita-tion will be used. While PW, as an integrated variable, is sensitive to atmospheric phenomena lasting long enough (~3–5 days) to affect the total column content, precipita-tion is more affected by shorter scales (less than 3 days). Therefore, combining these two variables allows the whole spectrum of variability to be analyzed, from the longest (up to 90-day period) to the shortest (1-day period) time scales. Focusing on the climate of the recent past (1989–2008), this paper aims to assess the ability of the RCMs (from available CORDEX runs) to represent the WAM intrasea-sonal variability spectrum in comparison with observations. This analysis is a step forward in assessing models since a “fair” representation of the monsoon mean state is not suf-ficient to qualify a model as a “good” one.
The paper is organized as follows. The data and method-ology are described in Sect. 2. In Sect. 3, the climatology of the WAM is discussed in terms of PW and precipitation as simulated by RCMs, reanalysis and observations. Section 4
analyses the WAM intraseasonal variability through PW fil-tered variance and precipitation frequency distribution. In Sect. 5, the WAM local onset/retreat and some daily pre-cipitation indices are evaluated. Finally, Sect. 6 summarizes the main findings and suggests further developments. 2 Data and methodology
2.1 Observational datasets and reanalysis
The RCM daily precipitation will be evaluated against the Africa Rainfall Climatology version 2 (ARC2; Novella and Thiaw 2012) daily-precipitation data from the Climate Pre-diction Center (CPC). This is a satellite-based and observa-tionally constrained dataset that covers the African conti-nent (from 40°S to 40°N and from 20°W to 55°E) on a very fine-mesh grid: 0.1° × 0.1°. The dataset is available from 1983 to the present through the CPC site. In order to give some measure of the uncertainty in satellite-based observa-tions, two other sets of satellite-based and observationally-constrained daily precipitation were used:
• TRMM 3B42 version 6 (Tropical Rainfall Measuring Mission; Huffman et al. 2007) providing 3-hourly pre-cipitations on a 0.25°-mesh grid covering the tropical regions since 1998.
• GPCP-1DD version 1.2 (Huffman et al. 2001) global daily precipitation from the Global Precipitation Clima-tology Project (GPCP), available from 1998 to present on a 1°-mesh grid.
From previous studies (e.g. Sylla et al. 2012), it is known that observational data have less and less consistency when
higher order statistics on daily precipitation over West Africa are assessed. Therefore, it became difficult to select one of our satellite data sets as a reference to compare RCMs. However, mainly because of its longer time period, ARC2 will be considered in the majority of analyses, while TRMM and GPCP will help to nuance the comments.
Precipitation and PW from ERAI are also used to com-pare the RCM-simulated daily fields. The data cover the recent period of 1979 to 2009 and are offered on a 0.75°-mesh grid. It should be borne in mind that there is no station-precipitation assimilation in ERAI, and hence the reanalysis precipitation is a prognostic variable that is a by-product of the assimilation of other atmospheric variables and the short-term forecast of the ECMWF model.
2.2 RCM data
A subset of six CORDEX-Africa RCMs was available in this study for the evaluation of historical experiments. The model boundary conditions were given by ERAI for the CORDEX project evaluation and by simulations from three Coupled GCMs for the historical CORDEX project, namely CanESM2 (Arora et al. 2011), MPI-ESM-MR (Jungclaus et al. 2013) noted here as MPI, and EC-EARTH (Hazeleger et al. 2012). To avoid any confu-sion, most of the results from these GCM-driven simula-tions will be shown in the Appendix and so will be com-mented only briefly. The RCM simulations are provided on a 0.44° horizontal grid. Details of each RCM are sum-marized in Table 1. The CRCM5 (Hernández-Díaz et al.
2013; Laprise et al. 2013) data were acquired directly from the Centre pour l’Étude et la Simulation du Climat à l’Échelle Régionale (ESCER Centre) at UQAM (http:// www.escer.uqam.ca/), CanRCM4 (Scinocca et al. 2016) data were provided by the Canadian Centre for Climate Modelling and Analysis division of the Climate Research Branch of Environment Canada (CCCma/CRB/EC; http:// www.ec.gc.ca/ccmac-cccma/), and the other RCM data were obtained through the Earth System Grid Federation (ESGF; for details see http://www.cordex.org/index.php/ output). Note that the HIRHAM5 PW field was not avail-able at the time of the present study.
2.3 Methodology and definitions
As shown in the data section, several RCMs were involved in this analysis with the main purpose of highlighting their consistency versus their spread due to the different choices made for each RCM (as shown in the review by Paeth et al.
2011). Ideally, all the simulations involved in the CORDEX project should have been used. However, only 6 of all avail-able RCMs could be selected from the database, mainly because of the necessity of having PW. In the discussion,
attention will be paid to model spreads which, in turn, will be raised as key topics for future improvements.
Most of the analyses shown in this paper involve conver-sions between time and frequency domains. For temporal filtering, the Lanczos filter described by Duchon (1979) was used in different modes such as high-pass (“hp”) and band-pass (“bp”) filtering. Since boundary effects are a critical issue in data filtering, it is worth mentioning that the filtering was applied to all the data ranging from Janu-ary to December of each year, even though only the sum-mer rainy months (June-July–August-September, JJAS) were kept for the analysis, thus reducing spurious bound-ary effects. The JJAS time period corresponds to the main humid period over the WAM region, especially in the Sahel/Sudan area (e.g. Sultan et al. 2003).
To analyze the periodicities involved in the intrasea-sonal anomalies, we used a Fast Fourier Transform (FFT) algorithm. This classical method allows any time-discrete signal to be described through its power spectral density (PSD). The contribution of each frequency to the total time variance of the signal can thus be analyzed. The choice was made to plot the normalized PSD for each dataset. By doing this, we could compare the relative importance of each time scale of the different models regardless of their initial differences in amplitude.
Wavelet analysis is also used in this study. The proto-col defined by Torrence and Compo (1998) was applied to the daily rainfall at each grid point, then spatially averaged over specific regions. This technique provides an overview of the contributions of different intraseasonal scales rep-resented in RCMs, ERAI and observations for a specific year, such as 2009, which was marked by intense, sustained rainy events over West Africa. Sultan et al. (2003) showed that such an analysis was particularly useful to reveal the WAM intraseasonal modes. It is worth mentioning that the FFT and the wavelet analysis were applied to the intrasea-sonal signal, defined for each variable as its 90-day high-pass filtered (hp90) variance, as used in recent studies (e.g. Chauvin et al. 2010).
The second part of our analysis is devoted to the assess-ment of daily precipitation indices. Diaconescu et al. (2015) give details on the background concepts supporting the selection of these indices, while Gachon et al. (2007) show the climatology of such indices using numerous stations over West Africa. The Root Mean Square Error (RMSE, against ARC2 used as reference dataset) is used as the metric and the information is summarized using a condensed performance matrix (e.g. Gleckler et al. 2008). For each index, the matrix records the ratio of each model RMSE and the highest RMSE among all models.
The WAM onset corresponds to a significant decrease in precipitation near the Guinea coast (5–10°N) and, conversely, its durable establishment over the northern
Table
1
Ensemble
of RCM simulations used o
ver the current climate from both reanalysis and GCM-dri
ven conditions, with the detailed description of domain size, model’
s main characteris
-tics, grid projection and time range as well as with the main sub-grid scale parametrization references Model name
UQAM-CRCM5 CCCma-CanRCM4 CLMcom-CCLM-4-8-17 KNMI-RA CMO22T DMI-HIRHAM5-v2 SMHI-RCA4-v1 Short name CRCM5 CanRCM4 CCLM RA CMO22T HIRHAM5 RCA4
Institute running the model
Uni
versité du Québec à
Montréal, Canada
Canadian Centre for Climate Modeling and Analysis, V
ictoria,
Canada
Climate Limited area Modeling Community (CLM-Community)
Ro
yal Netherlands Meteorological Institute (KNMI) Danish Meteorological Institute (DMI) Swedish Meteorological and Hydrological Institute (SMHI)
Dri ving condition/ time range ECMWF-ERAINT : 1979–2010 CCCma-CanESM2: 1950–2005 MPI-M-MPI-ESM-LR: 1951–2005 ECMWF-ERAINT : 1989–2009 CCCma-CanESM2: 1950–2005 ECMWF-ERAINT : 1989–2008 ICHEC-EC-EAR TH: 1951–2005 MPI-M-MPI-ESM-LR: 1950–2005 ECMWF-ERAINT : 1979–2012 ICHEC-EC-EAR TH: 1950–2005 ECMWF-ERAINT : 1989–2010 ICHEC-EC-EAR TH : 1951–2005 ECMWF-ERAINT : 1980–2010 CCCma-CanESM2 : 1956–2005 ICHEC-EC-EAR TH : 1956–2005 MPI-M-MPI-ESM-LR : 1956–2005 Con vecti ve scheme
Kain and Fritsch (
1990 ), K uo ( 1965 ) Zhang and McF arlane ( 1995 ) T iedtk e ( 1989 ) Jak ob and Siebesma ( 2003 ), T iedtk e ( 1989 ) T iedtk e ( 1989 )
Kain and Fritsch (1990
, 1993 ) Radiation scheme Li and Bark er ( 2005 ) Li and Bark er ( 2005 ), Bark er et al. ( 2008 ) Pincus et al. ( 2003 )
Ritter and Gele
yn (
1992
)
Fouquart and Bonnel (1980
)
Fouquart and Bonnel (1980
), Mla wer et al. ( 1997 ) Sa vijärvi ( 1990 ), Sass et al. ( 1994 ) T urb ulence V ertical dif fusion Benoit et al. ( 1989 ),
Delage and Girard (1992
), Delage ( 1997 ) Abdella and McF arlane ( 1997 ), v on Salzen et al. ( 2013 ) Herzog et al. ( 2002 ), Buzzi et al. ( 2011 ) Eddy-dif fusi vity
(1st order K) mass flux approach
Louis (1979) Cuxart et al. ( 2000 ) Cloud microph ysics scheme Sundqvist et al. ( 1989 )
von Salzen and McF
arlane ( 2002 ), v on Salzen et al. ( 2013 ) Doms et al. ( 2007 ),
Baldauf and Schulz (2004
) T iedtk e ( 1993 ) T iedtk e ( 1989 ), Tompkins ( 2002 )
Rasch and Kristjánsson (1998
) Land surf ace scheme CLASS 3.5, V erse gh y ( 2000 ) CLASS 2.7 TERRA-ML Doms et al. ( 2007 ) TESSEL, ECMWF (2006) Schulz et al. (2001), Hagemann ( 2002 ) Samuelsson et al. ( 2006 )
latitudes (10–17°N). Sultan et al. (2005) highlighted what was at stake in the region’s socio-economic life during the onset, presenting it as the most important intrasea-sonal event, crucial for agro-pastoral yields. Therefore it is important for RCMs to be able to capture the monsoon onset (and its retreat) for both present and future climates. In the literature on the WAM (e.g. Vellinga et al. 2013; Fitzpatrick et al. 2015), two main features can be used for detecting the onset: (1) the large-scale onset that focuses on the shift (or jump) of the sustained rainy band from its Guinean position (~5°N) to a Sudanese position (~10°N), (2) the local onsets are related to more agricultural pur-poses and represent the effective start of sustained rainfall at a specific location. The large-scale precipitation onset has been quite widely analyzed, in particular in CORDEX simulations (among others, Gbobaniyi et al. 2013; Nikulin et al. 2012; Diaconescu et al. 2015) and most RCMs tend to improve the onset occurrence in comparison with ERAI and GCMs. The local onset is more complicated to repro-duce since precipitation structures are more affected by smaller scale processes in this case (Marteau et al. 2011). Fitzpatrick et al. (2015) recently studied this issue by com-paring different data and/or definitions, and revealed that there was poor consistency in local onset while large-scale onsets were quite well correlated. In this paper, the focus is on local onset and the intention is to see how good RCM skills are at smaller scales, and hence whether they can be used in agricultural domains, for instance.
The local onset computation is based on the method of Diaconescu et al. (2015) here, which takes its inspiration from a study by Liebmann and Marengo (2001). An onset function is defined, for each grid point, as the cumulative sum of daily precipitation anomalies from day 1 (1st
Janu-ary) to day 365 (31st December). The anomalies are
com-puted against the grid-point climatological mean, which, in our case, is a 20-year mean. Physically, this definition allows the weight (or impact) of any daily rainy event on the whole season state to be taken into account at the time it occurs. In addition, from an agricultural point of view, a given event will not be “useful” if (1) it is not sufficient to change the trajectory of the onset function or (2) it is not sustained by companion events to keep the function mov-ing in the same direction. From this function, the onset date is detected as the day the function reaches its mini-mum and, conversely, its maximini-mum for the retreat. By com-parison, Vellinga et al. (2013) defined their local onset as the date when a certain threshold (e.g. 20 %) of the aver-age seasonal total rainfall was reached at a given location. Finally, given that there is still no consensus defining the WAM local (and even regional) onset, it has to be agreed that one might be cautious when analyzing the onset issues from different approaches (as argued by Fitzpatrick et al.
2015).
The time average will be computed more often over 1989–2008 (except for TRMM and GPCP, 1998–2008). Since ARC2 is the longest available set of observational data, it will be considered as the reference for precipi-tation, while ERAI will be the reference for PW. Bock et al. (2007) have shown the accuracy of ERAI PW using ground-based GPS observations over West Africa.
3 Climatological background: column‑integrated humidity and monsoon precipitation
3.1 On the relationship between precipitable water and observed rainfall
The physical link between PW and tropical rainfall has been inferred and discussed by recent studies (Holloway and Neelin 2007; Neelin et al. 2009). The amount of PW and its time variations integrate thermodynamic (specific humidity) and dynamic (wind) processes, respectively, and therefore it can provide suitable information on the evolu-tion of the monsoon. More specifically, over the Sahel, the humidity supply is the essential factor for building up moist static energy since the heat reservoir is already huge. Bock et al. (2007) showed high correlations between the WAM rainfall and PW at 5 ground-based GPS stations, both at seasonal and intraseasonal scales. It was also inferred by Bock et al. (2008) that no rainfall occurs when PW is smaller than 30 mm. At synoptic scale, Poan et al. (2013) have shown that PW is particularly well suited for the detection and monitoring of the AEW dynamics, as well as the associated precipitation.
More generally, over tropical oceanic regions, Holloway and Neelin (2007) showed that, considering its relatively long autocorrelation time, PW can integrate both synoptic and mesoscale physics, while precipitation is more sensi-tive to shorter (a few hours) time-scale processes. Finally, PW is expected to provide a “smoothed” view of the rel-atively chaotic patterns of precipitation. In this paper, the performance of RCMs in representing PW consistently with rainfall is discussed.
Figure 1a displays ERAI PW JJAS climatology (colors represent mm) and variance (contours in mm2). The thick
green line delimits the 30-mm threshold, below which no significant rainfall is observed. The notable meridional gradient of humidity is delimited by southern (south of 15°N) values higher than 40 mm and low values (<30 mm) north of 20°N. In between, in the Sahel area, lies the sharp gradient but also the band of high variability. For exam-ple, Table 2 shows a variation of approximately 22 mm of PW between 10°N and 20°N around the Greenwich meridian, with an increase between 15°N and 20°N. The seasonal-mean precipitation displayed in Fig. 1b (ARC2)
is consistent with the overall patterns of PW from ERAI showing a south-to-north decrease. Over the Sahel, rainfall seems to occur only where PW exceeds 30 mm (south of 20°N). The northern contour of 1 mm day−1 follows the
maximum of PW variance remarkably well (Fig. 1a). Over the topography of Guinea, Cameroon and Ethiopia, the lower values of PW are anti-correlated with the maximum in precipitation.
Despite a fair representation of PW in ERAI (as noted by Bock et al. 2007), Fig. 2a, b as well as Table 2 clearly show the difficulties of ERAI in reproducing rainfall con-sistent with observations. The rain belt is particularly far south and the 1 mm day−1 contour barely goes north
of 15°N. Precipitation of only 0.9 mm day−1 occurs at
15°N (near the Greenwich meridian) while ARC2 shows 2.5 mm day−1 (see Table 2). The southward position of the
rainfall is particularly striking west of 5°E. The seasonal maximum is trapped south of 10°N. Regarding the obser-vational data shown in Table 2, although the TRMM and ARC2 datasets are consistent with each other, the average daily precipitation rate appears higher in the former than in the latter. However, TRMM climatology uses only 11 years
(1998–2008) and that might slightly influence the seasonal-mean values, as the last decade has been more humid with more extreme rainfall over the Sahel than previous decades (e.g. Mouhamed et al. 2013; Sarr et al. 2014).
Being a reanalyzed variable, ERAI PW agrees with observations (e.g. radio-sounding of humidity) quite well and can be regarded as being as accurate as GPS observa-tions (as shown by Poan et al. 2013). On the other hand, ERAI rainfall shows large discrepancies with respect to observed data, at least over the Sahel. In other words, although necessary, an accurate representation of the mon-soon large-scale dynamics and thermodynamics is not suf-ficient to produce an accurate precipitation field. It also implies that the model physical parameterizations are very important, specifically over the Sahel where diabatic processes (e.g. boundary layer, cumulus convection) are important.
3.2 Joint analysis of the seasonal PW and precipitation in regional models
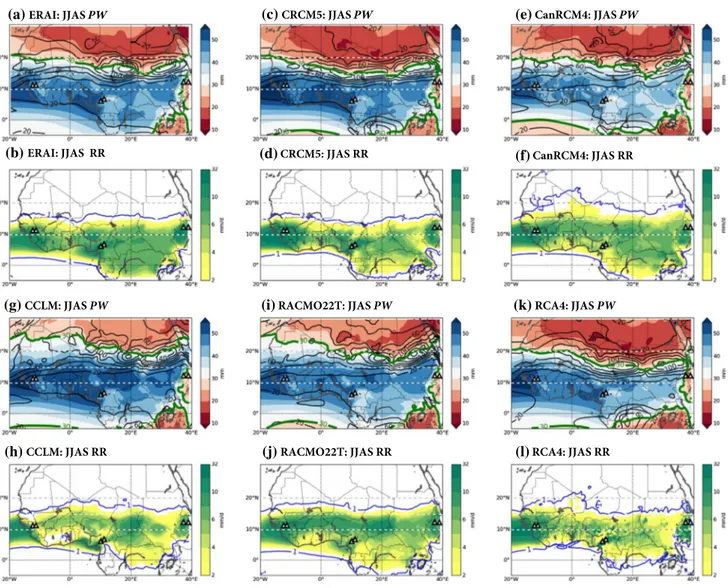
Figure 2 presents the JJAS climatological mean for PW (upper panels) and precipitation (lower panels) for ERAI and as simulated by five RCMs driven by ERAI. Table 2
also gives details on PW and rainfall (mean values and meridional gradients), sampling the monsoon region at dif-ferent locations from East to West: inland (15°E), Green-wich (0°E) and over the western coast (15°W), all along the 15°N parallel. The indices are computed using a 2° latitude/ longitude square (~5 × 5 RCM grid points) centered on each location. This table aims to give a quantitative assess-ment of RCM behaviors in the critical Sahel band where both humidity and precipitation gradients are strong, and therefore difficult to reproduce. The seasonal-mean struc-ture of PW shown in Fig. 2 implies that all RCMs repre-sent the climatology (position and amplitude) described in Sect. 3 a quite well, namely the sharp north–south humidity gradient as well as the Sahel zonal band of high variability. In fact, RCM-simulated PW is of the same order as ERAI, except in the CCLM model, where it appears particularly higher. On the other hand, more discrepancies and disper-sion between RCMs appear when PW variance is consid-ered. Over the Sahel, Couvreux et al. (2010) showed that more than 75 (88 %) of PW mean (variance) is brought by levels below 700 hPa, suggesting that a good represen-tation of low-level circulation is crucial to obtaining the right quantities of PW. In agreement with previous studies (e.g. Sylla et al. 2009), it can be speculated here that most RCMs, because of improving local/regional processes, tend to better simulate the low-level circulation, together with the mean temperature and humidity gradients. From a more detailed analysis, Table 2 reveals that the spatial distribution is reproduced by RCMs with variable levels of
Fig. 1 1989–2008 Seasonal (June–July–August–September, JJAS)
mean fields. a ERAI PW (colors in mm) and variance (contours in mm2); the thick green line delimits the 30-mm PW threshold below which no significant rainfall is observed. b ARC2 precipitation (colors in mm day−1); the thick blue lines delimit the 1 mm day−1 precipitation. The triangles indicate the location of three main topo-graphical features: FD Fouta Djallon, CM Cameroon Mountain, ET Ethiopian Highlands
success, especially near the Greenwich meridian and inland (15°E), where the differences with ERAI are quite substan-tial. However, it is important to keep in mind that PW is a “freely” simulated variable in RCMs (inside the domain) while, in ERAI, it should be strongly constrained by the observation data assimilation procedure.
Over the Sahel, the low-level temperature gradient explains the existence of the African Easterly Jet (AEJ) near 600 hPa (Thorncroft and Blackburn 1999). That tem-perature gradient combined with the humidity gradients constitute a baroclinic energy reservoir that is strongly involved in the genesis and the development of summer atmospheric disturbances such as AEWs (Leroux and Hall
2009). Consequently, it seems important that RCMs repro-duce this baroclinic mean state over the Sahel, which can be inferred through PW meridional gradient. In fact, Hsieh and Cook (2007) demonstrated that their RCM was able to handle the energetics of the AEJ-AEW system quite accurately. As can be inferred from Table 2 and Fig. 2k, RCA4 is the closest model to ERAI in representing the position and the amplitude of the baroclinic zone. In par-ticular, the 30 mm contour of PW, which is the marker of the Inter Tropical Discontinuity (ITD) according to Bock et al. (2008), is quite well reproduced. The JJAS-mean pre-cipitation of RCA4 is also consistent with the observations, except near the western coast, where it is overestimated
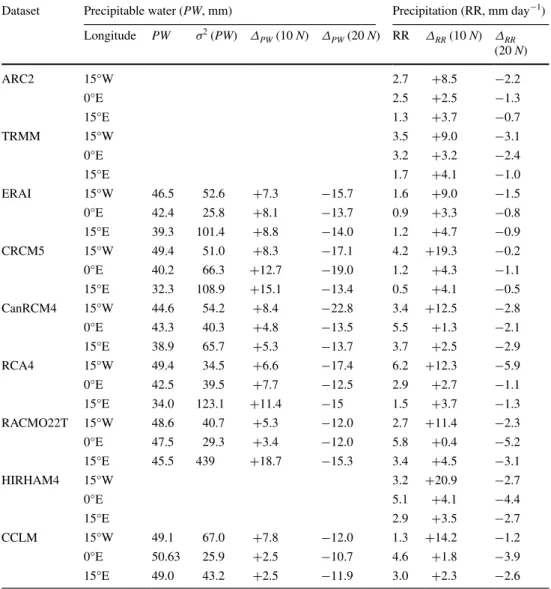
Table 2 JJAS climatology
of different indices computed using daily precipitation and PW from RCMs, ERAI and satellites observations, and spatially averaged over three specific locations
These locations (varying in longitude “Long”) have been sampled at 15°W (coast), 0°E (Greenwich) and 15°E (Central Africa). Their latitude extension is 2° centered on the reference 15°N. PW15N and σ15N2 refer to PW mean and variance for each location. To compute the meridional southern (between 10°N and 15°N) and northern (between 15°N and 20°N) “gradients” (without distance normalization) for each reference longitude location described previously, we use Δχ (20 N) = χ(20 N) − χ(15 N) and Δχ(10 N) = χ(10 N) − χ(15 N) where χ states for PW or RR (precipitation in mm/day). Note HIRHAM5 PW was not available
Dataset Precipitable water (PW, mm) Precipitation (RR, mm day−1) Longitude PW σ2 (PW) ΔPW (10 N) ΔPW (20 N) RR ΔRR (10 N) ΔRR (20 N) ARC2 15°W 2.7 +8.5 −2.2 0°E 2.5 +2.5 −1.3 15°E 1.3 +3.7 −0.7 TRMM 15°W 3.5 +9.0 −3.1 0°E 3.2 +3.2 −2.4 15°E 1.7 +4.1 −1.0 ERAI 15°W 46.5 52.6 +7.3 −15.7 1.6 +9.0 −1.5 0°E 42.4 25.8 +8.1 −13.7 0.9 +3.3 −0.8 15°E 39.3 101.4 +8.8 −14.0 1.2 +4.7 −0.9 CRCM5 15°W 49.4 51.0 +8.3 −17.1 4.2 +19.3 −0.2 0°E 40.2 66.3 +12.7 −19.0 1.2 +4.3 −1.1 15°E 32.3 108.9 +15.1 −13.4 0.5 +4.1 −0.5 CanRCM4 15°W 44.6 54.2 +8.4 −22.8 3.4 +12.5 −2.8 0°E 43.3 40.3 +4.8 −13.5 5.5 +1.3 −2.1 15°E 38.9 65.7 +5.3 −13.7 3.7 +2.5 −2.9 RCA4 15°W 49.4 34.5 +6.6 −17.4 6.2 +12.3 −5.9 0°E 42.5 39.5 +7.7 −12.5 2.9 +2.7 −1.1 15°E 34.0 123.1 +11.4 −15 1.5 +3.7 −1.3 RACMO22T 15°W 48.6 40.7 +5.3 −12.0 2.7 +11.4 −2.3 0°E 47.5 29.3 +3.4 −12.0 5.8 +0.4 −5.2 15°E 45.5 439 +18.7 −15.3 3.4 +4.5 −3.1 HIRHAM4 15°W 3.2 +20.9 −2.7 0°E 5.1 +4.1 −4.4 15°E 2.9 +3.5 −2.7 CCLM 15°W 49.1 67.0 +7.8 −12.0 1.3 +14.2 −1.2 0°E 50.63 25.9 +2.5 −10.7 4.6 +1.8 −3.9 15°E 49.0 43.2 +2.5 −11.9 3.0 +2.3 −2.6
with respect to ARC2. For instance, the mean rainfall and its south/north gradients (Table 2) at 0° and 15°E are bet-ter simulated in RCA4 than in ERAI. Some similarities can be noted between RCA4 and CanRCM4, although the latter seems slightly wetter over 15–20°N.
CCLM and RACMO22T present a relatively moister Sahel and a weaker PW gradient than ERAI, and their sea-sonal-mean PW is clearly overestimated between 10 and 20°N, with all values above 40 mm (Fig. 2g, i). The Saha-ran Heat Low region (minimum of PW north of 20°N in Fig. 1a) is almost nonexistent in the west or confined over Libya and Egypt in the east. Regarding the precipitation field, these RCMs simulate the precipitation patterns north of 17°N relatively well despite the fact that they overes-timate PW. However, as shown by the 1 mm day−1
con-tour as well as their maximum rain belt (10–15°N), these 2 RCMs tend to have zonally symmetric behavior and so do not reproduce the variations shown in observations (i.e.
ARC2 in Fig. 1b). Note that a subset of these RCMs was assessed by Paeth et al. (2011) with similar remarks con-sidering their biases in mean precipitation.
CRCM5 has quite singular behavior with an underes-timation/overestimation of the average amount of rainfall over the northern/southern Sahel, leading to stronger humid-ity gradients around the 15°N band (Fig. 2d). For example, around 0°E, PW decreases by ~31 mm from 10°N to 20°N in CRCM5, whereas in ERAI it decreases by ~21 mm (Fig. 2c and a, respectively). This excessive gradient in CRCM5 appears to be related to its overestimated precipitation south of or near 10°N, and almost no rainfall north of 15°N. More generally, despite significant discrepancies with respect to ERAI PW, most of the RCMs tend to improve the spatial distribution of precipitation shown by ERAI over the whole Sahel area. It also seems clear that, when RCMs have a good representation of PW (such as RCA4), they reproduce the seasonal-mean rainfall more accurately.
CCLM: JJAS PW RACMO22T: JJAS PW RCA4: JJAS PW
CCLM: JJAS RR RACMO22T: JJAS RR RCA4: JJAS RR
(a) (e) (f) (b) (g) (k) (l) (h) (i) (j) (c) (d)
4 WAM intraseasonal scales in RCMs
In principle, regional modeling is expected to significantly improve the way general features of the WAM dynamics are represented and, in particular, its intraseasonal activ-ity, such as onset–retreat, persistent dry–wet spells, and also AEWs with respect to coarse-scale driving fields. As the humidity field is one of the key (and limiting) factors for convection over the Sahel, PW has been proposed by Poan et al. (2013) as an index to follow the WAM intrasea-sonal fluctuations as it can follow deep convective activity as well as low-level dynamics. This perspective is analyzed below with RCM simulations.
4.1 Intraseasonality from the precipitable water perspective
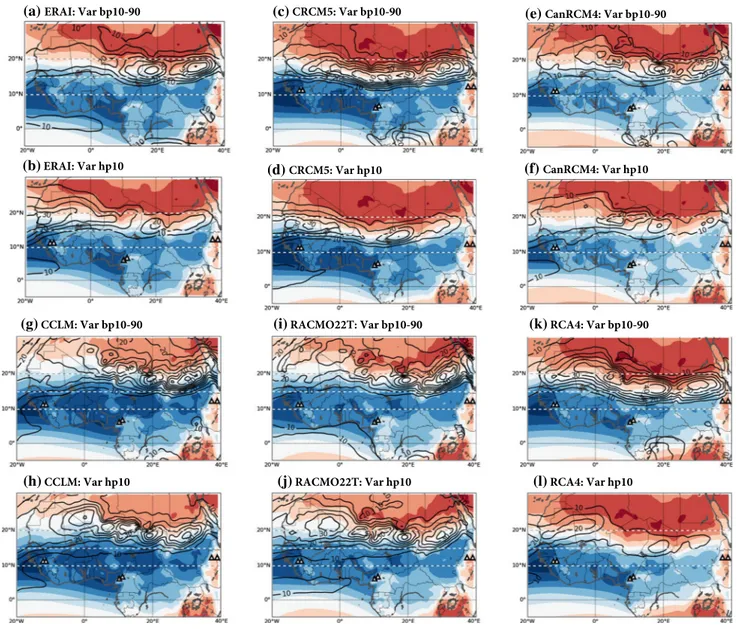
Figure 3 presents PW variance filtered at two intraseasonal sub-scales: the 10–90-day band-pass and the 1–10-day high-pass, referred to hereafter as low- and high-frequency (or synoptic) scales, respectively. These two subscales were chosen in order to distinguish between monsoon activity due to meteorological phenomena, and its relatively slower (biweekly to monthly and seasonal) temporal variations that are more often related to broader time and space phenom-ena involving interactions with the two surrounding oce-anic basins (Indian and Atlantic). ERAI variance displayed
(a) (c) (e)
(d) (f)
(b)
(g) CCLM: Var bp10-90 (i) RACMO22T: Var bp10-90 (k) RCA4: Var bp10-90
(h) CCLM: Var hp10 (j) RACMO22T: Var hp10 (l) RCA4: Var hp10
Fig. 3 1989–2008 JJAS PW Intraseasonal variance partitioning
(con-tours in mm2). For each pair of rows, the top panels show the 10–90-day band-pass variance and the bottom panels the 10-10–90-day high-pass
variance for each dataset, the names of which are given in the titles. The colors show the seasonal mean PW (as in Fig. 2)
in Fig. 3a, b has been discussed in Poan et al. (2013) and only some essential elements are recalled here for the com-parison with the RCMs. Firstly, maximum variance in both frequencies is confined between 15°N and 25°N (similarly to the total variance shown in Fig. 2) with, however, quite a strong east–west asymmetry. As shown by Leroux et al. (2010), low-frequency variability is greater and mainly prevails over Eastern Africa, east of 10°E (Fig. 3a), then decreases westward from 15°E. Conversely, the 1–10-day band (Fig. 3b), first weaker east of 20°E, rapidly becomes predominant further west, reaching a maximum over the west coast. This 1–10-day variance structure is consistent with the well-known pattern of AEWs, which are triggered over the eastern mountains and then grow quickly on the mean-state baroclinic energy as they propagate westward (Burpee 1972).
As for ERAI, the RCM intraseasonal variance repro-duces the overall pattern of the mean JJAS variance, confin-ing the highest values along the strong gradient zone. Con-sidering more specifically the distribution within the two frequency bands, most of RCM simulations seem rather inaccurate in comparison with the reanalysis. First, the large Eastern African low-frequency activity shown in all RCMs simulations (variance field in 10–90-day) is consist-ent with the analysis of Alaka and Maloney (2012) showing that the MJO dry and wet phase oscillations induce strong PW fluctuations over this region. Although this MJO-like behavior seems fairly consistent with ERAI fields and the findings of Alaka and Maloney (2012) east of 10°E - Cen-tral to Eastern Africa, the low-frequency activity appears to be overestimated in all RCMs over the rest of the con-tinental Sahel. This is reminiscent of some results on the WAM intraseasonal-scale analysis with CMIP5 GCMs by Roehrig et al. (2013) and implies that, even in RCMs, there is still an overrepresentation of the impacts of larger-scale phenomena (from oceanic basins, tropical waves such as MJO). Regarding the 1–10-day variability, only two RCMs (RCA4 in Fig. 3k–l and CRCM5 in Fig. 3c, d) are able to reproduce the zonally westward growth structure of the PW variance. In fact, except for these two models, there is no clear distinction in the intraseasonal variance distribution between the two sub-scales. For instance, CCLM (Fig. 3g, h) and RACMO22T (Fig. 3i, j) display structures that are almost analogous for the two frequency bands, concentrat-ing the variance east of the Greenwich meridian, with a northward shift of the variance field. Therefore, the west-ward increase in synoptic variability is not well repro-duced, implying that these RCMs might not be efficient to handle AEW dynamics or their relative contribution to the intraseasonal (rainfall) variability. As discussed in the introduction, numerous studies have illustrated RCMs’ ability to represent the dynamics of AEWs, but without any clear links to the Eastern region activity that, at least partly,
controls AEW intermittency (e.g. Mekonnen et al. 2006; Leroux et al. 2010). From this PW perspective (which may be verified with another dynamical field), it appears that the eastern low-frequency/western high-frequency connection remains a weakness for current RCM simulations (but to a lesser extent for RCA4 and CRCM5).
Figure 4 summarizes, in two regional sub-domains iden-tified as coastal [20°W–10°W; 12–20°N] and continental [5°W–5°E; 12–20°N], the PW “total” intraseasonal vari-ance (hp90 varivari-ance) and the previously discussed varivari-ance divided in two frequency bands. For each model (combin-ing RCMs driven by ERAI and by GCMs), “total” variance normalized by ERAI one is shown, while the two frequency bands are analyzed in terms of relative contributions to their sum. For example, over the coastal region, CRCM5 driven by ERAI has approximately the same variance as ERAI (~103 % of ERAI variance): 42 % of this intrasea-sonal variance is due to low-frequency activity while the rest (~58 %) is due to synoptic scales. This sub-scale par-titioning stays close to the ERAI one for most RCMs over the western coast. However, the inter-model spread in terms of total PW variance among RCMs is more substantial over the central WAM region (i.e. 5°W–5°E). This is espe-cially the case when RCMs are driven by GCMs instead of ERAI, especially for the two Canadian RCMs (not shown). Hence, the lateral boundary conditions appear to have significant effects on the “total” intraseasonal variance for the two Canadian RCMs over the central WAM area, with quite a large overestimation of the total PW variance when CRCM5 and CanRCM4 are driven by the CanESM2 model. This sensitivity of the intraseasonal variability to the boundary conditions has been also noted in Pohl and Douville (2011), but contrasts with the conclusions of Sylla et al. (2009) who found that GCM biases (or boundary con-ditions) had quite a small impact on RCM performance.
Regarding the partitioning of this variance into the two frequency bands, the reference ERAI shows the predomi-nance of the synoptic scales in both regions, with a grow-ing fraction as the transient structures propagate westward. As discussed above, the majority of RCMs encounter dif-ficulty in reproducing this behavior according to the cho-sen region. For example, although CRCM5 simulates the distribution quite similarly to reanalysis over the coast (as illustrated by the ratios), the differences with ERAI increase over the continent. In addition, it should be noted that, although CRCM5, RCA4 and, to a lesser extent, Can-RCM4 reproduce the synoptic variance structure quite well (as shown in Fig. 3), they display an inaccurate ratio over the continental area (as shown in Fig. 4) due mainly to an overestimation of the low-frequency variability (>10 days) over the central and western Sahel. This has the effect of increasing longer timescale phenomena at the expense of meteorological events or high-frequency variability.
Reducing the proportion of low-frequency variability is therefore a challenge that must be met by most RCMs and, by extension, by GCMs as already shown by Roehrig et al. (2013), if they are to better represent scale interactions cru-cial for AEW triggering, development and intermittency (Leroux et al. 2010).
4.2 Intraseasonality from the precipitation perspective
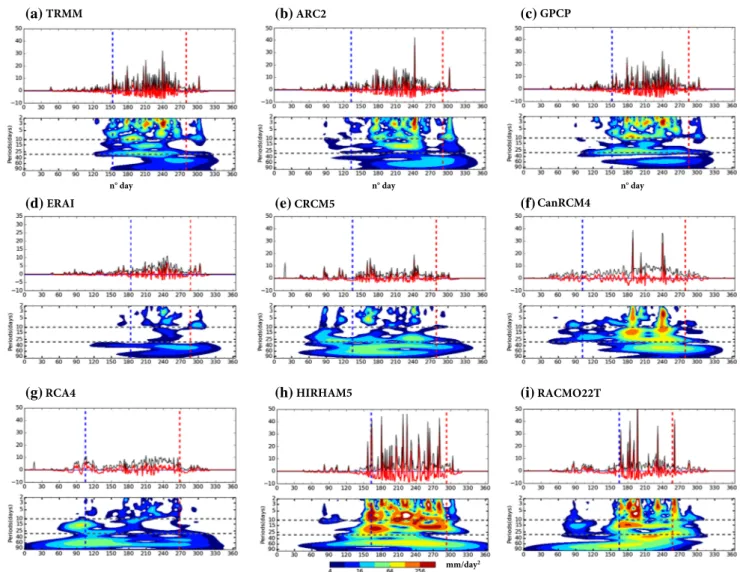
4.2.1 Illustration with the 2009 season: wavelet analysis To illustrate the WAM intraseasonal activity in terms of precipitation, Fig. 5 displays the rainfall time series and their corresponding wavelet spectrum during the year 2009. We focus on the region [5°W–0°E; 10–15°N] (in Burkina Faso, including Ouagadougou) and the 2009 sea-son, as this year was abnormally humid, with a devastat-ing flood (more than 200 mm/day) that occurred on 1st September 2009, the wettest day at Ouagadougou for more than 90 years (BBC News 2009). Galvin (2010) has documented this meteorological event and shown that it was associated with two successive, strong AEWs within which intense MCSs occurred. This case study allows us to evaluate how RCMs (in reanalysis-driven mode) can represent the intraseasonal variability of the WAM and, more specifically, when extreme events occur within the season. The time series (top panel) show the daily precipi-tation and its anomalies over the year 2009. The wavelets (bottom panel) represent the time series (on X-axis) of
the precipitation variance (in color scale, in mm2 days−2)
for each time scale (2 to 90 days on Y-axis). The vertical blue (red) dashed line represents the average date of local onset (retreat), computed following the method described in Sect. 2.3 and averaged over the domain. The first top panels from the three observed datasets reveal quite similar results for both precipitation time series and wavelet spec-trum. The time series imply that a large amount of the rain-fall variability is ascribable to the intraseasonal fluctuations (red curve). The monsoon onset (blue dashed line) occurs around early June and is consistent with the beginning of persistent rainfall or wet spells (i.e. duration and intensity of regular precipitation events). A small difference between observations comes from ARC2 data (Fig. 5b) (the higher resolution dataset), which shows an onset earlier by about 2 weeks and a later retreat than TRMM and GPCP. The three intraseasonal scales of the WAM discussed previ-ously can be seen quite distinctly in the wavelet spectrum, with the energy decreasing progressively from the synoptic scale (less than 10-day fluctuations), through the 10–25 day to the 30–90-day bands. Isolated rainy events start in late May-early June, as the atmosphere becomes increasingly humid. Then, more regular and intense events take place between June and August, after which comes an impor-tant decrease in the intraseasonal activity, signaling the monsoon retreat. The flooding event of later August-early September (around day 240) can be seen in all the obser-vational datasets. Even though a remarkable intensity is visible around day 240 at synoptic scale, there is also a
Fig. 4 Regional average of PW intraseasonal variance distribution
across different time scales over JJAS for 1989–2005: the “total intra-seasonal scale” as 90-day high-pass variance (var_hp90 in blue), the “low frequency scale” as 10–90-day band-pass variance (var_bp10-90 in red) and the “high frequency scale” as 10-day high-pass variance (var_hp10 in green), for the coastal [20°W–10°W, 12–20°N] and the
continental [5°W–5°E, 12–20°N] regions. The var_hp90 bars rep-resent the ratio (%) of each simulation variance relatively to that of ERAI, while the hp10 and the bp10–90 bars represent for each sim-ulation, the ratio relatively the “total” intraseasonal variance within each simulation. Note that two GCM-driven simulations are also rep-resented
non-negligible contribution of lower (intermediate) fre-quency at the 10–25 day scale (especially in ARC2).
The RCM and ERAI time series show marked discrep-ancies, ranging from “too dry” (ERAI, Fig. 5d) to “too wet” (HIRHAM5, Fig. 5h) conditions. ERAI deviation from observations is salient (consistent with the strong dry biases shown by Nikulin et al. 2012), even though it benefits from the assimilation of various variables to simulate its rainfall. Throughout the season, it shows a systematic underestimation (more severe among RCMs) of rainfall intensity and duration, and of the length of the monsoon season. In general, ERAI presents a dominant and persistent 30–90 day mode, occurring quite early in the season, and then a few synoptic events, among them the intense rainfall around the flooding period (i.e. near
day 240) is quite weak. The RCM simulations gener-ally improve the variability in time series as well as the onset-retreat timing and, except for RCA4 (Fig. 5j), they capture the intense precipitation event that occurred near day 240, and that caused the flooding episode, quite well. The wavelets computed on RCM simulations, as opposed to ERAI, reveal a more intense synoptic-scale activity (below 10 days), more often after June, and so seem more consistent with observations. Differences among RCMs and the three observational datasets appear mainly in the low frequencies, where RCMs generally overestimate the variability, especially above 25 days. Figure 5 also shows that a majority of RCMs simulate an onset that is too early, except from HIRHAM5 and RACMO22T, which tend to show a later onset.
mm/day2 n° day n° day (a) (b) (c) (d) (e) (f) (g) (h) (i) n° day
Fig. 5 Overview of the monsoon season 2009 across the Burkina
Faso region [10–15°N; 5°W–0°E] from TRMM, ARC2, GPCP, ERAI and ERAI-driven RCMs. For each pair of panels, the top plot curves represent daily precipitation time series (in black, mm day−1) and their intraseasonal anomalies as 90-day high-pass filtered (in red).
The bottom panels give the wavelet daily rainfall variance spectrum in mm2 day−2 computed from the intraseasonal anomalies. The verti-cal blue (red) line represents the date of the onset (retreat) in day of year (ranked between 1 and 365) for each dataset mentioned in the title
The use of three different versions of CanRCM4 (not shown) reveals that, more than resolution or dynami-cal spectral nudging, the physidynami-cal parameterization has a greater role to play in the intraseasonal monsoon vari-ability and in its modulation at various timescales over the continental Sahel area. This is consistent with the findings of Flaounas et al. (2011), who showed drastic changes depending on the physical parameterizations.
4.2.2 Precipitation frequency spectrum analysis
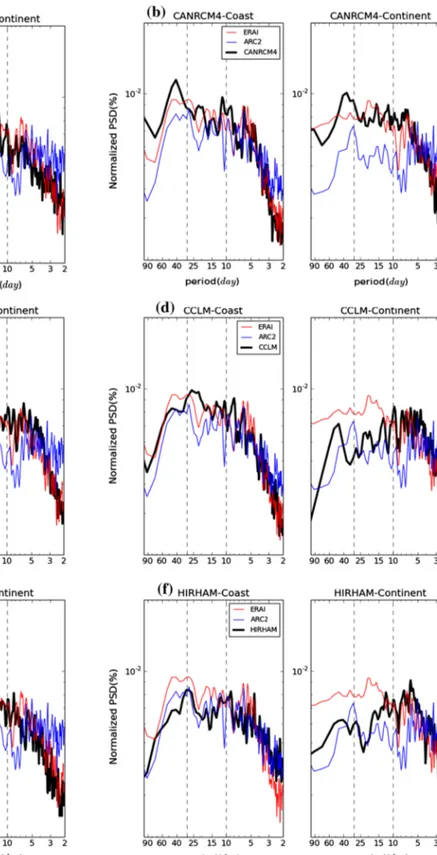
After the illustration of season 2009, the following analysis (Fig. 6) aims to give a climatological view of the WAM pre-cipitation intraseasonal spectrum. Normalized power spec-trum densities (PSDs), computed over 1989–2008 for each RCM and for the two previously discussed sub-regions, are therefore displayed in Fig. 6. On each panel, ERAI (red) and ARC2 (blue) corresponding PSDs are superimposed so that comparisons can be made.
It is interesting to compare the PSDs from ARC2 and ERAI by considering just the blue and red curves on Fig. 6a. Over the continent (right), the ARC2 spectrum (blue) shows the separation between the synoptic scales and the low frequencies distinctly. The low frequencies peak around 40–30 days, consistently with the MJO energy peak. This scale was described by Matthews (2004) as a remote response to the intraseasonal activity over the warm pool. Over the continent, an important role is played by scales shorter than 10 days. These scales are associated with the activity of AEWs, which have been classified in two typical time periods: 6–9 days (Diedhiou et al. 1999) and 2–5 days (Reed et al. 1977). The coastal region spectrum has a quite different structure and does not show a noticeable separa-tion between the two scales. The synoptic-scale energy peaks between 6 and 3 days, and then tends to decrease sharply, unlike the continental one. This implies that con-vection occurs on relatively longer time scales at the coast, while it is more intermittent or sporadic over land. Finally, it is worth mentioning that both TRMM and GPCP spectra, computed over the same regions (not shown), present the same scale patterns as the ARC2 spectrum.
The spectrum of ERAI displays a flat maximum from the lowest frequencies (90 day period) up to the 10-day period. It is apparently unable to distinguish the MJO-linked activity and the 10–25-day period fluctuations. This plateau is also consistent with the wavelet analysis of the 2009 season, where most of the variability arises at longer time scales. At synoptic scales, the spectrum peaks around a 7–5-day period and this can be related to an AEW-like mode, even though that period range is higher than what is generally expected. The contribution of scales shorter than 5 days is significantly reduced compared with obser-vations. This PSD analysis therefore confirms, as could be
inferred from the 2009 wavelet analysis, that ERAI experi-ences strong difficulties in representing the occurrence and, above all, the intensity of synoptic to mesoscale systems over the Sahel. That might be why it shows large dry biases at these latitudes (Nikulin et al. 2012).
The general picture of all RCM PSDs (see Fig. 11 in the Appendix) shows an “ERAI-like behavior” marked by a non-realistic excess of the low-frequency variability, especially over the continent. The intraseasonal maximum variability around 30–40-day in the observations is not sig-nificantly or distinctly reproduced by the RCMs. RACMO (Fig. 6c), CCLM (Fig. 6d) and HIRHAM5 (Fig. 6f) real-istically improve the PSD for both regions even though the tail of the spectrum (higher frequencies) is weaker. Some RCMs show a strong regional sensitivity by improv-ing the PSD for one region while degradimprov-ing it for another. For instance, CRCM5 in Fig. 6a shows, on the one hand, a remarkably ARC2-like PSD over the coast (left) and, on the other hand, a particularly misrepresented PSD over the continent. Finally, RCA4 (Fig. 6e) exacerbates the imbal-ance of the low-frequency to high-frequency ratio, consist-ently with its wavelet representation in Fig. 5g.
A quantitative assessment of the African monsoon rain-fall variability is shown in Fig. 7 with the intraseasonal partitioning (10–90 day, 3–10 day, 1–3 day in Fig. 7b) of the daily precipitation over the continental and coastal regions, from ERAI-driven RCM simulations, ERAI and observations. The climatological mean for each region is represented in Fig. 7a. First, the three observations are quite similar regarding both JJAS-mean rainfall and their intraseasonal variance distribution. The synoptic scales (i.e. 3–10 day and 1–3 day, by order of importance) explain more than 80 % of the precipitation intraseasonal vari-ability, consistently with the conclusions of Mathon et al. (2002) on the influence of MCSs on the seasonal rainfall amount. The highest frequency (1–3-day period) is almost twice as important as the lowest frequency (10–90-day period) whatever the region.
Regarding the RCMs, the large dispersion of JJAS aver-age among models (Fig. 7a) is closely related to the inaccu-rate partitioning of the intraseasonal variability between the lowest (10–90-day period) and the highest frequency (1–3-day period), with rather accurate values for intermediate frequency (i.e. 3–10-day period). Some studies (e.g. Sylla et al. 2010; Mariotti et al. 2014) have highlighted the ability of RCMs to represent AEWs based on 700–600 hPa, 3–10-day filtered meridional wind fluctuations. Our analysis reveals that, in terms of precipitation activity, this scale is not the most critical for RCMs. In fact, the models mainly underestimate the highest frequency (1–3 day period) and conversely overestimate the lowest (10–90-day) one, and their respective contributions to the precipitation variance. This is also the case for the ERAI products. However, this
Fig. 6 1989–2008 JJAS average of daily rainfall normalized power
spectral density (PSD), for ARC2, ERAI and each ERAI-driven RCM, averaged over two regions of the Sahel: the coastal region
[20°W–10°W; 12°N–17°N] (left) and the continental region [5°W– 5°E; 12°N–17°N]. The normalization was performed with respect to the total intraseasonal variance in each box and for each dataset
partitioning among various time scales is slightly better reproduced over the coastal area than over the interior of the Sahel area for the majority of RCMs (except ERAI). Consequently, their JJAS mean rainfall shows better agree-ment with the observations over the western WAM region than over the continental area. The assessment of such aspects in GCMs by Roehrig et al. (2013) has shown a more exacerbated tendency of GCMs to overestimate (underestimate) low (high) frequencies.
5 WAM onset/retreat and daily precipitation indices
This section aims to evaluate some specific aspects of the WAM intraseasonal variability, namely its onset/retreat and the resulting precipitation indices related to the occurrence, duration and intensity of daily events during the monsoon season. The day-to-day rainfall activity and its analysis are of crucial importance, not only for economic activity
throughout the Sahel, but also because this complements the analysis of the partitioning of low and high frequen-cies in the mean daily rainfall. There is a straightforward relationship between a model’s ability to handle the intra-seasonal spectrum and its performance regarding the daily precipitation statistics that account for the occurrence of events (e.g. onset/retreat and wet/dry days), their duration and their intensity (e.g. dry/wet spells and high quantiles). Thus, this section is used to propose a more precise quan-tification of how RCMs improve (or not) the intraseason-ality of the WAM with respect to their driving boundary conditions.
5.1 Monsoon climatological local onset‑retreat
As discussed in the methodology section, the onset-retreat is computed locally, at each grid point, following Diaco-nescu et al. (2015). Figure 8 presents the climatological local onset over the Sahel region from ARC2, ERAI and the six RCMs driven by ERAI. The onset patterns from
Fig. 7 1989–2008 JJAS mean precipitation (top, in mm day−1) and its intraseasonal variance ratio (bottom, in %) split into three sub-scales: 10–90-day band-pass (green), 3–10-day band-pass (purple),
and 3-day high-pass (blue). GPCP and TRMM data correspond to the 1998–2008 period
ARC2 recall the meridional structure of WAM precipita-tion. The first long-lasting rainy events start in early May (day 120) at around 10°N, then progressively move north-ward, leading to an onset in late June - early July at lati-tudes around 15°N. The date of onset occurrence is not zonally symmetric. In fact, east of 5°E, onset is delayed by about 2–3 weeks (for a given latitude) between 10°N and 16°N, with no onset occurring farther north around these longitudes. As highlighted by the seasonal-mean rainfall fields, ERAI also misrepresents the meridional structure of the onset over both coastal and continental areas. In fact, the onset is clearly delayed by at least one to three weeks over the Sahel area west of 5°E. Conversely, over central Africa (or east of 5°E), ERAI onset is too far north com-pared to ARC2, as eastern Niger and the greater part of Chad are areas where rainfall is known to be scarce, with a reduction in the occurrence of wet days and a delay in the onset over the 12–15°N bands in western Chad, and early onset in eastern Chad (Gachon et al. 2007).
The opposite (and unrealistic) behavior of onset over the continent given by the two Canadian RCMs (CRCM5 and CanRCM4) and RCA4 highlights the difficulty of simulat-ing both the right date and the right location of the onset over the continental Sahel area (Fig. 8c, d). For example, the CRCM5 onset appears too far south (even farther south than in ERAI) while CanRCM4 is too far north. Also, both RCMs have some difficulties representing the latitudinal gradient of rainfall installation over most continental areas. Over the coastal region, however, they represent the pat-terns quite well, especially CRCM5 which is quite similar
to ARC2. RCA4, despite its successful simulation of the seasonal-mean precipitation (at least over the continent), also misrepresents the meridional structure of the onset associated with rainfall patterns. However, it is worth not-ing its particularly good skill over the coastal region.
The other three RCMs perform quite well in general for the onset occurrence over the western Sahel. East of 5°E, however, they experience difficulties in simulating the onset dates obtained by observations. HIRHAM5, CCLM and RACMO handle the onset latitudinal variation pretty well, especially over the continental area, and have also shown a distinguishable intraseasonal power density spec-trum (PSDs in Fig. 6). Unlike CanRCM4, CRCM5 and RCA4, they capture the higher energy better at synoptic scales (AEW and MCS activity). Thus, this analysis rein-forces the importance of the day-to-day activity and the so-called meteorological scales for longer scale patterns such as the WAM onset. Some analyses with RCMs driven by GCMs (Fig. 12) reveal a notably smaller impact of the driver. This may lend support to conclusions by Crétat et al. (2013) that physical parameterizations are crucial if RCMs are to handle the day-to-day rainfall variability and by extension the onset. As also suggested by Flaounas et al. (2012), larger scale dynamics, such as the Indian monsoon, also control the WAM onset and, therefore, the skill of RCMs should improve if the driving GCMs handle these large-scale dynamics correctly.
Along with the onset, the monsoon rainfall retreat is also an intraseasonal event of interest, as it also controls the length of the rainy season. In fact, for agricultural
Fig. 8 Climatological (1989–2008) local onset date over the Sahel (in day of year) for ARC2, ERAI and ERAI-driven RCMs. The two red boxes
purposes, the consequences of a delayed onset can be reduced by a later retreat. Also, from a climate change point of view, it is important to understand whether the length of the rainy season (retreat date minus onset date) will change significantly (e.g. Biasutti and Sobel 2009). Figure 9 displays the Julian date of the local retreat occur-rence from observations, ERAI and RCMs driven by ERAI. ARC2 (Fig. 9a) reveals a progressive meridional retreat of the monsoon, first by the end of August from the northern latitudes (~18°N), then in mid to late Sep-tember for the 16–14°N bands. Finally, after mid-October, no more significant rainfall appears north of 10°N. There seems to be a later retreat near the coastal region, prob-ably due to the local humidity supplied by the low-level westerlies, and the role played by the Guinea plateau in inducing upward motion and local convection. In fact, over the Fouta Djallon area (Guinea), the convective activ-ity is found to increase in frequency and intensactiv-ity due to
the orographic forcing of water vapor in an area of con-vergence between monsoon and Harmattan fluxes, with heavy rain released over the southwest side of the Guinea plateau. In general, the retreat is better captured by RCMs than the onset. In fact, the abrupt northward shift of the monsoon at its onset time contrasts with the smooth retreat of the ITCZ. Hence, the rain belt retreat is a larger scale phenomenon that is less abrupt, with weaker meridional gradients than the onset, and so the retreat is less complex to represent by reanalysis and RCMs. Except CRCM5 (Fig. 9d), which tends to simulate a noticeably earlier retreat (10–20 days earlier north of ~14°N), all RCMs improve the simulated retreat with respect to ERAI, espe-cially CCLM, RACMO22T and RCA4 (although the last does not represent the onset particularly well). As for the onset, using GCMs as driving conditions (Fig. 13) for vari-ous RCMs generally keeps differences in the same range as when they are driven by ERAI.
Fig. 9 Same as Fig. 8, but for local retreat date
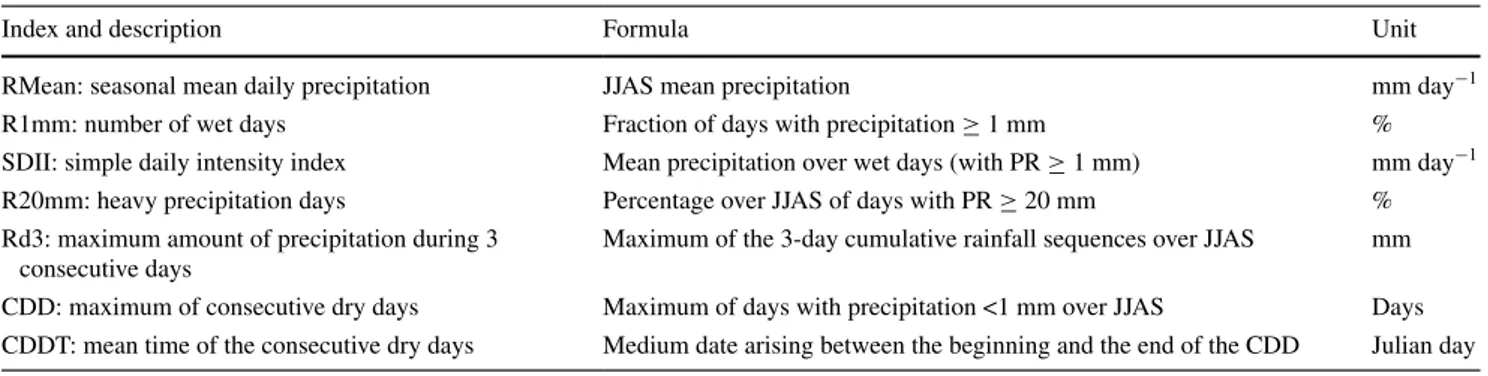
Table 3 Summary of the precipitation indices used to evaluate RCMs
Index and description Formula Unit
RMean: seasonal mean daily precipitation JJAS mean precipitation mm day−1
R1mm: number of wet days Fraction of days with precipitation ≥ 1 mm %
SDII: simple daily intensity index Mean precipitation over wet days (with PR ≥ 1 mm) mm day−1
R20mm: heavy precipitation days Percentage over JJAS of days with PR ≥ 20 mm %
Rd3: maximum amount of precipitation during 3 consecutive days
Maximum of the 3-day cumulative rainfall sequences over JJAS mm CDD: maximum of consecutive dry days Maximum of days with precipitation <1 mm over JJAS Days CDDT: mean time of the consecutive dry days Medium date arising between the beginning and the end of the CDD Julian day
Table 4 Mean values of daily precipitation indices (described in Table 3)
For each index, the left (right) values are computed over the coastal (continental) regions. The first (top) value is the JJAS average over different periods: 1989–2008 for ARC2 and ERAI-driven RCMs; 1983–2005 for ACR2 and GCM-driven RCMs and 1998–2008 for ARC2, TRMM and GPCP. The second (bottom value is the index temporal standard deviation. The reference ARC2 is highlighted in bold
RMean R1mm SDII CDD CDDT R3d R20mm 1989–2008 CANRCM4_ERAI 4.1 0.8 5.4 0.9 54.2 5.6 87.8 3.2 7.6 1.7 6.1 1.0 22 6 3 1 179 18 206 36 88.1 44.2 89.8 67.5 3.4 1.3 1.2 1.0 CRCM5_ERAI 4.0 0.8 1.6 0.4 32.6 4.1 26.9 4.1 11.6 2.2 5.2 1.1 28 9 22 7 182 23 214 39 67.9 22.0 28.2 12.5 5.2 1.9 0.6 0.6 HIRHAM5_ERAI 4.2 1.2 5.7 1.7 30.8 4.7 42.6 5.3 13.0 3.7 12.7 3.8 29 10 10 3 176 14 188 29 114.0 60.0 180.6 113.0 5.6 2.1 5.9 1.8 RCA4_ERAI 5.5 0.9 3.3 0.4 54.8 5.6 56.0 4.3 10.4 2.4 5.6 0.5 22 7 9 3 180 21 228 44 82.2 41.4 34.6 9.5 4.6 2.0 0.5 0.5 CCLM_ERAI 2.6 0.9 4.6 1.4 24.8 5.6 35.7 6.7 9.2 2.9 13.1 3.8 38 11 15 5 176 12 185 33 67.4 39.5 127.7 57.3 3.3 1.6 5.2 2.0 RACMO22T_ERAI 4.2 1.1 6.3 1.9 44.3 5.6 46.0 5.6 8.4 2.5 13.2 4.2 20 8 11 4 174 17 199 39 104.3 52.8 169.6 71.7 3.5 1.7 6.4 2.4 ERAI 2.5 0.6 1.5 0.4 38.9 5.5 33.9 7.8 5.8 1.0 3.6 0.8 29 8 22 8 171 179 40.8 20.0 27.6 18.6 0.8 0.7 0.2 0.3 ARC2 3.9 1.0 3.50.5 33.04.6 33.33.6 12.11.9 10.31.3 206 124 18017 21034 63.617.4 53.615.0 5.32.1 3.91.4 1983–2005 CANRCM4_ CanESM2 2.2 0.5 4.2 0.7 44.5 5.4 77.7 5.3 5.1 1.1 5.3 1.1 26 8 5 2 189 25 226 36 44.6 30.1 84.3 67.6 0.7 0.7 1.0 1.0 CRCM5_ CanESM2 2.4 0.7 1.2 0.3 24.0 4.3 21.3 4.0 9.4 2.2 5.0 1.2 38 12 30 9 189 26 222 36 49.2 20.2 25.1 11.7 2.7 1.5 0.4 0.5 CRCM5_MPI 4.4 1.1 1.5 0.4 34.0 5.0 25.6 4.9 12.3 2.8 5.1 1.2 21 8 24 10 177 24 195 31 82.6 30.5 29.6 16.6 6.0 2.3 0.5 0.6 HIRHAM5_EC-EARTH 3.9 1.1 4.8 1.4 35.3 6.8 44.9 5.9 10.6 2.7 10.5 3.0 21 8 10 4 193 28 196 37 94.0 51.4 127.9 84.1 4.5 1.9 5.1 2.2 RCA4_CanESM2 2.9 0.6 2.1 0.4 36.9 5.0 40.1 5.8 7.4 1.4 4.9 0.6 36 11 19 7 188 25 238 40 41.2 16.9 27.7 8.4 1.6 1.1 0.2 0.4 RCA4 _EC-EARTH 4.2 1.0 2.7 0.4 45.5 6.3 48.8 4.5 9.3 3.2 5.2 0.7 23 8 12 4 188 31 234 41 68.4 40.1 36.2 16.7 3.0 1.9 0.5 0.7 RCA4_MPI 5.0 1.0 2.9 0.6 47.2 5.3 47.5 5.8 12.0 4.5 5.7 1.0 22 7 12 5 181 24 204 41 96.8 54.6 45.1 25.9 4.7 1.9 1.0 1.0 CCLM_ EC-EARTH 2.2 0.9 5.5 1.6 23.5 6.5 48.6 6.9 9.0 3.2 11.5 3.2 30 11 11 4 192 30 190 37 72.2 48.9 143.3 65.5 2.4 1.5 5.4 2.2 CCLM_MPI 3.1 1.4 5.0 1.6 27.1 7.1 38.2 6.8 10.8 4.1 13.4 3.9 28 10 14 5 178 20 186 31 97.5 69.6 145.3 68.9 3.7 2.0 5.4 2.1 RACMO22T_ EC-EARTH 3.7 1.2 5.1 1.6 47.0 6.9 48.4 7.5 7.3 2.3 10.0 3.1 14 6 13 5 201 40 194 36 92.2 49.3 137.5 69.6 2.7 1.7 4.9 2.2 ERAI 2.5 0.6 1.6 0.5 38.3 5.4 36.2 7.6 5.8 1.0 3.6 0.8 30 9 19 7 172 179 40.4 18.9 27.9 19.0 0.8 0.7 0.2 0.3 ARC2 3.4 0.9 2.80.8 30.34.6 31.54.6 11.51.8 8.81.8 197 123 18019 20534 63.520.9 54.519.4 4.71.8 2.91.5 1998–2009 GPCP 4.7 0.7 3.8 0.6 39.5 5.0 30.86 3.92 11.4 1.4 11.7 1.3 16 5 13 3 175 15 198 32 65.5 13.1 57.9 12.6 7.3 2.0 6.3 1.5 TRMM 4.1 1.0 3.7 0.7 28.2 5.0 23.89 4.52 14.5 3.3 16.0 4.2 22 7 16 6 178 17 202 34 88.7 29.2 80.2 26.3 6.3 2.0 5.7 1.6 ARC2 3.9 1.0 3.50.5 33.04.6 33.33.6 12.11.9 10.31.3 206 124 17715 20935 63.617.4 53.615.0 5.32.1 3.91.4