RUNNING HEAD: Trajectories of Gambling Problems
Trajectories of Gambling Problems from mid-adolescence to age 30 in a general population cohort
Rene Carbonneau1,2,3, Frank Vitaro2,3,4, Mara Brendgen2,3,5, and Richard E. Tremblay2,3,6
Authors’ Affiliations: 1: Department of Pediatrics, University of Montreal; 2: Sainte-Justine Hospital Research Center; 3: Research Unit on Children’s Psychosocial Maladjustment, University of Montreal; 4: School of Psycho-education, University of Montreal; 5: Department of Psychology, University of Quebec in Montreal; 6: International Laboratory for Child and Adolescent Mental Health Development, INSERM U669 (Paris, France) and School of Public Health and Population Sciences, University College Dublin, Ireland.
document published in the APA journal. Please do not copy or cite without author's permission. The final article is available, upon publication, at: http://dx.doi.org/10.1037/adb0000102.
2 Abstract
Studies of gambling starting before adulthood in the general population are either cross-sectional, based on the stability of these behaviors between two time-points, or cover a short developmental period. The present study aimed at investigating the developmental trajectories of gambling problems across three key periods of development, mid-adolescence, early adulthood, and age 30, in a mixed-gender cohort from the general population. Using a semi-parametric mixture model, trajectories were computed based on self-reports collected at ages 15 (N=1882), 22 (N=1785), and 30 (N=1358). Two distinct trajectories were identified, one trajectory including males and females who were unlikely to have experienced gambling problems across the 15-year period, and one trajectory including participants likely to have experienced at least one problem over the last 12 months at each time of assessment. Participants following a high trajectory were predominantly male, participated frequently in three to four different gambling activities, and were more likely to report substance use and problems related to their alcohol and drug consumption at age 30. Thus, gambling problems in the general population are already observable at age 15 in a small group of individuals, who maintain some level of these problems through early adulthood, before moderately but significantly desisting by age 30, while also experiencing other addictive behaviors and related problems.
Abstract word count: 211
3
Trajectories of Gambling Problems From Mid-Adolescence to Age 30 in a General Population Cohort
A number of studies have examined the prevalence of problem gambling in the general
population (Cunningham-Williams, Grucza, Cottler et al, 2005; Franco, Maciejewski & Potenza, 2011; Jacobs, 2000; Kessler, Hwang, LaBrie et al, 2008; Petry, Stinson & Grant, 2005; Shaffer, Hall & Vander Bilt, 1999; Volberg, 1994). Some studies have also examined the association between problem gambling and other mental health problems, especially alcohol and drug use or abuse (Cunningham-Williams, Grucza, Cottler et al, 2005; Franco, Maciejewski & Potenza, 2011; Grant & Chamberlain, 2013; Kessler, Hwang, LaBrie et al, 2008; Lorains, Cowlishaw & Thomas, 2011; Lynch, Maciejewski, & Potenza, 2004; Petry, 2007; Petry, Stinson & Grant, 2005; Shaffer & Korn, 2002). However, most of these studies, although informative of the magnitude of gambling and its related comorbidity for
different populations at different ages, are cross-sectional in nature, and therefore do not address the issue of the development of gambling problems and their impact throughout the life of an individual.
Adolescent and Adult Problem Gambling: A Developmental Perspective
Reports converge to locate the onset of gambling problems in adolescence (Burge, Pietrzak & Petry 2006; Gupta & Derevensky, 1998; Rahman, Pilver, Desai et al, 2012; Vitaro & Wanner, 2011; Vitaro, Wanner, Ladouceur et al, 2004). Some longitudinal studies examined the evolution of gambling involvement and gambling problems beyond adolescence (Betancourt, Brodsky & Brown, 2012; Bray et al, 2014; Delfabbro, King & Griffiths, 2014; Delfabbro, Winefield & Anderson, 2009; Vitaro, Brendgen, Ladouceur & Tremblay, 2001; Vitaro et al, 2004; Wanner, Vitaro, Carbonneau &Tremblay, 2009; Winters, Stinchfield, Botzet & Anderson, 2002; Winters, Stinchfield, Botzet & Slutske, 2005). However, these studies are based on two times of assessment only or cover a short developmental period spanning from adolescence to early adulthood. This last point is particularly important, as this period of life is often considered as extended adolescence in modern societies (from the late teens
4
through the mid-20s; Arnett, 2004; 2007). The notion of extended adolescence implies that many individuals experience a longer transition to adulthood and postpone personal and social commitments to adult roles (e.g., marriage, parenthood, entering job market) (Arnett, 2005). Therefore, it remains virtually unknown how gambling problems evolve after they first emerge during (extended)
adolescence and once individuals enter (true) adulthood. Despite their restricted age-range, past studies generally concur that the early development of gambling is characterized by: 1) the existence of early and late starters, the former being more likely to be males and to display comorbid behavior problems such as impulsivity and substance use, and 2) an unstable course, with some proportion of stable problem gamblers that nevertheless varies across studies.
Understanding of the course of gambling problems from their early beginning to adulthood will help clarify a number of issues. For instance, the higher prevalence of individuals with problem
gambling among adolescents relative to adults is one of the most consistent epidemiological findings in the gambling literature (Barnes, Welte, Hoffman & Dintcheff, 1999; Derevensky, Gupta & Winters, 2003; National Research Council, 1999; Shaffer, Hall & Vander Bilt, 1999; Shaffer & Korn, 2002). More specifically, estimates of problem gambling are typically 2.5 to 3.0 times higher among
adolescents than among adults, for whom prevalence rates are estimated at 2.4% in Canada and 2.2% in the US over a 12-month period (Williams, Volberg & Stevens, 2012; Shaffer & Korn, 2002).
Consistent with these estimates, Shaffer and Hall’s (1996) meta-analysis reported prevalence rates ranging between 4.4% and 7.4% for pathological gambling in North American adolescents. As for lower (e.g., subclinical) levels of problem gambling, prevalence rates of up to 7.5% have been reported in adults (Welte et al, 2001) compared to prevalence rates ranging from 7.7% to 34.9% (Median: 15.5%) in adolescents (National Research Council, 1999). The discrepancies in the prevalence of pathological or problem gamblers between adults and adolescents may have resulted from a number of methodological differences between the studies, such as cohort effects (e.g., higher prevalence in
5
individuals born more recently) (Abbott & Clarke, 2007; Shaffer & Korn, 2002) or differences in the definition of problem gamblers (e.g., at-risk, subclinical, in-transition, excessive, disordered,
compulsive, pathological) (Ashley & Boehlke, 2012). Different results across studies could also be due to differences in the criteria used to establish prevalence rates (e.g., criteria differentially applicable to adolescents and adults or reports on past year versus lifetime activities, the first presumably
underestimating and the second overestimating the problems) (Gambino, 2006; Petry, 2005). Finally, differences could also have resulted from the use of different instruments (Derevensky & Gupta, 2000; 2006; Derevensky, Gupta & Winters, 2003; Ladouceur, Bouchard, Rhéaume et al, 2000).
However, differences in prevalence rates between adolescent and adult problem gamblers may also reflect true developmental effects. For example, some individuals could « mature out » of
gambling problems as they get older (Abbott & Clarke, 2007). Problem gamblers could also represent a heterogeneous group, with many post-adolescence desistors and some escalators, blurring the true development of problem gambling when aggregated data are considered (Delfabbro, Winefield
Anderson, 2009; Laplante, Nelson, Labrie & Shaffer, 2008; Slutske, Jackson & Sher, 2003). Although scarce, there is also evidence that problem gambling might only start later in adulthood for some individuals (Séguin, Robert, DiMambro et al, 2013). Finally, it is possible that there are only few escalators, desistors or newcomers from adolescence to adulthood, but that most are stable problem gamblers who experience fewer gambling problems during adulthood than during adolescence. In the absence of investigations tracking changes over a sufficiently long period of time, any conclusions about the validity of either explanation are difficult.
The Present Study
Prospective studies that are based on general population cohorts, start early in development and use consistent, multiple assessments over time, as well as individual-level analyses of changes in gambling behaviors, represent the best tool to examine the developmental course of problem gambling
6
over the lifespan (Abbott & Clarke, 2007; Delfabbro, 2013; Laudet & Volberg, 2002). In the present study, the term Problem Gambling referred to the general definition proposed by Neal, Delfabbro and O’Neil (2005) in their report to the Ministerial Council on Gambling of Australia, and adopted by Canadian’ Problem Gambling Research Centre of Ontario (Williams, West & Simpson, 2012): “Problem gambling is characterised by difficulties in limiting money and/or time spent on gambling which leads to adverse consequences for the gambler, others, or for the community”. To overcome the previously mentioned methodological issues, participants in the present study were followed from age 15 through age 30 years using similar instruments and the same criteria. This addresses the issue that variation in instruments or criteria from adolescence to adulthood might explain the decline in problem gamblers observed between the two developmental periods, as suggested by several authors (Barnes, Welte, Hoffman & Dintcheff, 1999; National Research Council, 1999; Shaffer, Hall & Vander Bilt, 1999; Shaffer & Korn, 2002). However, contrary to most previous studies, we did not adopt an a priori dichotomous categorical approach, but an empirical approach that allows the identification of
homogenous subgroups with distinct longitudinal profiles of gambling problems, known as trajectory groups (Nagin, 1999; 2005).
Specifically, the first goal of the present study was to identify the number and types of trajectory groups of gambling problems across three key periods of development: mid-adolescence (age 15), early adulthood (age 22), and young adulthood (age 30), in a mixed-gender cohort from the general
population. The second goal of the study was to test the convergent validity of the gambling problems trajectories identified in the first step, in addition to testing concurrent validity by comparing the trajectory groups on the mean levels of the gambling problem and gambling participation scores. To this end, we aimed to determine the extent to which these developmental trajectories were related to (other) addictive behaviors typically associated with problem gambling: tobacco, alcohol, and drug use. Previous studies have reported consistently high rates of comorbidity between gambling problems and
7
substance use or substance use disorders (SUD) (Cunningham-Williams et al, 2005; Grant & Chamberlain, 2013; Kessler et al, 2008; Lynch et al, 2004; Petry, 2007; Petry et al, 2005; Shaffer & Korn, 2002). Moreover, SUD was shown to be the most frequently co-occurring diagnosis of problem and pathological gamblers in a meta-analysis of population surveys (Lorains, Cowlishaw & Thomas, 2011). Thus, it would be expected that participants following a higher trajectory levels of gambling problems would also be more likely to engage in substance use.
Methods Participants
Participants (51.3% females) were part of the ongoing Québec Longitudinal Study of
Kindergarten Children (QLSKC), a representative sample of the children attending kindergarten in the province of Quebec, Canada, in 1986-1987 (Carbonneau, 2002; Rouquette, Côté, Pryor, Carbonneau, Vitaro, & Tremblay, 2012). The QLSKC was designed to identify early childhood factors affecting psychosocial adjustment, its developmental pathways and possible effects at school entry and over the long term for young Quebeckers. Children and their families were assessed for the first time at the age of 6 years and then yearly up to age 12 on a variety of dimensions regarding the child, the parents and their environment. At the ages of 15, 22 and 30 years an extensive protocol was administered to the participants using a structured interview (ages 15 and 22) or a self-administered Web-questionnaire at age 30 (or the corresponding paper version for those without internet access for 13.3% of sample). A total of 1882 participants were assessed at age 15, 1785 at age 22, and 1358 at age 30. Attrition was 26.4% from age 15-30 and 35.3% from age 22-30 for participants who did not have a valid assessment at age 15. All age 30 participants had valid information available from at least one prior evaluation (age 15: 78.7%; age 22: 84.0%), and 62.7% (N=851) of them were assessed at all three times. Gambling-related behaviors at ages 15, 22 and 30 years, as well as substance use and associated problems at age 30 years were used in the present study. In order to determine the extent to which remaining
8
participants at age 30 were different from those without data at age 30, both groups were compared on the primary measure of the present study, i.e., gambling problems (see data analysis).
Measures
Gambling problems. To assess gambling problems, we utilised adolescent and adult versions of the South Oaks Gambling Screen (SOGS) (Lesieur & Blume, 1987; Winters, Stinchfield & Fulkerson, 1993). Both instruments are based on the DSM-III, are validated against DSM-III-R criteria for pathological gambling, and have shown good reliability and internal consistency (Cox, Enns & Michaud, 2004; Lesieur & Blume, 1987; Stinchfield, 2002; Winters, Stinchfield & Fulkerson, 1993). The SOGS is a 20-item scale widely used with adult populations, whereas the SOGS-RA assesses gambling problems in adolescents using 12 items that are similar to those in the SOGS. The essential difference between the two instruments lies in the fact that the indicator «borrowing money to gamble or to pay gambling debts» is scored as a single item in the SOGS-RA, but uses 9 different items in the SOGS, representing possible sources for the money borrowed. For instance, borrowing money once from three different sources (e.g., spouse, relatives, credit cards) in the last 12 months would warrant a score of 1 in the SOGS-RA but a score of 3 in the SOGS. This discrepancy is avoided by summing up and recoding the 9 SOGS items into a single dichotomous (0/1) item, similar to the SOGS-RA. This simple procedure resulted in an identical set of items at each time of assessment, which was a
requirement in order to compute developmental trajectories of gambling problems (see data analysis) across the three time-periods, and circumvent the previously discussed methodological issues.
Consequently, Gambling Problems were based on the 12 following items: Try to win back money you have lost; claim to be winning money gambling but weren’t; feel you have a problem with gambling; gamble more than you intended to; been criticized for your betting or told you had a problem; feel guilty about the way you gamble; feel like you would like to stop gambling but did not think that you could; hide signs of betting or gambling from people in your life; have money arguments centered on
9
your gambling; borrowed from someone and not paid them back as a result of your gambling; lost time from work or school due to gambling; borrowed money to gamble or to pay gambling debts.
All gambling items referred to the last 12 months prior to assessments. Coded yes or no (1, 0), the items were summed up, resulting in a 12-point scale for gambling problems. Cronbach’s alpha was .76, .77, and .80, respectively, at ages 15, 22 and 30 years. For comparison purposes, alphas were also computed for the original 20-item SOGS-scale. Results showed internal consistency coefficients of .75 and .89, respectively, at age 22 and 30 years. Because the value of alpha typically increases with the number of items in a scale (Clark & Watson, 1995), the similarity of the coefficients computed for the 12-item (11+1) and the 20-item (11+9) scales at both ages supports the notion that the 12-item scale is compatible with the original 20-item SOGS. This conclusion was also supported by the correlations between the 12-item and 20-item scales, with rho=1.0, p=.000 at both age 22 and age 30. In the present study, the coding of the SOGS problem scores proposed by Lesieur and Blume (1987) was used: 0 = No problem with gambling; 1-4 = Some problems with gambling; 5 or more = Probable Pathological Gambler.
Gambling frequencies and variety. The SOGS and the SOGS-RA also include a list of different gambling activities for which the participant indicates whether he or she has never, less than monthly, monthly, weekly, or more than once per week, participated in each activity over the last 12 months prior to assessment. This information was used to determine the frequency and variety of gambling over the past year. Variety refers to the number of different gambling activities (for money) reported and was based on 9 to 12 different activities, depending on the time of assessment, to reflect the changing landscape of gambling activities available from adolescence to adulthood: tossing coins; playing cards; playing skill games (e.g., pool, bowling); betting on sports; betting on races; playing bingo; playing dice games ; betting in gambling machines; buying any lottery tickets; playing other games ; going to casinos; playing the stock and/or commodities market; and playing games on the
10
internet. Variety of gambling was calculated as the sum of gambling activities a participant had ever engaged in over the past 12 months (Age 15: mean =1.60, SD=1.61, min=0, max=8; Age 30: mean =1.43, SD=1.17, min=0, max=6). Frequency of gambling over the last year was computed as a score reflecting gambling at least once a week (10.9% and 12.2% of participants, respectively, at age 15 and 30) versus lower gambling frequency. To avoid confounding due to variety of gambling activities, frequency scores were coded such that engaging in at least four different gambling activities at least once per month each would equal one gambling activity practiced at least once per week.
Substance use behaviors. Selected indicators of tobacco, alcohol and drug use were assessed at age 30 to examine their association with trajectories of gambling problems. Drug use referred to any type of illicit drugs: marijuana, hashish, cocaine, amphetamine, ecstasy, opiates, heroin, LSD, PCP, speed, etc. Information on quantity and frequency of use over the last 12 months was retained for all three substances. Given the potential impairment involved with substance use, additional information was examined on possible problems related to alcohol and drug use: problems and criticism from others related to one’s use, risky behaviors under the influence, and having received or needing help regarding personal use. Problems related to either alcohol or drug use included the 5 following indicators: fighting while under the influence, subject to police intervention/arrest, taken to a hospital or a treatment center, experienced emotional difficulties, or noticed substantial decrease in activities as a result of one’s use. Criticism from others related to either alcohol or drug use included the five following indicators: being criticized by family members, spouse/partner, friends, colleagues from work, or other people, as a result of one’s substance use. Risky behaviors under the influence included the three following indicators: going to school/work while drunk or high, driving a motor vehicle while drunk or high, or practicing sports under the influence. Finally, having received or needing help
regarding personal use included the three following indicators: you tried to reduce personal use but were unable to, asked people around you or professionals for help, or received treatment for personal
11
use. Similar to the method described above for the coding of the frequency of gambling, dichotomized impairment indicators were computed. Indicators that were originally coded as yes/no reflected
whether either one of their constituting behaviors had occurred and were retained in their original form. For reasons of parsimony, indicators that were originally based on multiple response options were dichotomized to represent the severity of substance use or the impairment related to using alcohol or drugs (see Table 1). This strategy provided more intuitively interpretable results and helped harmonize the presentation of substance use-related results.
Data Analysis
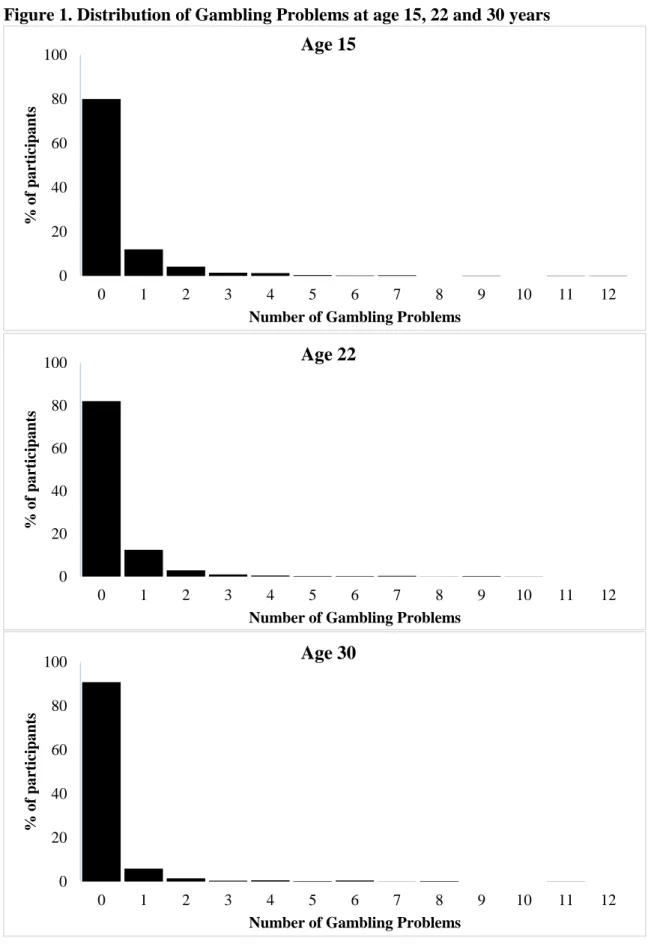
Measures collected with the 12-item problem gambling scale were first used to compute scores based on an identical set of items at each time of assessment. The observed distribution of the resulting scores did not meet the requirement of normal distribution for trajectory analysis with continuous data (Figure 1): the proportion of participants reporting one gambling problem reached 20.0%, 17.9% and 9.2%, respectively, at age 15, 22 and 30 years; 4.1%, 2.5% and 1.5%, respectively, of participants reported two problems, and 3.2%, 1.7%, and 1.8%, respectively, of participants reported three
problems or more (detailed results regarding raw scales at the three times of assessment are presented in the first part of the results section). In consequence, the gambling problem scales were dichotomized, based on having at least one gambling-related problem or none. The choice of this cut-off point was made based on: 1) the population-based nature of our cohort, 2) the restricted distribution of the data, and 3) the absence of a consensus in the field for standard criteria defining at-risk or low-level problem gambling, as opposed to non-problem gambling (Derevensky & Gupta, 2006; Petry, 2005; Winters, Stinchfield, Botzet & Slutske, 2005). This threshold corresponds to Level 2 (some gambling-related problems) of the Levels terminology reported in the gambling research literature (Petry, 2005; Shaffer, Hall & Vander Bilt, 1999), and includes both gambling problems categories defined on the
SOGS-12
score sheet (e.g., score 1-4 = Some problems with Gambling; score 5 or more = Probable Pathological Gambler) (Lesieur & Blume, 1987).
Semi-parametric mixture modeling designed to identify distinctive developmental trajectories within the population and across times of assessment was performed using the three waves of gambling data. This method allows the identification of the best trajectory model describing the participants’ course across times of assessment, even when measurements are unequally spaced. This analysis also accommodates missing data, such that participants with incomplete assessments across repeated measures can be included and all values available at each time are used for the trajectory estimation (Jones et al, 2001; Nagin, 1999; 2005). The model allows estimating the optimal number of subgroups displaying a similar behavior pattern (e.g., gambling problems) across time as well as the shapes of these different trajectories (e.g., linear, quadratic). The optimization method is based on the Bayesian Information Criteria (BIC) as the indicator of the best fitting model. After this initial step, concurrent validity of the trajectory groups from the selected best fitting model was evaluated by comparing the groups in regard to mean levels of the original gambling problem scales and gambling participation. The association between the trajectories and substance use behaviors collected at the age of 30 years was also examined. For this purpose, gambling problems trajectories were used to predict each dichotomized indicator of substance use with a series of logistic regressions (except for predicting the number of cigarettes smoked per day, for which ANOVA was used). These analyses were based on all participants for whom valid information was available on trajectories and age 30 substance use
indicators (N=1358). Thus, the estimation of gambling problem trajectories included all individuals with at least two measurement times, including age 30 assessment. In order to determine the
representativeness of the final sample, participants who dropped out of the study or who could not be traced after the first assessment at age 15 were compared to those who were assessed up to age 30 in terms of their probability of engaging in gambling problems (based on the dichotomized scale at age
13
15). The difference between these two groups was not significant. Similarly, there was no significant difference in gambling problems at age 22 between participants who were assessed at both ages 22 and 30 and those who were not assessed at age 30. Finally, there were no differences in gambling problems at age 30 between participants assessed at age 15 and 30, participants assessed at age 22 and 30, or those assessed at all three ages.
Results Gambling Problems
As can be expected in a general population cohort, the majority of participants (80.0%, 82.1% and 90.8%, respectively) did not report gambling problems at the three times of assessment (Figure 1). These proportions, along with the mean number of problems reported at the three assessment times (means = 0.37, 0.31 and 0.18, respectively, at ages 15, 22 and 30), suggest a decrease in participants’ gambling problems between adolescence and age 30, especially after the age of 22. Interestingly, the proportion of participants reporting five indicators of gambling problems or more (i.e., the SOGS’ Probable Pathological Gambler score) remained stable across the three times of assessment (i.e. 1.1%, 1.0%, and 0.9%, respectively, at ages 15, 22 and 30). Spearman’s Rho correlations across time for the number of problems were .24 (p<.01) between age 15 and age 22, .23 (p<.01) between age 22 and 30, and .18 (p<.01) between age 15 and age 30, indicating a significant, albeit relatively modest stability.
Trajectories of Gambling Problems
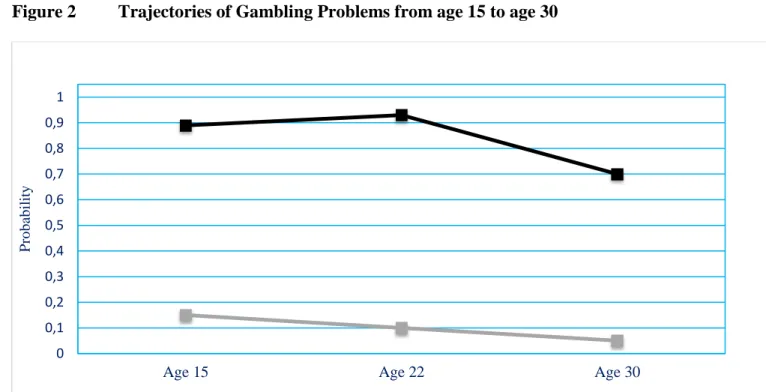
The best model of gambling problems from age 15 to 30 years yielded two distinct trajectories (BIC= -2102.34), shown in Figure 2. A first group, who followed a Low decreasing trajectory and who represented 92.6% of the sample, described participants with a very low probability (.15, .10, and .05, respectively, at ages 15, 22 and 30) of having experienced any problem related to their gambling activities over the last 12 months. The second group followed a High decreasing trajectory,
14
one gambling-related problem at each of the three assessment times, with probabilities ranging from .89 to .93 to .70, respectively, at ages 15, 22 and 30. In comparison, the second-best model-solution according to the BIC included three trajectories (BIC= -2117.50), essentially by splitting the lower group in two trajectories with probabilities below .20 at each time of assessment, keeping the High trajectory virtually identical. However, the substantially lower fit (∆ BIC=15.16) provided «very strong» evidence against this alternative model; Jones et al, 2001; Kass and Raftery, 1995). The two-group trajectory model thus clearly showed the best fit to the data.
Importantly, the decrease in probabilities observed from age 22 (.93) to age 30 (.70) for
participants of the High trajectory appeared to be statistically significant (McNemar X2(df=1) = 5.30, p < .05). Significant sex differences were also observed (X2(df=1) = 23.86, p<.001): males were over two times more likely to be on a High trajectory than females (10.1% vs 4.7%, respectively). The average number of gambling problems on the 12-item scale for participants following the High trajectory was 1.83, 1.90 and 1.66, respectively, at ages 15, 22, and 30, and the maximum number of problems reported were 12, 10, and 11. In terms of gambling participation, the proportion of these individuals who gambled «weekly or more often» already reached 31.5% at age 15, compared to 9.5% for
participants in the Low trajectory, a significant difference (p<.001) that remained significant at age 30 (40.0% compared to 12.6% (p<.001), respectively, for High and Low participants). Finally, participants following the High trajectory participated, on average, in a wider variety of gambling activities than their Low trajectory peers: 3.19 versus 1.57 (p<.001) at age 15 and 3.93 versus 1.82 at age 30 (p<.001), respectively.
Link Between Gambling Problem Trajectories and Substance Use at Age 30 Years
As a means to validate the gambling problems trajectories identified in our sample, the
predictive associations between these trajectories (which ranged from age 15 to age 30) and the use or abuse of different substances at age 30 were examined using logistic regressions with the dichotomized
15
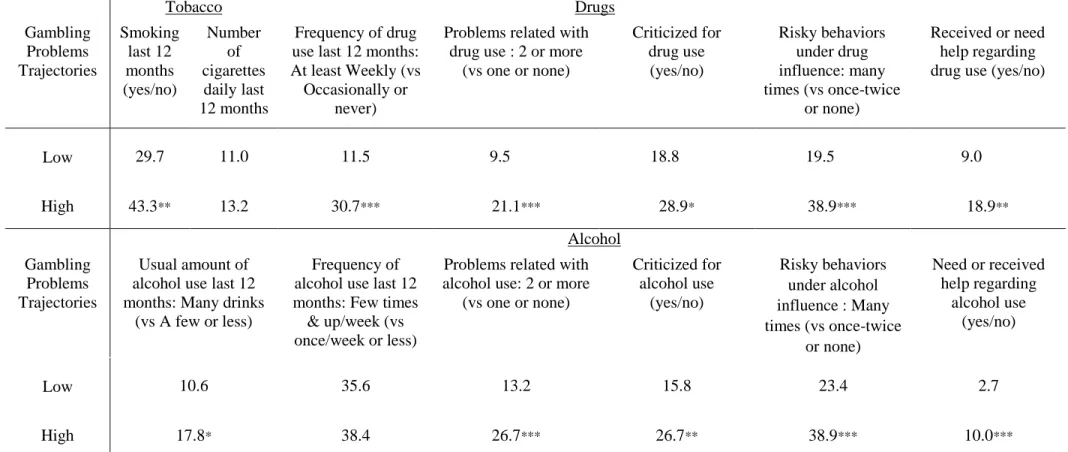
substance use scores as outcomes and using the Low trajectory as the comparison group. Because tobacco use was a continuous variable based on the number of cigarettes smoked per day, ANOVA was used to compare the trajectory groups in regard to this variable. Table 1 shows the results for different indicators of tobacco, alcohol and drug use retained for this purpose in the present study. A general trend was observed for participants following a High trajectory to be more likely to use substances than their counterparts from the Low trajectory. This difference was significant for tobacco use (OR= 1.81, 95% CI [1.18, 2.80], p =.007) and for using drugs weekly (vs occasionally or never: OR= 3.42, 95% CI [2.11, 5.56], p <.001), but not for alcohol use. In terms of the amount of substances used, there were no observable differences between participants following different trajectories of gambling problems for tobacco, but High participants were more likely than their Low trajectory peers to have many drinks as their usual consumption per occasion (OR= 1.82, 95% CI [1.03, 3.23], p =.039). No specific
information on the consumed amount was available for drug use. Information collected on problems related to alcohol and drug use provided a strikingly similar picture for each substance. For alcohol, High participants were more likely to report 2 or more problems (vs one or none) related with alcohol use than their Low trajectory peers (OR= 2.39, 95% CI [1.46, 3.92], p = .001). They were also more likely to have been criticized by people close to them for their alcohol use (OR= 1.95, 95% CI [1.19, 3.17], p =.008), to have engaged many times or more often (vs once-twice or never) into risky behaviors under the influence of alcohol (OR= 2.09, 95% CI [1.34, 3.25], p = .001), and to have
received or to need help regarding their personal use (OR= 3.98, 95% CI [1.85, 8.55], p <.001). Results on corresponding behaviors related to drugs indicated a similar pattern: High participants were more likely to report 2 or more problems related to their drug use (OR= 2.54, 95% CI [1.48, 4.37], p = .001), to have been criticized by people close to them for their drug use (OR= 1.75, 95% CI [1.85, 8.55], p= .021), to have engaged many times or more often into risky behaviors under the influence of drugs
16
(OR= 2.62, 95% CI [1.68, 4.10], p <.001), and to have received or to need help regarding their personal use (OR= 2.36, 95% CI [1.35, 4.15], p =.003).
Discussion
Previous studies of gambling starting before adulthood in the general population have been restricted to cross-sectional investigations, to the examination of behavior stability across two time points, and to short developmental periods. The present study extended the scope of previous investigations by identifying the longitudinal trajectories of gambling problems across three critical developmental periods – i.e., mid-adolescence (age 15), the beginning of adulthood (age 22), and young adulthood (age 30) – in a mixed-gender general population cohort. Self-reported gambling problems were best described by a two-group trajectory model. Essentially, one trajectory group included males and females who were not likely to have experienced problems at any time of
assessment across the 15-year period from mid-adolescence to young adulthood, and another trajectory group included a minority (7.4%) of participants who were likely to report at least one indicator of gambling problems over the last 12 months at ages 15, 22 and 30. This proportion is in line with previous studies of Canadian population cohorts that defined problem gambling as having reported at least one gambling problem (Ladouceur, 1996).
Also consistent with previous findings (Abbott & Clarke, 2007; Scholes-Balog, Hemphill, Dowling & Toumbourou, 2014; Stinchfield, & Winters, 1998; Winters et al, 2002), more males than females followed a High trajectory, in a 2:1 ratio (10.1% vs 4.7%). As expected, participants in the High trajectory group reported a higher frequency of gambling participation and a wider variety of gambling activities, both at the beginning and at the end of the trajectories period (i.e., at ages 15 and 30 years). These observations are consistent with previous reports examining the association between the characteristics of gambling participation and gambling problems in different populations
17
(Cunningham-Williams et al, 2005; Holtgraves, 2009; Kessler et al, 2008; Volberg, 1994). Results of the analyses comparing trajectories with respect to indicators of substance use showed consistent associations with tobacco, drugs and alcohol use and related impairment. In particular, individuals who experienced gambling-related problems were more likely to experience problems related to alcohol and drug use. This association with substance use is clearly in line with previous findings (Cunningham-Williams et al, 2005; Grant & Chamberlain, 2013; Kessler, Hwang, LaBrie et al, 2008; Lorains, Cowlishaw & Thomas, 2011; Petry, 2007; Petry et al, 2005; Shaffer & Korn, 2002). However, participants in our study who followed a High trajectory manifested on average fewer gambling
problems than in other studies. This suggests that a low, subclinical level of gambling problems may be sufficient to identify participants who might also experience or be at risk of experiencing other
maladjustment problems, especially those related to addiction. In that respect, individuals with «only» some gambling-related problems warrant consideration for eventual assistance or prevention initiatives.
In summary, the profile of problem gamblers emerging from our results with a population-based cohort is characterized by: 1) an early manifestation of gambling problems, 2) some stability of
gambling problems from mid-adolescence to age 30, 3) a predominance of males, 4) frequent
participation in three to four different gambling activities, and 5) a greater likelihood than non-problem gamblers to use substances and to experience problems related to their consumption. The absence of a steeply decreasing trajectory (i.e., from a very elevated likelihood to experience gambling problems at age 15 to a very low level in adulthood) helps resolve some of the previously mentioned discrepancies between adolescent and adult samples in the prevalence of problem gamblers. Specifically, the
apparent decrease in prevalence rates from adolescence to adulthood does not seem to result from the existence of a group of desistors. Instead, the significant decrease in the probability of experiencing gambling problems from age 22 to age 30 (slipping from .93 to .70) for individuals in the High trajectory group, combined with the overall decrease in the number of gambling problems over the 15
18
year interval, suggests that, while problem gamblers experience fewer problems over time, they do not desist from gambling. In that respect, the High trajectory identified in in our study confirms the
stability between adolescence and early adulthood observed in some studies (Stinchfield, & Winters, 1998; Winters et al, 1993; 2002) and supports the interpretation of this period as extended adolescence characterised by the persistence of experimentation (Arnett, 2004; 2005). At the same time, however, the High trajectory pattern also confirms the decrease in gambling problems between the (extended) period of adolescence and adulthood observed in other studies (e.g., “maturing out” of gambling problems) (Delfabbro, Winefield & Anderson, 2009; Laplante et al, 2008; Winters et al, 2005).
Our results did not reveal a group of individuals who became problem gamblers in adulthood without experiencing similar problems in adolescence. That is not to say that such a group does not exist, but rather that it did not emerge from our population-based cohort by the age of 30. Importantly, the trajectory method, which is based on the identification of subgroups with distinct behavior patterns over time, rules out the possibility that these findings might be attributable to extreme individual variations within the at-risk group (e.g., some completely desisting, others severely escalating)
(Delfabbro, Winefield & Anderson, 2009; Winters et al, 2005). Evidently, dichotomizing the gambling problem scale, and using the lowest threshold in the field (i.e., some gambling problems) to determine the presence of problems, resulted in aggregating individuals with a range of severity within the same group. Although this strategy did not allow us to study the developmental course of high risk or clearly pathological gamblers, our dichotomization strategy was based on the fact that, at any given time, few individuals reported more than one indicator of gambling problem in our general population cohort. Thus, the lack of discrimination within the group of participants likely to have experienced problems from age 15 to age 30 could be considered a feature of the developmental course of gambling problem in our cohort, as much as a limitation for studying problem gamblers.
19
While compatible with previous reports that gambling problems fluctuate considerably within individuals over time, our results suggest that this fluctuation remains within the range of « one
indicator of gambling problems or more », at least between mid-adolescence and early adulthood and to a large extent also up to age 30. It should also be mentioned that the trajectories were based on data collected using the same items common to the SOGS-RA and the SOGS at the three times of assessment. This suggests that the decrease observed in gambling problems at age 30 could not be explained by the use of different instruments. Thus, the maintenance of some level of gambling problem from mid-adolescence to the early 20s and the subsequent significant, albeit moderate decrease observed at age 30 seem to be a developmental feature of gambling problems in our general population-cohort. Overall, these observations support the idea that the prevention of gambling
problems should start in adolescence, and probably even earlier, as recent reports suggest that the onset of gambling would take place somewhere in late childhood-early adolescence (Burge, Pietrzak & Petry 2006; Gupta & Derevensky, 1998; Rahman et al, 2012; Vitaro & Wanner, 2011; Vitaro et al, 2004). Thus, preventing an escalation to problem gambling should not be postponed to later developmental periods, when the consequences of gambling (e.g., job loss, mental health problems, marital failure, domestic violence, dysfunctional families, child neglect, crime) may become even more dramatic for individuals and their families (Chou, & Afifi, 2011; Dussault, Brendgen, Vitaro, Wanner & Tremblay, 2011; Folino & Abait, 2009; Grant & Chamberlain, 2013; Kalischuk , Nowatzki, Cardwell, Klein & Solowoniuk, 2006; Kessler et al, 2008; Lorains, Cowlishaw & Thomas, 2011; Petry, Stinson & Grant, 2005; Shaffer & Korn, 2002; Spapens, Littler & Fijnaut, 2008; Wanner et al, 2009).
Strengths, Limitations and Conclusions
The present study had a number of assets: longitudinal trajectories of gambling problems across three critical developmental periods - mid-adolescence, early adulthood, and age 30 - in a large mixed-gender, general population cohort, and a comparison of trajectory-groups in regards to a series of
20
indicators of substance use and related impairment. Despite these strengths, our study is not without limitations. First, any prospective, 15-year longitudinal study cannot avoid at least some level of attrition. Preliminary analyses comparing participants who dropped out of the study after their initial assessment and those who were part of the study up to age 30 did not reveal differences in the probability of having experienced gambling problems at age 15. Moreover, as described earlier, all participants with a valid assessment at one time-point contributed to the trajectory analysis. Thus, the loss of participants likely mainly affected the validation test based on the age 30 assessment of
substance use, which included participants with at least two (37.3%) or three (62.7%) assessment times. Attrition might have led to an underestimation of the severity of gambling profiles and associations with substance use.
Second, as discussed above, the decision to dichotomize the gambling problem scale, although based on a rationale originating from the SOGS-scoring procedure and the Levels-terminology used by many scholars in the field, could be viewed as over-inclusive. However, the distribution of gambling problems in our cohort did not allow for the discrimination of subgroups of more severe problem gamblers, which might be a limitation of general population studies that do not include several thousands of participants at the outset. The consequence of this decision for the estimation of the link between trajectories and substance use would likely be more conservative results, by lowering the number of substance use-related problems among our (non-extreme) High-trajectory participants.
Third, regarding gambling participation, the different number of gambling activities (9 to 12) included in adolescent and adult assessments to reflect the changing landscape of available
opportunities might have influenced the stability of gambling involvement observed for High
participants. This possible ‘period’ effect might even have affected our trajectory analysis. However, the final report of the Public Sector Gaming Study Commission (Public Sector Gaming Study
21
concomitant increase in pathological gambling within the general population (partly by cutting into illegal gambling and friendly betting). On this basis, we tend to believe that the individuals in our study who reported participating in newly available games likely moved their interest from one type of activity to another as they grew older and sought out different gambling opportunities, thus maintaining a similar level of participation. Finally, the present study was limited to a population of
North-American individuals raised in a French-speaking culture. Thus, replications are needed to determine generalizability of the present results to other cultures.
These limitations notwithstanding, we believe that the present, population-based, longitudinal-prospective study on the trajectories of gambling problems from mid-adolescence to age 30 sheds new light on the developmental course of gambling problems through critical periods of development in at least two important ways. First, individuals at risk for gambling problems are already involved in problem gambling by mid-adolescence. Second, these individuals are likely to experience associated problems such as substance misuse or abuse. These associated problems can create a series of cascade or spiraling adverse effects if not addressed through early intervention.
22
References
Abbott, M.W., & Clarke, D. (2007). Prospective problem gambling research: Contribution and potential. International Gambling Studies, 7(1), 123-144.
Arnett, J.J. (2004). Emerging adulthood: The winding road from late teens through the twenties. Oxford: Oxford University Press.
Arnett, J.J. (2005).The developmental context of substance use in emerging adulthood. Journal of Drug Issues, 35, 235-254.
Arnett, J.J. (2007). Emerging adulthood: What is it, and what is it good for? Child Development Perspectives, 1, 68-73.
Ashley, L.L., & Boehlke, K.K.(2012). Pathological gambling: A general overview. Journal of Psychoactive Drugs, 44(1), 27–37.
Barnes, G. M., Welte, J. W., Hoffman, J. H., & Dintcheff, B. A. (1999). Gambling and alcohol use among youth: Influences of demographic, socialization, and individual factors. Addictive Behaviors, 24, 749-767.
Betancourt LM, Brodsky NL, Brown CA, McKenna, K.A., Giannetta, J.M., Yang, W., Romer, D. & Hurt, H. (2012). Is executive cognitive function associated with youth gambling? Journal of Gambling Studies, 28, 225-238.
Bray, B.C., Lee, G.P., Liu, W., Storr, C.L., Ialongo, N.S., & Martins, S.S. (2014). Transitions in gambling participation during late adolescence and young adulthood. Journal of Adolescent Health, 55, 88-94.
Burge, A. N., Pietrzak, R.H., & Petry, N.M. (2006). Pre/early adolescent onset of gambling and
psychosocial problems in treatment-seeking pathological gamblers. Journal of Gambling Studies, 22, 263–274.
23
Carbonneau, R. (2002). Developmental trajectories leading to delinquency and substance use in adolescence: Results from Quebec studies. In: Brochu, S., DaAgra, C. & Cousineau, M.-M. (Eds), Drugs and crime deviant pathways. London: Ashgate.
Chou, K.L., & Afifi, T.O. (2011). Disordered (pathological or problem) gambling and axis I psychiatric disorders: Results from the National Epidemiologic Survey on Alcohol and related conditions. American Journal of Epidemiology, 173(11), 1289-1297.
Clark, L.A. & Watson, A.D. (1995). Constructing validity: Basic issues in objective scale development. Psychological Assessment, 7, 309-319.
Cox, B. J., Enns, M. W., & Michaud, V. (2004). Comparisons between the South Oaks Gambling Screen and a DSM–IV–based interview in a community survey of problem gambling. Canadian Journal of Psychiatry, 49, 258–264.
Cunningham-Williams RM, Grucza RA, Cottler LB, Womack SB, Books SJ, Przybeck TR, Spitznagel EL, Cloninger CR. (2005). Prevalence and predictors of pathological gambling: results from the St. Louis personality, health and lifestyle (SLPHL) study. Journal of Psychiatric Research, 39, 377–390.
Delfabbro, P.H. (2013). Problem and pathological gambling: A conceptual review. The Journal of Gambling Business and Economics, Vol. 7(3), 35-53.
Delfabbro, P.D., King, D. & Griffiths, M.D. (2014). From adolescent to adult gambling: An analysis of longitudinal gambling patterns in South Australia. Journal of Gambling Studies, 30, 547–563. Delfabbro, P.H., Winefield, A.H., & Anderson, S. (2009). Once a gambler – always a gambler? A
longitudinal analysis of gambling patterns in young people making the transition from adolescence to adulthood. International Gambling Studies, Vol. 9(2), 151–163.
Derevensky, J.L., & Gupta, R. (2006). Measuring gambling problems among adolescents: current status and future directions. International Gambling Studies, Vol. 6(2), 201–215.
24
Derevensky, J.L., & Gupta, R. (2000). Prevalence estimates of adolescent gambling:
A comparison of the SOGS-RA, DSM-IV-J, and the GA 20 questions.Journal of Gambling Studies, Vol. 16, p.227-251.
Derevensky, J. L., Gupta, R., & Winters, K. (2003). Prevalence rates of youth gambling problems: are the current rates inflated? Journal of Gambling Studies, 19(4), 405–425.
Dussault,F., Brendgen, M.,Vitaro, F., Wanner, B., & Tremblay, R.E. (2011). Longitudinal links between impulsivity, gambling problems and depressive symptoms: a transactional model from adolescence to early adulthood. Journal of Child Psychology and Psychiatry, 52(2), 130-138.
Folino, J.O., & Abait, P.E. (2009). Pathological gambling and criminality. Current Opinion in Psychiatry, 22(5), 477-481.
Franco, C.A., Maciejewski, P.K., Potenza, M.N. (2011). Past-year recreational gambling in a nationally representative sample: Correlates of casino, non-casino, and both casino/non-casino gambling. Psychiatry Research, 188, 269–275.
Gambino, B. (2006). A Comment on the utility of prevalence estimates of pathological gambling. Journal of Gambling Studies, 22, 321-328.
Grant, J.E., Chamberlain, S.R. (2013). Gambling disorder and its relationship with substance use disorders: Implications for nosological revisions and treatment. The American Journal on Addictions, XX, 1–6.
Gupta, R., & Derevensky, J.L. (1998). Adolescent gambling behavior: A prevalence study and examination of the correlates associated with problem gambling. Journal of Gambling Studies, Vol. 14(4), 319-345.
Holtgraves T: Gambling, gambling activities, and problem gambling. Psychology of Addictive Behaviors, 2009; 23: 295–302.
25
Jacobs, D.F. (2000). Juvenile gambling in North America: An analysis of long term trends and future prospects. Journal of Gambling Studies, 16, 119-152.
Jones, B. L., D. S. Nagin, and K. Roeder. 2001. A SAS procedure based on mixture models for estimating developmental trajectories. Sociological Methods & Research 29: 374–93.
Kalischuk , R.G., Nowatzki, N., Cardwell, K., Klein, K., & Solowoniuk, J. (2006). Problem gambling and its impact on families: A literature review. International Gambling Studies, 6:1, 31-60. Kass, R. and Raftery, A. (1995). Bayes factors. Journal of the American Statistical Association, 90,
773-795.
Kessler, R.C., Hwang, I., LaBrie, R., Petukhova, M., Sampson, N.A., Winters, K.C., Shaffer, H.J. (2008). The prevalence and correlates of DSM-IV Pathological gambling in the National Comorbidity Survey Replication. Psychological Medicine, 38(9): 1351–1360.
Ladouceur, R. (1996). The prevalence of pathological gambling in Canada. Journal of Gambling Studies, 12, 129–142.
Ladouceur R., Bouchard, C., Rhéaume, N., Jacques, C., Ferland, F., Leblond, J. & Walker, M. (2000). Is the SOGS an accurate measure of pathological gambling among children, adolescents and adults? Journal of Gambling Studies, 16, 1-24.
Laplante, D.A., Nelson, S.E., Labrie, R.A., & Shaffer, H.S. (2008). Stability and progression of disordered gambling: Lessons from longitudinal studies. Canadian Journal of Psychiatry, 53(1), 52-60.
Laudet, A.B., & Volberg, R.A. (2002) Future directions for research into the psychological determinants of problem gambling patterns. International Gambling Studies, 2(1), 85-100. Lesieur, H. R., & Blume, S. B. (1987). The South Oaks Gambling Screen (SOGS): A new instrument for
26
Lorains F.K., Cowlishaw, S., Thomas, S.A. (2011). Prevalence of comorbid disorders in problem and pathological Gambling: Systematic review and metaanalysis of population surveys. Addiction, 106, 490–498.
Lynch, W.J., Maciejewski, P.K., & Potenza, M.N. (2004). Psychiatric correlates of gambling in adolescents and young adults grouped by age at gambling onset. Archives of General Psychiatry, 61, 1116-1122.
Nagin, D. (1999). Analyzing developmental trajectories: A semi-parametric, group-based approach. Psychological Methods, 4, 139-177.
Nagin, D. (2005). Group-based modeling of development. Cambridge, Mass.: Harvard University Press, 201p.
National Research Council (1999). Pathological gambling: A critical review. Washington, DC: The National Academies Press.
Neal, P., Delfabbro, P., & O’Neil, M. (2005). Problem gambling and harm: Towards a national definition. Commissioned for the Ministerial Council on Gambling. Prepared by the SA Centre for Economic Studies with the Department of Psychology, University of Adelaide.
Petry, N.M. (2007). Gambling and substance use disorders: Current status and future directions. American Journal on Addictions, 16, 1-9.
Petry, N. M. (2005). Pathological gambling: etiology, comorbidity, and treatment. Washington, DC, US: American Psychological Association. 417 p.
Petry, N.M., Stinson, F.S., Grant, B.F. (2005). Comorbidity of DSM-IV pathological gambling and other psychiatric disorders: results from the National Epidemiologic Survey on Alcohol and Related Conditions. Journal of Clinical Psychiatry, 66, 564–574.
27
Public Sector Gaming Study Commission (2000). Final Report of the Public Sector Gaming Study Commission. National Council of Legislators from Gaming States. NCLGS National Office, www.nclgs.org.
Rahman, A.S., Pilver, C.E., Desai, R.A., Steinberg, M.A., Rugle, L., Krishnan-Sarin, S., & Potenza, M.N. (2012). The relationship between age of gambling onset and adolescent problematic gambling severity. Journal of psychiatric research, 46 (5), 675 – 683.
Rouquette, A., Côté, S., Pryor, L., Carbonneau, R., Vitaro, F., Tremblay, R.E. (2012). Cohort profile: The Quebec Longitudinal Study of Kindergarten Children (QLSKC). International Journal of Epidemiology, 1(11).
Scholes-Balog, K.E., Hemphill,S.A., Dowling, N.A., & Toumbourou, J.W. (2014). A prospective study of adolescent risk and protective factors for problem gambling among young adults. Journal of Adolescence, 37, 215–224.
Séguin, M., Robert, M., DiMambro, M., & al. (2013). Gambling over the life course and treatment-seeking. International Gambling Studies, 13(3), 302-318.
Shaffer, H.J. and Hall, M.N. 2002. The natural history of gambling and drinking problems among casino employees. Journal of Social Psychology, 142(4), 405–24.
Shaffer, H.J., Hall, M.N., Vander Bilt, J., (1999). Estimating the prevalence of disordered gambling behavior in the United States and Canada: a research synthesis. American Journal of Public Health, 89, 1369–1376.
Shaffer, H.J. & Korn, D.A., (2002). Gambling and related mental disorders: a public health analysis. Annual Review of Public Health, 23, 171–212.
Slutske, W.S. 2006. Natural recovery and treatment-seeking in pathological gambling: Results of two U.S. national surveys. American Journal of Psychiatry, 163, 297–302.
28
Slutske, W.S., Jackson, K.M. and Sher, K.J. 2003. The natural history of problem gambling from age 18 to 29. Journal of Abnormal Psychology, 112(2), 263–274.
Spapens, T., Littler, A., & Fijnaut, C. (2008). Crime, addiction and the regulation of gambling. Leiden: Martinus Nijhoff.
Stinchfield, R. (2002). Reliability, validity, and classification accuracy of the South Oaks Gambling Screen (SOGS). Addictive Behaviors, 27, 1–19.
Stinchfield, R., & Winters, K. C. (1998). Gambling and problem gambling among youths. The Annals of the American Academy of Political and Social Science, 556, 172-185.
Vitaro, F., &Wanner, B. (2011). Predicting early gambling in children. Psychology of Addictive Behaviors, Vol. 25(1), 118–126.
Vitaro, F., Wanner, B., Ladouceur, R., Brengden, M., & Tremblay, R., (2004). Trajectories of gambling during adolescence. Journal of Gambling Studies, 20, 47-69.
Vitaro F, Brendgen M, Ladouceur R, Tremblay RE: Gambling, delinquency, and drug use during adolescence: mutual influences and common risk factors. Journal of Gambling Studies, 2001; 17, 171–190.
Volberg, R.A. (1994). The Prevalence and demographics of pathological gamblers: Implications for public health. American Journal of Public Health, 84, 237-241.
Wanner, B., Vitaro, F., Carbonneau, R. &Tremblay, R.E. (2009). Cross-lagged links among gambling, substance use, and delinquency from mid-adolescence to young adulthood: Additive and
moderating effects of common risk factors. Psychology of Addictive Behaviors, 23, 91-104. Williams, R.J., Volberg, R.A. & Stevens, R.M.G. (2012). The Population Prevalence of Problem Gambling: Methodological Influences, Standardized Rates, Jurisdictional Differences, and Worldwide Trends. Report prepared for the Ontario Problem Gambling Research Centre and the Ontario Ministry of Health and Long Term Care.
29
Williams, R.J., West, B.L., & Simpson, R.I. (2012). Prevention of problem gambling: A comprehensive review of the evidence, and identified best practices. Report prepared for the Ontario Problem Gambling Research Centre and the Ontario Ministry of Health and Long Term Care.
Winters, K.C., Stinchfield, R.D., Botzet, A. & Anderson, N. (2002). A prospective study of youth gambling behaviors. Psychology of Addictive Behaviors, 16, 3-9.
Winters, K.C., Stinchfield, R.D., Botzet, A., & Slutske, W.S. (2005). Pathways of youth gambling problem severity. Psychology of Addictive Behaviors, Vol. 19(1), 104-107.
Winters, K.C., Stinchfield, R.D., & Fulkerson, J. (1993). Toward the development of an adolescent gambling problem severity scale. Journal of Gambling Studies, 9, 63-84.
30
Figure 1. Distribution of Gambling Problems at age 15, 22 and 30 years
0 20 40 60 80 100 0 1 2 3 4 5 6 7 8 9 10 11 12 % of part ici pants
Number of Gambling Problems Age 15 0 20 40 60 80 100 0 1 2 3 4 5 6 7 8 9 10 11 12 % of part ici pants
Number of Gambling Problems Age 22 0 20 40 60 80 100 0 1 2 3 4 5 6 7 8 9 10 11 12 % of part ici pants
Number of Gambling Problems Age 30
31
Figure 2 Trajectories of Gambling Problems from age 15 to age 30
% Sample (%Girls, %Boys) ***: p<.001 for sex difference
0 0,1 0,2 0,3 0,4 0,5 0,6 0,7 0,8 0,9 1
Age 15 Age 22 Age 30
P ro b ab ilit y
32
Table 1 Trajectories of Gambling Problems and Tobacco, Drugs and Alcohol related behaviors1 Tobacco Drugs Gambling Problems Trajectories Smoking last 12 months (yes/no) Number of cigarettes dailylast 12 months Frequency of drug use last 12 months: At least Weekly (vs Occasionally or
never)
Problems related with drug use : 2 or more
(vs one or none) Criticized for drug use (yes/no) Risky behaviors under drug influence: many times (vs once-twice or none) Received or need help regarding drug use (yes/no)
Low 29.7 11.0 11.5 9.5 18.8 19.5 9.0 High 43.3** 13.2 30.7*** 21.1*** 28.9* 38.9*** 18.9** Alcohol Gambling Problems Trajectories Usual amount of alcohol uselast 12 months: Many drinks
(vs A few or less)
Frequency of alcohol use last 12 months: Few times
& up/week (vs once/week or less)
Problems related with alcohol use: 2 or more
(vs one or none) Criticized for alcohol use (yes/no) Risky behaviors under alcohol influence : Many times (vs once-twice or none) Need or received help regarding alcohol use (yes/no) Low 10.6 35.6 13.2 15.8 23.4 2.7 High 17.8* 38.4 26.7*** 26.7** 38.9*** 10.0***
1: All indicators are dichotomous, and corresponding Table values are %, except for Number of cigarettes daily. Except where specified, Substance Use categories refer to the last 5 years. Low vs High Gambling Problems Trajectories: *: p <.05 **: p <.01 ***: p <.001