RUNNING HEAD: Variety of gambling activities Word count: 3394
Variety of Gambling Activities from Adolescence to Age 30 and Association with Gambling Problems: A 15-Year Longitudinal Study of a General Population Sample
Rene Carbonneau, Ph.D.1,2,3, Frank Vitaro, Ph.D.2,3,4, Mara Brendgen2,3,5, and Richard E. Tremblay, Ph.D.1,2,3,6
Authors’ Affiliations:
1: Department of Pediatrics, University of Montreal; 2: Sainte-Justine Hospital Research Center; 3: Research Unit on Children’s Psychosocial Maladjustment, University of Montreal; 4: School of Psychoeducation, University of Montreal; 5: Department of Psychology, University of Quebec in Montreal; 6: School of Public Health and Population Sciences, University College Dublin, Ireland.
Reprint request and corresponding author:
Rene Carbonneau, Ph.D., Associate Professor, Department of Pediatrics, Faculty of Medicine, University of Montreal, 3050 Edouard-Montpetit, suite 225, Montréal (QC), H3T 1J7 Canada. Tel: 514 343-6111, 1-2505, Fax: 514 343-6962, email: rene.carbonneau@umontreal.ca.
Funding/Support: We thank the Quebec Government Ministry of Health, Fond Quebecois de la Recherche
sur la Societe et la Culture, Canada’s Social Science and Humanities Research Council, St-Justine Hospital’s Research Center, and the University of Montreal for financial support.
Declarations of interest from authors: No conflict of interest reported.
Carbonneau, R., Vitaro, F., Brendgen, M., & Tremblay, R. E. (2015). Variety of gambling activities from adolescence to age 30 and association with gambling problems: a 15‐year longitudinal study of a general population sample. Addiction, 110(12), 1985-1993,
which has been published in final form at : https://doi.org/10.1111/add.13083.
ABSTRACT
Aims. To estimate trajectories of gambling variety from mid-adolescence to age 30, and compare the different trajectory-groups with regard to the type and the frequency of gambling activities practiced, and gambling-related problems. Design. Prospective longitudinal cohort study. Setting. Province of Quebec, Canada. Participants. A mixed-gender general population cohort assessed at ages 15 (N=1882), 22 (N=1785), and 30 (N=1358). Measurements. Adolescent and adult versions of the South Oaks Gambling Screen (SOGS). Findings. Group-based trajectory analysis identified three distinct trajectories: A Late-onset
Low trajectory (26.7% of sample) initiating gambling at age-22, an Early-onset Low trajectory (64.8% of
sample), characterized by 1-2 different activities from age-15 onwards, and a High trajectory (8.4% of sample), with an average of 4-5 different activities from age 15 to 30. Males (14.2%) were 4 times more likely to be on a High-trajectory than females (3.5%) (p<.001). Preferred types of gambling activities were similar across the three trajectories. Participants on a High-trajectory reported higher gambling frequency at ages 15 and 30, and were more likely to experience problem gambling at age 30: 3.09 (95%CI=1.66, 5.75) and 2.26 (95%CI=1.27, 4.04) times more, respectively, than Late-onset Low and Early-onset Low
participants, even when SES, frequency of gambling and problem gambling in adolescence, gender, age-30 education, SES, and frequency of gambling, were controlled. Conclusions. A small group of individuals, predominantly males, who practice 4-5 different gambling activities annually from mid-adolescence to age 30 are at higher risk than others of problem gambling at age 30, independent of gambling frequency, adolescent gambling problems, and other confounders.
Introduction
A particularity of many gambling studies, as opposed to studies of other types of addictions, is that the dimension of interest is problem gambling, rather than gambling behavior per se [1, 2]. Moreover, problem gambling is seldom presented in association with other aspects of gambling that might help us understand its etiology, i.e., by providing additional information besides gambling problems [1-4]. However, the type, the frequency, and the variety of gambling activities have been related to the development of gambling problems in different populations and at different ages [3-17]. For example, specific games have been found to be related more strongly to gambling problems than others [13-17]. Gambling frequency has also been found to predict gambling-related problems [3, 6-10], sometimes more than prior gambling problems [5].
Gambling frequency is correlated with gambling variety (i.e., playing a number of different games) [10, 12-15, 17]. However, there is cross-sectional evidence that they are independently related to gambling problems even when considered jointly, although the contribution of gambling variety appears especially robust [10, 13-15, 17]. Indeed, controlling for gambling variety seems to substantially reduce or eliminate the significant associations observed between types of games and gambling problems, whereas controlling for gambling frequency has limited effects [15, 17]. Echoing early work [18] showing that gamblers involved in different types of activities scored higher on sensation-seeking, some scholars have suggested that gambling variety might be a marker of novelty-seeking in gamblers [17], and that its strong link with gambling
problems could reflect the impulse control feature of these problems [19-23]. Consistent with this hypothesis, research on personality traits of problem gamblers has shown that they express greater novelty-seeking than non-problem gamblers [24-27]. If gambling variety indeed reflects novelty-seeking – a personality
disposition that is highly heritable [28-30] – then one might expect not only considerable stability of
gambling variety from a young age onwards, but also a consistent association with gambling problems over time. Yet, the course of gambling variety over time from adolescence to adulthood and its unique association with adult gambling problems remain to be established. Importantly, gambling variety may not necessarily
evolve in the same way for all individuals, and different longitudinal patterns could exist in the population. Gambling variety may increase, remain stable or decrease over time for different individuals, who may differ substantially on the extent of their gambling problems during adulthood. A person-based longitudinal
methodology such as growth mixture modeling [31] can help address these issues by identifying subgroups of individuals with different longitudinal trajectories of gambling variety within the population.
The present study had three goals: 1) estimate the number and the shape of trajectories of gambling variety across three key periods of development – mid-adolescence (age 15), early adulthood (age 22), and young adulthood (age 30) – in a mixed-gender general population cohort, using a person-based longitudinal methodology, 2) compare participants following different trajectories on other aspects of gambling
participation (i.e., the frequency and the type of gambling activities), and 3) test the association between trajectory-groups and gambling problems at the end of the trajectories time period, above and beyond the effects of gambling problems at age 15, frequency of gambling at ages 15 and 30, and socio-demographic factors typically associated with gambling problems: gender, SES, and education.
Methods Participants
Participants were part of the Québec Longitudinal Study of Kindergarten Children (QLSKC) [32-34], a mixed-gender population cohort representative of the children attending kindergarten in French-speaking state schools of the province of Quebec, Canada, in 1986-1987. The QLSKC was originally designed to study the development of behaviour problems from childhood to early adulthood. Participants of the QLSKC were selected using a random sampling procedure stratified both by administrative-geographic region and by schoolboard size (small/medium/large). At ages 15, 22, and 30 (N=1882, 1785, and 1358, respectively, with 49.8%, 44.5%, and 40.2% males) an extensive protocol was administered to the participants, either through a structured interview (ages 15 and 22) or through a self-administered Web-questionnaire (age 30). Attrition was 26.4% from ages 15 to 30 years and 35.3% from ages 22 to 30 years for participants who were not assessed at age 15. All participants with age 30 data were also previously assessed, either at age 15 (78.7%),
age 22 (84.0%), or both (62.7%). There were no differences in regard to race or socio-demographic
measures, nor in regard to initial gambling variety and gambling problems scores between participants who dropped out of the study before age 30 and those assessed up to age 30. However, males were more likely (with a 1.9:1 ratio) to drop out of the study than females, which is consistent with previous longitudinal research on addictions [35-38].
Measures
Gambling variety. Following the requirements to compute longitudinal trajectories, we used an
identical set of eight items describing gambling activities (for money) at each time of assessment: playing cards; playing skill games; betting on sports; betting on races; playing bingo; playing dice games; gambling machines; and lottery tickets. All items referred to the last 12 months prior to assessment and were coded as yes/no to indicate whether the participant had engaged in the activity or not. Individual item scores were summed up to an 8-point scale. In order to use the most complete information available, complete scales were also computed by adding to the 8-item scales the additional items related to gambling activities available in adolescent and adult assessments. The resulting complete scales included between 9 and 12 items, depending on the assessment period (see: Table 1).
Frequency of gambling was computed based on the items’ original coding: never; less than
once/month; once/month; once/week; more than once/week. First, the participant’s highest category of frequency reported for any of the different gambling activities was selected as the overall frequency. Second, if other activities were reported at a sufficiently high frequency to affect the overall frequency, the selected category was upgraded (e.g., two activities reported once/week resulting in an overall frequency coding of more than once/week).
Problem gambling. The problem gambling measures at ages 15 and 30 were based on adolescent and
adult versions of the South Oaks Gambling Screen (SOGS) [39-40]. Both instruments are based on DSM-III and validated against DSM-III-R criteria for pathological gambling, and have shown good reliability and internal consistency [39-41]. First, gambling problems (coded as yes or no) were summed up using the 12
items common to the two instruments. The internal consistency of this scale (alpha) was .76 and .80, respectively, at ages 15 and 30 years. Next, categories of problem gambling were established based on the SOGS-score sheet (e.g., score 1-4: Some problems with Gambling; score 5 or more: Probable Pathological Gambler) [40]. Using these criteria, 18.9% (or 1.1%) of participants at age 15 and 8.0% (or 0.9%) of participants at age 30, respectively, could be classified as problem or probable pathological gamblers. Because of the small number of probable pathological gamblers, both categories were collapsed to represent Problem Gambling (i.e., gamblers with one or more problems).
Socio-demographic control variables. Given their association with gambling problems
[4,6,8,11-12,42-44], gender, education (coded as no high-school diploma, high-school diploma, post-secondary education), and socioeconomic status (SES) at ages 15 and 30 were included as control variables in the analyses examining trajectories’ association with problem gambling at age 30. Age 15 SES was based on parents’ occupational prestige [45-46], whereas participants’ household income was used as SES indicator at age 30.
Data analysis
Semi-parametric mixture modeling was used to identify homogenous subgroups of individuals with different longitudinal patterns (i.e., trajectories) of gambling variety within the population using SAS PROC TRAJ [47]. Selection of the best fitting model was based on the Bayesian information criterion (BIC) [48-49]. The trajectories from the selected best fitting model were compared in terms of the type of gambling activities, the frequency of gambling, and gambling problems. Moreover, the association between trajectories and problem gambling at age 30 was tested in a model that included gambling frequency and problems at age 15, gender, family SES at ages 15 and 30, education, and frequency of gambling at age 30 as control
variables. Because data were collected based on hierarchical sampling by administrative-geographic region and schoolboard size, the SAS generalized linear mixed modeling procedure GLIMMIX was used for these last analyses [50]. This procedure allows for a binary response-variable and for the inclusion of random effects across sampling stages/clusters [50-51]. Moreover, to compensate for differential attrition across
males and females, inverse probability weighting [52-53] was applied to the GLIMMIX procedure examining the association between trajectories and gambling problems at age 30.
Results Trajectories of Gambling Variety
The best fitting model identified three distinct trajectory-groups (Figure 1). A first, Late-onset Low trajectory-group (26.7% of the sample) did not gamble in adolescence and reported on average about one gambling activity over the last 12 months at ages 22 and 30, keeping a stable low profile of gambling variety across times of assessment. A second trajectory-group, labeled Early-onset Low (64.8% of the sample) reported an average of two different gambling activities in adolescence, followed by a slight decrease to about 1.5 activities at ages 22 and 30. Thus, the two Low trajectories essentially differed on the basis of adolescent gambling participation. Finally, a third, High trajectory-group (8.4% of the sample) reported the highest gambling variety at all times, with a decreasing average of 4.6, 4.0 and 3.2 different activities, respectively, at ages 15, 22, and 30 years, when using the 8 items that were common to all three data points. However, when using the complete scales, the average number of 4.96, 4.77, and 4.69 gambling activities observed from adolescence to age 30 suggested a more stable longitudinal profile for the High trajectory-group.
This 3-group trajectory model (BIC=-8193.77) provided a better fit than an alternative 2-group (Low/High) trajectory model (BIC=-8296.38; ∆ BIC=102.61, which indicates evidence against the alternative model [47, 54]). The average group posterior probabilities of individuals belonging into their assigned trajectory-group were .88 for the Late-onset Low, .86 for the Early-onset Low, and .81 for the High trajectory-group, well above the .70 threshold suggested by Nagin [48] for satisfactory model fit. Finally, significant gender differences were observed (2(2df)=80.71, p<.001), with males being about 4 times more likely to follow a High-trajectory (14.2% vs 3.5%) and females more likely to follow a Late-Low (30.1% vs 25.9%) or an Early-Low (66.4% vs 60.0%) trajectory.
Association between Trajectories of Gambling Variety and Types of Gambling Activities at Ages15 and 30
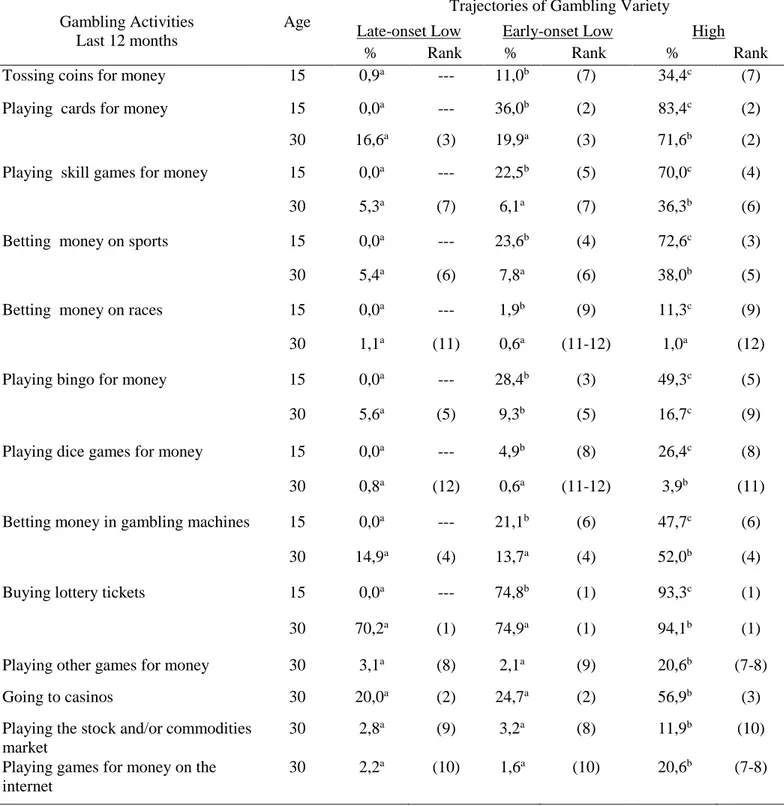
Table 1 shows the types of gambling activities reported at ages 15 and 30. The endorsed activities were ranked in a remarkably similar way across trajectory groups and across ages (with the exception of the
Late-Low trajectory-group who had not started to gamble at age 15). The top four gambling activities
reported at age 30 were the same for the three trajectory-groups, except for ranks 2 and 3 being reversed for participants of the High-trajectory. At age 15, the rank-order correlation of preferred activities between High and Early-Low trajectory-groups was .95 (p<.01). At age 30, this correlation ranged between .88 and .98 (p<.01) across the three trajectory-groups.
Association between Trajectories of Gambling Variety and Frequency of Gambling at Ages 15 and 30
At age 30, participants on a High-trajectory were proportionately more likely to belong to a high frequency category than their peers on the Late-Low and Early-Low trajectories (i.e., gambling more than once per week: 12.7% vs 2.8% and 3.2%; 2(df=2)=18.70, respectively, p<.001; Table 2). More participants in the High trajectory-group (35.9%) also reported gambling at least once a week at age 15 than did those in the Early-Low group (13.5%), X2(df=2)=83.35, p<.001. No significant differences were observed between the two Low trajectory-groups at age 30. However, at age 15, 42.3% of participants in the Early-Low group gambled at least once per month compared to virtually none in the Late-Low trajectory-group.
Association between Trajectories of Gambling Variety and Gambling Problems at age 30
Figure 2 illustrates the association between trajectories of gambling variety and problem gambling at age 30. One quarter (25.3%) of participants in the High trajectory-group reported at least one gambling-related problem compared to only 5.9% and 9.0% (X2(2df)=34.42, p<.001), respectively, of participants in the Late-Low and Early-Low trajectory-groups. Looking at the results from the perspective of age 30
High-trajectory of gambling variety than participants without problems (20.7% versus 6.3%; X2(2df)=34.42,
p<.001) .
Testing Trajectories’ Association with Problem Gambling at Age 30 While Controlling for Confounding
Variables
Results of the GLIMMIX analysis examining trajectories’ association with problem gambling at age 30 are presented in Table 3. Gender, problem gambling at age 15, participants household SES and frequency of gambling at age 30, and trajectories of gambling variety all showed significant associations with age 30 problem gambling. Participants who reported at least one problem at age 15 were twice as likely to
experience one or more problems at age 30 (OR=2.06, 95%CI=1.36, 3.14) compared to their peers who did not report problem gambling in adolescence. The frequency of gambling at age 30 was also concurrently linked with problem gambling: participants who gambled weekly or more often were 3.02 (95%CI=2.02, 4.52) times more likely to simultaneously experience one or more gambling problems. Males were more susceptible to problem gambling (OR=1.87, 95%CI=1.28, 2.72), and these problems were also associated with a lower SES at age 30 (OR=0.91, 95%CI=0.84, 0.98). Importantly, even when all these confounders were taken into account, participants following a High-trajectory were still more likely to experience problem gambling at age 30: 3.09 (95%CI=1.66, 5.75) times more than their Late-Low peers, and 2.26 (95%CI=1.27, 4.04) times more than participants following the Early-Low trajectory. The fact that participants following the high trajectory reported an average of 4-5 gambling activities at each of the three assessment times might suggest that a single earlier measure of gambling variety could predict later problem gambling. However, replacing the trajectory-group variable with age 15 gambling variety in the model showed no significant contribution.
Discussion
The present study aimed to identify differential trajectories of gambling variety from mid-adolescence to age 30, in a mixed-gender population cohort and to compare these trajectories in regard to the type and frequency of gambling activities as well as their association with problem gambling. Three subgroups with
different longitudinal trajectories were identified: Two Low trajectory-groups with an average of 1-2 gambling activities per year, including a Late-onset Low trajectory-group who mostly did not gamble in adolescence and an Early-onset Low trajectory-group with a low gambling variety already in adolescence and up to age 30. A small third group was also identified who followed a High-trajectory at all three assessment times. Whereas the complete scale scores indicated a stable number of different games played by participants on the High-trajectory, the item scale suggested a slight decline of gambling variety over time. Since the 8-item scale is based mainly on games played during adolescence, these findings may indicate a shift toward activities available to adults, suggesting stability of gambling variety. Consistent with previous reports [4,6,8,11-12,42-44], males were considerably more likely to follow a High-trajectory of gambling variety than females. Overall, the results suggest that individuals who engage in many different gambling activities typically do so already in adolescence and not only in adulthood. However, gambling variety during
adolescence did not uniquely predict problem gambling in adulthood.
Consistent with previous observations [4,11-15,17], participants following a High gambling variety trajectory were more frequent gamblers than their peers in the two Low trajectory-groups, at both ages 15 and 30. Results offered no evidence, however, that participants in the High-trajectory were specifically attracted to distinct games: The top four gambling activities reported at age 30 were literally the same for the High and
Low-trajectory participants, and were consistent with previous reports of preferred gambling activities in
different adult populations[2], and across different categories of problem and non-problem gamblers [6]. Although the majority of these longitudinally versatile gamblers did not experience gambling problems at age 30, a significantly greater proportion of them reported at least one problem compared to their peers in the
Early-Low or Late-Low trajectories. This association, which remained significant even when controlling for a
host of confounding variables, is consistent with previous reports on the cross-sectional link between
gambling variety and gambling problems [3,4,6,8,9-17]. In regard to confounders, it is interesting to note that only the concurrent frequency of gambling was associated with problem gambling at age 30. Perhaps
frame [5]. In any case, the significant associations of variety-based trajectory-groups and of gambling frequency categories with age 30 problem gambling suggest that, despite their correlation, each of these variables plays a unique role in the pathway toward problem gambling [17].
The robust association between trajectories of gambling variety and problem gambling at age 30 is consistent with the hypothesis that versatile gamblers might have a propensity for novelty-seeking [17]. This personality dimension has been linked concurrently to gambling variety [18], and emerges from previous reports examining pathways to gambling problems [55-56]. Research on personality subtypes of problem gamblers [57-58] also identified a group of individuals characterised by impulsivity and action-seeking. The fact that novelty-seeking is a highly stable trait [59-60] might thus not only explain why some individuals follow a stable High-trajectory of gambling variety, but also why engaging in a continuously high level of gambling variety over time increases the risk for problem gambling. The lack of effect observed for age 15 gambling variety might be explained by the general increase in sensation-seeking in adolescence [60-62], which may preclude the early detection of potentially stable high novelty-seekers. Thus, investigating the course of gambling variety with a person-based methodology allowed us to identify a subgroup of gamblers who maintained a higher level of versatility over time, leading to a higher likelihood of experiencing
gambling problems.
Despite the strong association between trajectories and problem gambling, three quarters of High-trajectory participants reported no gambling problems. These results suggest that recreational gamblers who gamble frequently and participate in a high variety of gambling activities do not necessarily develop
gambling problems, at least up to age 30. These individuals may benefit from personal or social protection factors that would be interesting to identify as potential avenues for prevention with at-risk gamblers. For example, some stable versatile gamblers, although prone to sensation-seeking, might also possess other personality factors, such as harm avoidance, that might counteract or moderate their risk of experiencing gambling-related problems [61, 63].
Strengths, Limitations and Conclusions
The present study had a number of assets. It is the first to identify longitudinal trajectories of gambling variety across three critical developmental periods - mid-adolescence (age 15), early adulthood (age 22), and age 30 - in a large mixed-gender population cohort and to compare these trajectory-groups on gambling participation and gambling problems, net of a series of possible confounders. Despite these strengths, our study is not without limitations. First, although attrition analyses revealed no differences in baseline
gambling variety, gambling problems, race and SES - and despite controlling for gender differences in drop-out rates - attrition might have led to an underestimation of the level of gambling variety and problem
gambling in our sample. Thus, our results might be conservative. Second, using one problem as threshold for problem gambling implies that most participants with a positive code likely reported subclinical levels of problem gambling, and results should be considered in that perspective. Third, given that participants reached the age of 15 years in 1995 and age 30 in 2010, generalizability of the results beyond the studied time frame may be limited, since gambling opportunities at that time may have differed from those available today. However, previous reports concluded that the expansion of gambling opportunities in recent years did not cause a concomitant increase in pathological gambling in the population [64-65]. Finally, the present study was limited to a population of North-American individuals raised in a French-speaking culture, and
replications are needed to determine generalizability of the results to other cultures.
These limitations notwithstanding, we believe that our population-based, prospective study provides unprecedented information on the longitudinal course of individuals’ engagement in various gambling activities and helps understand the developmental paths leading to adult problem gambling. More specifically, our results suggest that a stable involvement in 4-5 different gambling activities between adolescence and age 30 contributes to the development of at least subclinical levels of problem gambling.
Acknowledgment
We thank the participants and their parents for their collaboration to this project; Xuecheng Liu, Ph.D., for statistical expertise; and the staff of the Research Unit on Children’s Psychosocial Maladjustment for data collection and management.
REFERENCES
1. Rodgers B., Caldwel T., Butterworth P. Measuring gambling participation. Addiction, 2009; 104: 1065-1069.
2. Shaffer H.J., Korn D.A. Gambling and related mental disorders: a public health analysis. Annu Rev Publ
Health, 2002; 23: 171-212.
3. Cunningham-Williams R.M., Grucza R.A., Cottler L.B., Womack S.B., Books S.J., Przybeck T.R., Spitznagel E.L., Cloninger C.R. Prevalence and predictors of pathological Gambling: Results from the St. Louis personality, health and lifestyle (SLPHL) study. J Psychiatr Res, 2005; 39: 377-390.
4. Franco C.A., Maciejewski P.K., Potenza M.N. Past-year recreational Gambling in a nationally
representative sample: Correlates of casino, non-casino, and both casino/non-casino Gambling. Psychiatr
Res, 2011; 188: 269-275.
5. Vitaro F., Brendgen M., Ladouceur R., Tremblay R.E. Gambling, delinquency, and drug use during adolescence: Mutual influences and common risk factors. J Gambl Stud, 2001; 17: 171-190.
6. Kessler R.C., Hwang I., LaBrie R., Petukhova M., Sampson N.A., Winters K.C., Shaffer H.J. The prevalence and correlates of DSM-IV Pathological Gambling in the National Comorbidity Survey Replication. Psychol Med, 2008; 38: 1351-1360.
7. Currie S.R., Hodgins D.C., Wang J., El-Guebaly N., Wynne H., Chen S. Risk of harm among gamblers in the general population as a function of level of participation in gambling activities. Addiction, 2006; 101: 570-580.
8. Volberg R.A. The Prevalence and Demographics of Pathological Gamblers: Implications for Public Health. Am J Public Health, 1994; 84: 237-241.
9. Holtgraves T. Gambling, Gambling Activities, and Problem Gambling. Psychol Addict Behav, 2009; 23: 295-302.
10. Welte J.W., Barnes G.M., Wieczorek W.F., Tidwell M.C., Parker J.C. Risk factors for pathological gambling. Addict Behav, 2004; 29, 323-335.
11. Hodgins D.C., Schopflocher D.P., Martin C.R., el-Guebaly N., Casey D.M., Currie S.R., Smith G.J., Williams R.J. Disordered gambling among higher-frequency gamblers: who is at risk? Psychol Med, 2012; 42; 2433-2444.
12. Goudriaan A.E., Slutske W.S., Krull J.L., Sher K.J. Longitudinal patterns of Gambling activities and associated risk factors in college students. Addiction, 2009; 104: 1219-1232.
13. Welte J.W., Barnes G.M., Tidwell M.-C.O., Hoffman J.H. The association of form of gambling with problem gambling among American youth. Psychol Addict Behav, 2009; 23: 105-112.
14. LaPlante D.A., Nelson S.E., LaBrie R.A., Shaffer H.J. Disordered gambling, type of gambling and gambling involvement in the British Gambling Prevalence Survey 2007. Eur J Public Health, 2011; 21: 532-537.
15. Wardle H., Moody A., Spence S., Orford J., Volberg R., Jotangia D. et al. British gambling prevalence
16. LaPlante D.A., Afifi, T.O, Shaffer H.J. Games and gambling involvement among casino patrons. J
Gambl Stud, 2013; 29: 191-203.
17. LaPlante D.A., Nelson S.E., Gray H.M. Breadth and depth involvement: Understanding Internet
gambling involvement and its relationship to gambling problems. Psychol Addict Behav, 2014; 28: 396-403. 18. Coventry K.R., Brown R.I.F. Sensation seeking, gambling and gambling addictions. Addiction, 1993; 88: 541-554.
19. Kräplin A., Bühringer G., Oosterlaan J., van den Brink W., Goschke T., Goudriaan A.E. Dimensions and disorder specificity of impulsivity in pathological gambling. Addict Behav, 2014; 39:1646-1651.
20. Nower L, Blaszczynski A. Impulsivity and pathological gambling: A descriptive model. International
Gambling Studies, 2006; 6: 61-75.
21. Myrseth H. Pallesen S., Molde H., Johnsen B.H., Lorvik I.M. Personality factors as predictors of pathological gambling. Pers Indiv Differ, 2009; 47: 933-937.
22. Liu W., Lee G.P., Goldweber A., Petras H., Storr C.L., Ialongo N.S., Martins S.S. Impulsivity trajectories and gambling in adolescence among urban male youth. Addiction, 2013; 108: 780-788.
23. Slutske W.S., Caspi A., Moffitt T.E., Poulton R. Personality and Problem Gambling: A prospective study of a birth cohort of young adults. Arch Gen Psychiatry, 2005; 62: 769-775.
24. Black D.W., Coryell W.H., Crowe R.R., Shaw M., McCormick B., Allen J. Personality Disorders,
Impulsiveness, and Novelty Seeking in Persons with DSM-IV Pathological Gambling and Their First-Degree Relatives. J Gambl Stud, 2014; Epub ahead of print. DOI: 10.1007/s10899-014-9505-y
25. Martinotti G., Andreoli S., Giametta E., Poli V., Bria P., Janiri L. The dimensional assessment of personality in pathologic and social gamblers: the role of novelty seeking and self-transcendence. Compr
Psychiatry, 2006; 47: 350-356.
26. Kim S.W., Grant J.E. Personality dimensions in pathological gambling disorder and obsessive-compulsive disorder. Psychiatr Res, 2001; 104: 205-212.
27. Hammelstein P. Faites vos jeux! Another look at sensation seeking and pathological gambling. Pers Indiv
Differ, 2004; 37: 917-931.
28. Cloninger CR. A systematic method for clinical description and classification of personality variants.
Arch Gen Psychiatry, 1987; 44: 573-588.
29. Heath A.C., Cloninger C.R., Martin N.G. Testing a Model for the Genetic Structure of Personality: A Comparison of the Personality Systems of Cloninger and Eysenck. J Pers Soc Psychol, 1994; 4: 762-775. 30. Gillespie N.A., Cloninger C.R., Heath A.C., Martin N.G. The genetic and environmental relationship between Cloninger’s dimensions of temperament and character. Pers Indiv Differ, 2003; 35:1931-1946. 31. Muthen B., Muthen L.K. Integrating person-centered and variable-centered analyses: Growth mixture modeling with latent trajectory classes. Alcohol Clin Exp Res, 2000; 24: 882-891.
32. Rouquette A., Côté S., Pryor L., Carbonneau R., Vitaro F., Tremblay R.E. Cohort Profile: The Quebec Longitudinal Study of Kindergarten Children (QLSKC). Int J Epidemiol, 2014; 43: 23-33.
33. Carbonneau R. Developmental trajectories leading to delinquency and substance use in adolescence:
Results from Quebec studies. In: Brochu, S., DaAgra, C. & Cousineau, M.-M. (Eds), Drugs and crime
deviant pathways. London: Ashgate, 2002
34. Research Unit on Children’s Psychosocial Maladjustment (Groupe de recherche sur l’inadaptation psychosociale chez l’enfant (GRIP)). Available from: http://www.gripinfo.ca/Grip/Public/www/
35. Post A., Gilljam H., Bremberg S., Galanti M.R. Psychosocial Determinants of Attrition in a Longitudinal Study of Tobacco Use in Youth. The Scientific World Journal, 2012; 2012: 7 pages.
doi:10.1100/2012/654030
36. Claus R.E., Kindleberger L.R., Dugan M.C. Predictors of Attrition in a Longitudinal Study of Substance Abusers. J Psychoactive Drugs, 2002; 34: 69-74.
37. Bauman K.E., Ennett S., Foshee S.A., Pemberton M., Hicks K. Correlates of participation in a family-directed tobacco and alcohol prevention program for adolescents. Health Educ Behav, 2001; 28: 440-461. 38. Martinson B.C., Lazovich D., Lando H.A., Perry C.L., McGovern P.G., Boyle R.G. Effectiveness of monetary incentives for recruiting adolescents to an intervention trial to reduce smoking. Prev Med, 2000; 31: 706-713.
39. Winters K.C., Stinchfield R.D., Fulkerson J. Toward the development of an adolescent Gambling problem severity scale. J Gambl Stud, 1993; 9: 63-84.
40. Lesieur H.R., Blume S.B. The South Oaks Gambling Screen (SOGS): A new instrument for the identification of pathological Gamblers. Am J Psychiatry, 1987; 144: 1184-1188.
41. Stinchfield R. Reliability, validity, and classification accuracy of the South Oaks Gambling Screen (SOGS). Addict Behav, 2002; 27: 1-19.
42. Welte J.W., Barnes G.M., Wieczorek W.G., Tidwell M., Parker J. Gambling participation in the U.S.-Results from a national survey. J Gambl Stud, 2002; 18: 313-337.
43. Blanco C., Hasin D.S., Petry N., Stinson F.S., Grant B.F. Sex differences in subclinical and DSM-IV pathological gambling: results from the National Epidemiologic Survey on Alcohol and Related Conditions.
Psychol Med, 2006; 36: 943-953.
44. Martins S.S., Ghandour L.A., Lee G.P., Storr C.L. Sociodemographic and Substance Use Correlates of Gambling Behavior in the Canadian General Population. J Addic Dis, 2010; 29: 338-351.
45. Blishen B.R., Carroll W.K., Moore C. The 1981 socioeconomic index for occupations in Canada. Can
Rev Soc Anthrop, 1987; 24: 465-488.
46. Bornstein M.H., Bradley R.H. Socioeconomic Status, Parenting, and Child Development. N-Y: Lawrence Erlbaum Associates, 2003.
47. Jones B.L., Nagin D.S., Roeder K. A SAS procedure based on mixture models for estimating developmental trajectories. Sociol Method Res, 2001; 29: 374-393.
48. Nagin D. Analyzing developmental trajectories: A semi-parametric, group-based approach. Psychol
49. Nagin D. Group-based modeling of development. Cambridge, Mass.: Harvard University Press, 2005. 50. SAS Institutes. The GLIMMIX Procedure. SAS Institutes: 1-244.
51. Zhu M. Analyzing Multilevel Models with the GLIMMIX Procedure. Paper SAS026-2014, SAS Institute Inc, 2014.
52. Thompson C.A., Arah O.A. Selection bias modeling using observed data augmented with imputed record-level probabilities. Ann Epidemiol, 2014; 24: 747-753.
53. Seaman S.R., White I.R. Review of inverse probability weighting for dealing with missing data. Stat
Methods Med Res, 2011; 22: 278-295.
54. Kass R., Raftery A. Bayes factors. J Am Stat Assoc, 1995; 90: 773-795.
55. Blaszczynski A., Nower L. A pathways model of problem and pathological gambling. Addiction, 2002; 97: 487-500.
56. Nower L., Martins S.S., Lin K.H., Blanco C. Subtypes of disordered gamblers: results from the National Epidemiologic Survey on Alcohol and Related Conditions. Addiction, 2012; 108: 789-798.
57. Milosevic A., Ledgerwood D.M. The subtyping of pathological gambling: A comprehensive review. Clin
Psychol Rev, 2010; 30: 988-998.
58. Ledgerwood D.M., Petry N.M. Psychological experience of gambling and subtypes of pathological gamblers. Psychiatry Research, 2006; 144: 17-27.
59. Zuckerman M. Sensation seeking and risky behavior. Washington D.C.: American Psychological Association, 2007.
60. Lynne-Landsman S.D., Graber J.A., Nichols T.R., Botvin G.J. Is sensation seeking a stable trait or does it change over time? J Youth Adolescence, 2011; 40: 48-58.
61. Cauffman E., Shulman E.P., Steinberg L., Claus E., Banich M.T., Graham S., Woolard J. Age differences in affective decision making as indexed by performance on the Iowa Gambling Task. Dev Psychol, 2010; 46:193-207.
62. Harden K.P., Quinn P.D., Tucker-Drob E.M. Genetically Influenced Change in Sensation Seeking Drives the Rise of Delinquent Behavior during Adolescence. Developmental Sci, 2012; 15: 150-163.
63. Vitaro F., Wanner B. Predicting early gambling in children. Psychol Addict Behav, 2011; 25: 118-126. 64. Public Sector Gaming Study Commission. Final Report of the Public Sector Gaming Study Commission. National Council of Legislators from Gaming States. NCLGS National Office, 2000; www.nclgs.org.
65. LaPlante D.A., Shaffer H.J. Understanding the influence of gambling opportunities: expanding exposure models to include adaptation. Am J Orthopsychiat, 2007; 77: 616-623.
Figure 1
Trajectories of Gambling Variety from age 15 to age 30 and association with Complete Scales (CS) of Gambling Variety at each time of assessment
% sample / %Girls; %Boys 0 1 2 3 4 5
Age 15 Age 22 Age 30
N u m b e r o f D iff e re n t Gam b lin g A ctiv ities
Late-onset Low: 26.7%/G:30.1%; B:25.9% Early-onset Low: 64.8%/G:66.4%; B:60.0%
High: 8.4%/G:3.5%; B:14.2% Late-onset Low/Complete scale
Early-onset Low/Complete scale High/Complete scale
64.8% (G: 66,4%; B: 60,0%***) 26.7% (G: 30,1%; B: 25,9%***)
Figure 2
Association between Trajectories of Gambling Variety (GV) and Gambling Problems (GP) at age 30
a-c: Same letters indicate values that do not significantly differ from each other at p.<.05. ***: p.<.001 94.1 91.0 74.7 5.9a 9.0a 25.3b*** 0% 10% 20% 30% 40% 50% 60% 70% 80% 90% 100%
Late-onset Low GD Early-onset Low GD High GD GP- GP+
GP- GP+ Late-onset Low GD Early-onset Low GD High GD
6.3 66.2 27.5 16.5 62.8 20.7***
Table 1 Gambling Activities reported at age 15 and age 30 by participants following different Trajectories of Gambling Variety
a-c: Same letters indicate columns values that do not significantly differ from each other at p. <.05.
Gambling Activities Last 12 months
Age
Trajectories of Gambling Variety Late-onset Low % Rank Early-onset Low % Rank High % Rank
Tossing coins for money 15 0,9a --- 11,0b (7) 34,4c (7)
Playing cards for money 15 0,0a --- 36,0b (2) 83,4c (2)
30 16,6a (3) 19,9a (3) 71,6b (2)
Playing skill games for money 15 0,0a --- 22,5b (5) 70,0c (4)
30 5,3a (7) 6,1a (7) 36,3b (6)
Betting money on sports 15 0,0a --- 23,6b (4) 72,6c (3)
30 5,4a (6) 7,8a (6) 38,0b (5)
Betting money on races 15 0,0a --- 1,9b (9) 11,3c (9)
30 1,1a (11) 0,6a (11-12) 1,0a (12)
Playing bingo for money 15 0,0a --- 28,4b (3) 49,3c (5)
30 5,6a (5) 9,3b (5) 16,7c (9)
Playing dice games for money 15 0,0a --- 4,9b (8) 26,4c (8)
30 0,8a (12) 0,6a (11-12) 3,9b (11)
Betting money in gambling machines 15 0,0a --- 21,1b (6) 47,7c (6)
30 14,9a (4) 13,7a (4) 52,0b (4)
Buying lottery tickets 15 0,0a --- 74,8b (1) 93,3c (1)
30 70,2a (1) 74,9a (1) 94,1b (1)
Playing other games for money 30 3,1a (8) 2,1a (9) 20,6b (7-8)
Going to casinos 30 20,0a (2) 24,7a (2) 56,9b (3)
Playing the stock and/or commodities market
30 2,8a (9) 3,2a (8) 11,9b (10)
Playing games for money on the internet
Table 2
Age 15 and age 30 categories of gambling frequency by trajectories of gambling variety
Frequency of Gambling
Behaviors Last 12 months Age
Trajectories of Gambling Variety Late-onset Low (%) Early-onset Low (%) High (%)
Never or Less than once/month 15 99.8a*** 57.7b 28.1c***
30 73.6a 69.0a 36.3b***
Once/month 15 0.2 a*** 28.8b 35.9b
30 15.7a 16.8a 33.3 b***
Once/week 15 0.0a*** 11.6b 32.0***c
30 7.9a 10.9a 17.6 b***
More than once/week 15 0.0 a*** 1.9b 3.9b
30 2.8a 3.2a 12.7 b***
a-c: Same letters indicate columns values that do not significantly differ from each other at p. <.05.
Table 3
Generalized linear mixed model of trajectories of gambling variety’s association with problem gambling at age 30, controlling for problem gambling at age 15, frequency of gambling at age 15 and 30, gender, education and SES
Covariates Estimate S.E. t-value Sig. O.R. 95% C.I. for O.R.
Lower Upper
Fixed effects
- Gender 0.6232 0.1928 3.23 0.0013 1.865 1.277 2.723
- Family SES : age 15 0.7269 0.7181 1.01 0.3116 2.069 0.505 8.467
- Problem gambling : age 15 (At least one vs none)
0.7247 0.2141 3.39 0.0007 2.064 1.356 3.142
- Frequency of gambling : age 15 (Once/week or more vs Once/month or less)
-0.3248 0.2811 -1.16 0.2483 0.723 0.416 1.255
- Education : age 30 0.1866 0.1496 1.25 0.2126 1.205 0.899 1.616
- Household SES : age 30 -0.0973 0.0406 -2.40 0.0167 0.907 0.838 0.983
- Frequency of gambling : age 30 (Once/week or more vs Once/month or less)
1.1065 0.2052 5.39 <.0001 3.024 2.021 4.523
- Trajectories of gambling variety
High vs Late-onset Low 1.1285 0.3163 3.57 0.0004 3.091 1.661 5.750
High vs Early-onset Low 0.8145 0.2451 3.32 0.0009 2.258 1.268 4.037
Intercept -3.5942 0.4467 -8.05 <.0001
Random effects (sampling) Covar. Parameter Estimate S.E. X2 Sig.
Administrative-geographic area 0.09649 0.1215 0.84 0.1798
Schoolboard size 0.07957 0.1195 0.75 0.1939
Model Fit Statistics: -2 Res Log Pseudo-Likelihood = 6073.75 (Null Model with Random effects = 7132.27). Model Generalized X2(DF=1.83) = 1833.83. Estimation Method: Residual Pseudo-Likelihood.
![[Reprogramming equals gambling?].](data:image/gif;base64,R0lGODlhAQABAIAAAP///wAAACH5BAEAAAAALAAAAAABAAEAAAICRAEAOw==)