OATAO is an open access repository that collects the work of Toulouse
researchers and makes it freely available over the web where possible
Any correspondence concerning this service should be sent
to the repository administrator: [email protected]
This is an author’s version published in: http://oatao.univ-toulouse.fr/21614
To cite this version:
Delroisse, Henry and Torré, Jean-Philippe
and Dicharry, Christophe Effect of a Hydrophilic
Cationic Surfactant on Cyclopentane Hydrate Crystal Growth at the Water/Cyclopentane
Interface. (2017) Crystal Growth & Design, 17 (10). 5098-5107. ISSN 1528-7483
Official URL:
https://doi.org/10.1021/acs.cgd.7b00241
experimental temperature, Texp, and the hydrate equilibrium temperature, Teq), of 6 °C, and found that v decreased significantly with ΔTsub. Brown and Koh23reported an average growth rate of 0.33 mm/min (with a distribution of values ranging from 0.12 to 0.84 mm/min) at a subcooling of about 7 °C. In the presence of surfactants, the hydrate formation pattern and hydrate morphology at the water/CP interface are significantly different though. Mitarai et al.13showed that the oil soluble surfactants Span 80, naphthenic acid, and polypropylene glycol affect CP hydrate formation by hindering lateral growth and promoting the immersion of the crystals formed at the interface into the aqueous phase. Karanjkar et al.15 observed that the presence of Span 80 induced the formation of hollow conical hydrate crystals at the water/CP interface with the vertex pointing to the aqueous phase. They explained this particular morphology as the consequence of the excess surface pressure applied by the Span 80 molecules, adsorbed at the water/CP interface. This impedes the lateral growth of the forming hydrate crystals.
The effect of cationic surfactants on CP hydrate morphology has not been studied in the literature unlike that of nonionic and anionic surfactants. Yet cationic surfactants, quaternary ammonium salts (QAS) in particular, are of great interest in oil and gas production where they are used to prevent pipeline plugging by gas hydrate particles.8 Obtaining greater insight into the morphology of hydrate crystals in the presence of QAS might provide us with a better understanding of their antiagglomerant properties.
In the present work, we studied the influence of a water soluble QAS, used at different concentrations, on CP hydrate growth and morphology. Most of the microscopic observations of hydrate formation at the water/CP interface were performed at a temperature of 1 °C. Because the adsorption of ionic surfactants is known to be modified by the presence of electrolytes,24−26 we also investigated the effect of NaCl at different concentrations. Adding NaCl to the surfactant solution was found to have a huge effect on the hydrate formation pattern and hydrate morphology. In order to understand the effect of the salt, we investigated the interfacial activity of the surfactant studied, with and without NaCl, by performing dynamic interfacial tension measurements.
■
EXPERIMENTAL SECTIONMaterials. Cyclopentane (reagent grade, 98%) was supplied by Acros Organics. The surfactant used in the study was a commercial quaternary ammonium salt, Noramium DA 50 (benzyl dodecyl dimethylazanium chloride, C21H38ClN), provided by Arkema Ceca.
The DA 50 molecules have a linear alkyl chain of 12 carbon atoms on average, two short methyl groups, and a benzyl group bonded to the nitrogen (Figure 1). A linear alkyl chain of 12 carbon atoms is ostensibly the optimum chain length for achieving good antiagglomer ant performance with this surfactant class.27
Sodium chloride (purity of 99.8%) was supplied by Chem Lab. It was used at concentrations of 0 to 4 wt % in the aqueous phase, in order to study the salt effect on hydrate growth and morphology within a concentration range that could be of interest for preventing gas hydrate agglomeration through the use of antiagglomerant
surfactants. In fact, the salt concentration in oil and gas produced water may vary from a few tenths of a percent to several percent (or in some cases several tens of percent).28Pure water (resistivity of 18.2 mΩ.cm), produced by a laboratory water purification system from Purelab, was used to prepare the surfactant solutions. Three surfactant concentrations were used in the CP hydrate formation experiments: 1, 0.1, and 0.01 wt % (of the aqueous phase).
In preliminary experiments, we performed surface tension measure ments to determine the critical micellar concentration (CMCDA50) of
DA 50 without and with NaCl. We found values of CMCDA50ranging
from 0.15 wt % without NaCl to 0.006 wt % with 4 wt % NaCl (see Table 3). Therefore, the DA 50 concentrations of 1 and 0.1 wt % used in the hydrate formation experiments correspond to a saturated water/ CP interface for all systems, whereas the one of 0.01 wt % corresponds to an under saturated interface for the systems with less than 2 wt % NaCl.
Measurement of CP Hydrate Equilibrium Temperature. The presence of salt is known to decrease the hydrate equilibrium temperature (Teq).19In order to calculate the subcoolings (ΔTsub) at
which the hydrate formation experiments were conducted, Teqof CP
hydrates were experimentally determined for 0, 2, 3, and 4 wt % NaCl. For this purpose, CP hydrates were prepared in test tubes with 4 cm3
of a mixture of CP and water (or brine) at the stoichiometric molar ratio (17:1). To trigger hydrate formation, the test tubes werefirst placed overnight in a freezer at−11 °C, before being immersed in a water−glycol bath in a chiller (Fisher Scientific, Polystat 37) at 1 °C. Once hydrates had formed in each test tube, the bath temperature was increased by steps of 0.2 °C, and each level of temperature was maintained for at least 1 h. The hydrate equilibrium temperature values presented inTable 1correspond to the temperatures at which
hydrate crystals were no longer visible to the naked eye in the test tube. For a pure CP hydrate, we obtained Teq= 7.2± 0.2 °C, which is
consistent with the values usually reported in the literature.19 Visualization of CP Hydrate Formation. Hydrate growth and morphology were studied by microscopic observation of the interface between the water and CP phases. The mixture had been previously placed in a cylindrical glass tube 110 mm high with an inner diameter of 28 mm (Figure 2). The large inner diameter of the glass tube allowed a planar water/CP interface to form at the center of the tube, thus avoiding curvature effects which may induce focusing problems making it impossible to monitor hydrate growth. The glass tube was placed in a metal jacketed vessel in which a water−glycol mixture was circulating. The temperature of the system was controlled by a chiller (Fisher Scientific, Polystat 37). The water/CP interface was observed using a binocular magnifier (Wild Heerbrugg) positioned above the glass tube. The system was backlit by an LED light table (Edmund Optics) and snapshots and videos were acquired by a CCD camera (IDS UI124xSE C). Depending on the magnification used, the snapshots show between 1% and 16% of the total interface area between the water and the CP. For the hydrate formation experiments, 40 cm3 of aqueous solution and 5 cm3 of CP were successively
introduced into the glass tube, which was then covered with a glass cap to limit CP evaporation. When the temperature of the system reached 1°C (which corresponds to a subcooling of about 6 °C for the system without NaCl (seeTable 1)), hydrate crystallization was triggered by seeding the system with a few small CP hydrate crystals that had been formed in advance. Because of their density of around 0.96,19which is intermediate to that of bothfluid phases, the seeds collected at the water/CP interface.
Figure 1.Structure of a Noramium DA 50 molecule.
Table 1. Experimental Equilibrium Temperature,Teq, for CP Hydrates without or with NaCl, and Corresponding Subcooling,ΔTsub, at the Experiment Temperature of 1°C
NaCl (wt %) 0 2 3 4
Teq(°C) 7.2± 0.2 6.5± 0.2 6.1± 0.2 5.5± 0.2
In some experiments, CP hydrate formation was also observed at the convex surface of a sessile drop. In this case, we used a THMSG600 heating and freezing microscope stage from Linkam (Figure 3) mounted on an optical microscope (Olympus BX 50)
equipped with a CCD camera (IDS UI336xCP M). For the hydrate formation experiments, 150 mm3of CP was first introduced into a
quartz cell (height 2.6 mm, external diameter 17 mm, inner diameter 15 mm) placed on the Peltier cooling module of the THMSG600 stage at 0 °C. Then, a 0.1 mm3 drop of the aqueous solution was
introduced into the CP with a microliter syringe. The temperature of the system was decreased to−30 °C at a cooling rate of 30 °C/min to turn the liquid drop into ice. After ice had formed, the system was heated to 1°C at a heating rate of 30 °C/min to melt the ice and cause hydrate to form.
Interfacial Tension (IFT) Measurements. The effect of NaCl on the surface activity of DA 50 was quantified by IFT measurements. These measurements were performed using a dynamic drop tensiometer (Tracker S from Teclis, France). A CP drop (or air bubble in some experiments) was formed and maintained vertically at the top of an inverted needle in a transparent thermostated cell containing the aqueous phase. All experiments were performed at 1 °C. The volume of the drop (typically 2 to 7 mm3) was adjusted to
reach a Bond Number (ratio of the gravitational force to surface tension force) between 0.14 and 0.24 so the drop would have a Laplacian profile. Images of the drop were recorded in real time with a CCD camera. The IFT was calculated from the drop profile and the densities of the oil and aqueous phases.
Lateral Growth Rate Measurements. The lateral hydrate growth rate (v) was evaluated by measuring the position of the hydrate crystallization front at the water/CP interface on two snapshots taken at different instants. The values of v presented later on in this work are the means of six different points on the crystallization front. The given uncertainty is the standard deviation of the calculated values. The lateral hydrate growth rate was evaluated only for the systems where the hydrate grew as a continuous layer at the water/CP interface. In the systems in which a large number of small hydrate crystals formed
and grew separately, the movements of the crystals growing at the water/CP interface (see Supporting Information Video 1 for an example) made them rapidly exit thefield of view, preventing us from measuring their growth rate.
■
RESULTS AND DISCUSSIONGrowth and Morphology of CP Hydrates with and without Surfactant and/or NaCl.Without NaCl.Figure 4.1
shows a series of snapshots of hydrate growth at the pure water/CP interface taken at different times after the system was seeded at T = 1°C (which corresponds to a subcooling of 6 °C). Hydrate crystals grew and propagated, before forming a thin polycrystalline layer at the interface, as already reported in literature.13,18The lateral hydrate growth rate, v, was evaluated based on snapshots inFigure 4.1a and c, in the direction given by the arrow. We found v = 0.21 ± 0.02 mm/min, which is consistent with the values determined by Sakemoto et al.18(v = 0.17 mm/min) at the same subcooling.
The influence of DA 50 can be observed in Figure 4.2−4. With a surfactant concentration of 0.01 wt %, small hydrate crystals with a large amount of needles and some polygonal shapes grew at the interface (Figure 4.2a,b,c). They formed a hairy lattice, and the“new” crystals appeared to push the “old” ones into the water phase, where they formed a thick unconsolidated hydrate layer (of about 4 mm after 150 min). With 0.1 and 1 wt % DA 50, a large number of small hydrate crystals with polygonal and triangular geometries (Figure 4.3 and 4), as well as some with a sword like geometry observed at 0.1 wt % DA 50, formed at different points of the interface. Similar observations had already been reported by Mitarai et al.13but in the presence of oil soluble surfactants. The crystals rapidly aggregated and formed a hydrate layer that grew laterally as an assembly of smooth and striated plates separated by wrinkled areas. The average lateral hydrate growth rate Figure 2.Schematic diagram of the experimental setup: (1) metal
jacketed vessel; (2) glass tube (diameter 28 mm); (3) glass cap; (4) LED light table; (5) chiller; (6) binocular magnifier with a camera; (7) aqueous solution; (8) cyclopentane; (9) hydrate crystals for seeding.
Figure 3.THMSG600 temperature controlled microscope stage: (a)
overview; (b) top view of the Peltier module and the quartz cell. Figure 4.Snapshots of CP hydrate growth at the water/CP interface without NaCl and in the presence of 0 to 1 wt % DA 50, at a subcooling of 6°C. The initial time (t = 0 min) corresponds to the seeding.
(determined in the directions given by the arrows inFigure 4.3a and 4b) was approximately 0.10 mm/min for both surfactant concentrations, meaning it was about twice as slow as without surfactant. The average lateral growth rate values obtained for the different experiments are summarized inTable 2.
The differences in the hydrate growth behaviors observed between 0.01 wt % and higher concentrations of DA 50 might result from differences in the configuration of the surfactant molecules adsorbed on the hydrate surface, which is likely to depend on the surfactant concentration used. Lo et al.29 described three adsorption steps on the surface of CP hydrates with the cationic surfactant DTAB (dodecyl trimethylammo nium bromide), from a “lying down” configuration (i.e., with the surfactant headgroup and alkyl chain tail lying on the hydrate surface) for low concentrations (<0.17 mmol/L of DTAB) to a bilayer formation at higher concentrations (>3.8 mmol/L). Note that the reported DTAB concentrations are equilibrium bulk concentrations measured after adsorption of the surfactant on the CP hydrate surface. So, at the initial bulk concentration (i.e., before adsorption of the surfactant molecules on the hydrate surface) of 0.01 wt % DA 50 (∼0.3 mmol/L), corresponding to CMCDA50/15, the DA 50 molecules might have been adsorbed in a “lying down” configuration, while at 0.1 wt % (0.67 × CMCDA50) and 1 wt % (6.7 × CMCDA50) their alkyl chain tail would have been predominantly oriented away from the hydrate surface, with the potential formation of a bilayer at the highest concentration (1 wt %).
We will see in the next section that adding 2 or 3 wt % NaCl to a 0.01 wt % DA 50 solution induced the same change in hydrate morphology as observed when the concentration of DA 50 was increased from 0.01 to 0.1 or to 1 wt % without NaCl (see Figure 5.2c,3a,4a). In the case of ionic surfactants, it is common knowledge that increasing the ionic strength of the solution causes an increase in the amount of surfactant molecules adsorbed.25,26,30 Consequently, changes in the adsorption configuration of the adsorbed surfactant molecules are a possibility. We therefore believe that this observation (i.e., a change in the hydrate morphology when 2 or 3 wt % NaCl are added to the 0.01 wt % DA 50 solution) supports our hypothesis that the differences in hydrate growth behavior
without NaCl observed at DA 50 concentrations of 0.01 wt % and more are due to differences in the configuration of the surfactant molecules adsorbed on the hydrate surface, and that a “lying down” adsorption configuration is possible at low concentrations (≤0.01 wt %). Such a configuration might limit the growth of some faces of the forming hydrate crystals, resulting in the formation of loose hairy crystals instead of large plates as observed at higher surfactant concentrations.
With NaCl. Figure 5shows the influence of NaCl on the morphology of CP hydrates formed without and with DA 50 at 1°C. The times given below the snapshots were measured as from when the system was seeded. Remember that only 1−16% of the total area between the water and the CP can be seen in each snapshot. Consequently, even though the entire visible area appears to be covered with a hydrate layer in some Table 2. Lateral Hydrate Growth Rate,v, for Pure System and Systems with NaCl and/or DA 50
system NaCl (wt %) ΔTsub(°C) v (mm/min)
water/CP 0 6.2 0.21± 0.02 2 5.5 0.0024± 0.0003 3 5.1 NDa 4 4.5 ND 4 6.2 0.042± 0.004 water/CP + 0.01 wt % DA 50 0 6.2 ND 2 5.5 0.022± 0.004 3 5.1 0.032± 0.011 4 4.5 ND water/CP + 0.1 wt % DA 50 0 6.2 0.11± 0.01 2 5.5 0.019± 0.003 3 5.1 ND 4 4.5 ND water/CP + 1 wt % DA 50 0 6.2 0.10± 0.01 2 5.5 0.029± 0.006 3 5.1 ND 4 4.5 ND aND: Not Determined.
Figure 5.Snapshots showing CP hydrate morphologies at different times, with 0, 2, 3, and 4 wt % NaCl without surfactant, and in the presence of 0.01, 0.1, and 1 wt % DA 50 at 1°C. The initial time (t = 0 min) corresponds to the seeding.
snapshots, this does not necessary mean that the whole water/ CP interface was covered. With 2 wt % NaCl and without DA 50 (Figure 5.1b), large hexagonal crystals (500 μm for the largest) developed and agglomerated at the water/CP interface. Once they had aggregated, they formed a hydrate shell composed of smooth and highly striated plates that slowly covered the interface. The average lateral growth rate was very slow (∼0.0024 mm/min) (see Table 2). Furthermore, the hydrate shell seemed to be thicker with 2 wt % NaCl than without NaCl. This is probably because the hydrate crystals had much more time to grow in the direction normal to the water/ CP interface before the hydrate layer totally covered it. With 3 and 4 wt % NaCl (Figure 5.1c,d), a few hexagonal and “non geometrical” crystals formed very slowly at the water/CP interface and agglomerated on the sides of the glass tube, and most of the interface remained free of hydrate particles 17 h after the system was seeded. Because of the continuous movements of the hydrate crystals at the water/CP interface, they rapidly exited the field of view, preventing us from measuring their lateral growth rate. However, we observed that the growth rate dropped drastically compared to the same DA 50 solution, this time with 2 wt % NaCl. The decrease in hydrate growth rate is partly due to the decrease of the subcooling with the increase in salt concentration (Table 2). Actually, in supplementary experiments, involving hydrate formation at the same subcooling of 6°C, the average lateral growth rate was found to be v = 0.21± 0.02 mm/min for the pure system and 0.042± 0.004 mm/min for the system with 4 wt % NaCl. Note that in the latter case, the experiment temperature was−1 °C. This is higher than the ice formation temperature with 4 wt % NaCl, which is −2.4 °C.31 Consequently, ice did not develop, and hydrate formation only was observed in this experiment. The decrease of v with an increasing concentration of NaCl is consistent with that reported by Kishimoto et al.,12 who explained it by the decrease in hydrate nucleation rate with the increase in NaCl concentration. However, the values we obtained in the presence of salt were generally much lower than those of Kishimoto. For example, the value of 0.0024 mm/min we found for 2 wt % NaCl is at least 10 times lower than the value estimated from Kishimoto’s data. The reason for this might be differences in the experimental protocols. Kishimoto et al. observed hydrate crystals growing laterally in the meniscus formed by the water/ CP interface against the wall of a glass test tube, while we observed crystals growing on a planar interface. Growth on a curved interface and the interaction between the growing crystals and the glass wall might affect the hydrate growth rate. Another factor is that, during hydrate crystallization, the temperature on the wall of the glass tube, in contact with the coolantfluid, is probably colder than elsewhere; this is therefore conducive to more efficient removal of the heat produced by the crystallization, and results in a higher growth rate.
The influence of NaCl was then studied in the presence of DA 50. With 0.01 wt % DA 50 and 2 wt % NaCl (Figure 5.2b), instead of hairy crystals as for the system without NaCl, a large number of very small crystals formed in thefirst hour after the seeding. They aggregated to form a large hydrate plate. The plate then grew slowly, forming a thick polycrystalline layer, which swallowed up some of large hexagonal crystals. For this system, we measured a lateral growth rate of 0.022 ± 0.004 mm/min. With 3 wt % NaCl (Figure 5.2c), the hydrate growth pattern and morphology looked like the one observed for the system without NaCl and with 0.1 and 1 wt % DA 50 (Figure
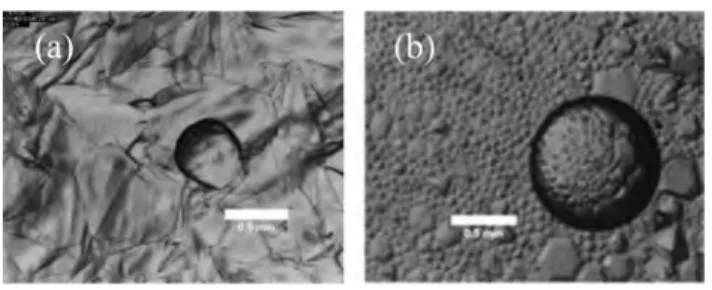
4.3,4). Small hydrate crystals formed and then rapidly aggregated into a hydrate layer that grew laterally as an assembly of smooth and striated plates at a rate of 0.032 ± 0.011 mm/min. With 4 wt % NaCl (Figure 5.2d), a few small triangular hydrate crystals formed and rapidly agglomerated on the glass tube wall. Needles were then observed to slowly grow from the triangular crystals, seemingly on the water/CP interface. No new hydrate crystals appeared at the interface, and only the triangular crystals formed in thefirst instants grew very slowly and became more voluminous. Five hours after the system was seeded, most of the interface remained totally free of hydrate crystals. With 0.1 and 1 wt % DA 50 and 2 wt % NaCl (Figure 5.3b and 4b), a number of pyramidal crystals appeared soon after the seeding and rapidly aggregated before growing laterally along the water/CP interface. The formed hydrate shell appeared to be composed of large plates, both smooth and striated, with more salient edges compared to the system without NaCl, swallowing up some pyramidal crystals (see the arrows in Figure 5.4b). The hydrate covered the water/CP interface at about the same rate for both surfactant concentrations (0.029± 0.006 and 0.019 ± 0.003 mm/min for 0.1 and 1 wt % DA 50 respectively), but this was five times slower than for systems with the same concentrations of DA 50 but without NaCl (∼0.10 mm/min). So, as observed for the pure water/CP system, adding NaCl decreased the lateral hydrate growth rate but to a much lesser extent than without DA 50 (in the latter case, the rate was divided by 100 between 0 and 2 wt % NaCl). With 3 and 4 wt % NaCl (Figure 5.3c and 4c), the hydrate growth pattern drastically changed. A large number of small individual crystals with perfect hexagonal or triangular geometries formed at the water/CP interface. They rapidly grew laterally (Figure 6a,b) and then normally to the interface, forming pyramidal cones with the vertex pointing to the CP phase, until the interface was totally covered (Figure 6c−e).
The pyramidal crystals seemed full and composed of a“pile” of thin hydrate layers (seeSupporting Information Video 1). The final lateral sizes of the crystals ranged from 50 (Figure 5.3c) to 500μm (Figure 5.4c) with 3 wt % NaCl, and from 70 to 300 μm (Figure 5.3d and 4d) with 4 wt % NaCl. The pyramidal crystals formed have geometric similarities with the hollow conical crystals observed by Karanjkar et al.15
However, instead of increasing the wettability of CP hydrates for the water phase as Span 80 did, DA 50 increased their wettability Figure 6.Snapshots of CP hydrate formation in the presence of 1 wt % DA 50 with 4 wt % NaCl at 1°C. The initial time (t = 0 min) corresponds to the seeding.
for the CP phase. Furthermore, the pyramidal crystals did not agglomerate and remained at equal distance from one other (seeSupporting Information Video 1) until the interface was completely packed. At the end of the experiment, we conducted an additional test to find out if the pyramidal crystals were agglomerated or not. By gently pushing down the hydrate layer with a glass pipet, it clearly appeared that the layer was consolidated (we could push it below the w/o interface without breaking it). Consequently, even in the presence of the additive, each individual pyramidal crystal eventually bound to its neighbors when they came into contact, forming a continuous rigid hydrate layer at the water/CP interface.
An interesting observation is that in the system with 0.01 wt % DA 50 and 4 wt % NaCl (Figure 5.2d), most of the water/ CP interface remained free of hydrate particles, whereas with 0.1 and 1 wt % DA 50 (Figure 5.3d and 4d), the whole interface was covered in less than 1 h. In the former case, the decrease in the hydrate nucleation rate induced by NaCl was probably the dominant factor in the hydrate formation pattern observed.
Additional experiments were conducted with sessile sub microliter water droplets immersed in CP using the Linkam stage atΔTsub= 6 °C. Without or with 0.01, 0.1, and 1 wt % DA 50, and without NaCl, hydrates formed a shell around the droplet. As observed in the experiments performed on the planar water/CP interface, adding NaCl at a concentration of 3 wt % or more to the 1 wt % DA 50 solution drastically modified the hydrate formation pattern. With 4 wt % NaCl, the pyramidal hydrate crystals at the (curved) water/CP interface gave a hedgehog shape to the drop (Figure 7a). The height of these crystals was about 40 μm at the end of the hydrate formation.
In another experiment on the same system, the hydrates were dissociated by heating the system to 6.5°C for 60 s (Teq= 5.5 °C with 4 wt % NaCl), and then reformed by cooling them to −1 °C (the melting point of ice is −2.4 °C at 4 wt % NaCl) in order to work with the same subcooling value as with the system without NaCl. In this second hydrate formation experiment, much larger pyramidal crystals (between 70 and 150μm high) were observed (Figure 7b).
Investigating the Influence of NaCl on the Interfacial Activity of the Surfactant. The observation of CP hydrate formation at the water/CP interface showed that adding NaCl at a concentration of 3 wt % or more to a solution of 0.1 or 1 wt % DA 50 induced considerable changes in both the morphology of the hydrate crystals and in the hydrate formation pattern. Adding salt to water with an ionic surfactant is known to affect its adsorption at the interfaces, and thus the
interfacial properties. Therefore, in order to better understand the effect of DA 50 and NaCl on CP hydrate formation, we performed IFT measurements at different DA 50 and NaCl concentrations. We also discussed the changes in hydrate wettability observed in the previous experiments between 2 and 3 wt % NaCl, at concentrations of DA 50 of 0.1 and 1 wt %.
Interfacial Activity of DA 50. Figure 8 shows the IFT between CP and water as a function of time for concentrations
of DA 50 below and above the CMC (0.15 wt %). Note that in the IFT experiments, we also investigated a smaller concentration of DA 50 (which was chosen arbitrarily at 0.003 wt %) than in the morphology experiments because at higher surfactant concentrations and with NaCl, the IFT decreased to a very low value (<1 mN/m) and the drop detached itself from the needle too rapidly for the IFT to be measured for more than just a few seconds.
The value at which the IFT stabilizes and the time needed to reach it largely depend on surfactant concentration: the higher the concentration, the lower the IFT, and the shorter the stabilization time. For 1 wt % DA 50 (>CMCDA50), the IFT stabilized almost instantaneously at about 2.5 mN/m. The presence of micelles in the solution is an additional source of surfactant monomers which, assuming a high micelle dissolution rate constant, might accelerate the decrease in dynamic surface tension.32For 0.1 wt %, which is slightly lower than CMCDA50, the IFT stabilized at a value somewhat higher than for 1 wt % DA 50 after about 1 min. For 0.01 and 0.003 wt % DA 50 (CMCDA50/15 and CMCDA50/50, respectively), the IFT decreased slowly and took several minutes to stabilize at a much higher value (>20 mN/m) than for 0.1 and 1 wt % DA 50. The longer amount of time required for IFT stabilization observed for 0.003 and 0.01 wt % DA 50 reflects slower adsorption kinetics due to the low surfactant concentrations used and probably also to rearrangements or reorientations of the adsorbed surfactant molecules. Dopierala and Prochaska33 demonstrated that quaternary ammonium salts with an asymmetrical structure (as is the case for DA 50) show a strong tendency to reorient themselves.
As mentioned above, we studied the influence of NaCl on the IFT between water and CP at 0.003 and 0.01 wt % DA 50 only.Figure 9shows the IFT decay as a function of time for 0 to 4 wt % NaCl. The same tendency was observed for both surfactant concentrations. In the presence of NaCl, the IFT steeply decreased and reached much lower values than without NaCl: the higher the salt concentration, the greater and faster the reduction of the IFT. It has already been demonstrated that adding nonamphiphilic salt can considerably accelerate the Figure 7.CP hydrate formation in the presence of 1 wt % DA 50 and
4 wt % NaCl after thefirst formation experiment (a), and after hydrate dissociation−reformation (b).
Figure 8.Interfacial tension (IFT) between CP and water with 0.003, 001, 0.1, and 1 wt % DA 50 as a function of time.
dynamic adsorption of an ionic surfactant.34For 0.003 wt % DA 50 and 4 wt % NaCl, the CP drop detached itself from the top of the inverted needle about 120 s after the beginning of the experiment due to the low values attained by the IFT (<1 mN/ m). For 0.01 wt % DA50 and the NaCl concentrations investigated, the drop rapidly detached itself from the needle (after less than 10 s, 15 s, 20 s, and 150 s for 4, 3, 2, and 1 wt % NaCl, respectively). The reduction in IFT as the salt concentration increases is the consequence of the screening of the electrical repulsion between the ionic head groups of the surfactant molecules in the presence of an electrolyte, causing them to be more densely packed at the water/CP interface.30
In their study on the morphology of CP hydrate crystals formed in the presence of the nonionic surfactant Span 80, Karanjkar et al.15concluded that the packing of the surfactant molecules adsorbed at the water/CP interface plays a key role in the hydrate formation pattern and morphology. In actual fact, they attributed the morphology transition they observed, from plate like to hollow conical crystals, to the crowding of the surfactant molecules at the interface. In particular, they proposed that, at a high surfactant surface coverage, the hydrate crystal growth at the water/CP interface results in overcrowding of the adsorbed surfactant molecules in the remaining interfacial area. This excess surface concentration is likely to cause excess surface pressure that acts as a mechanical barrier, impeding the lateral growth of the hydrate crystals that are forming.
In order to quantify the effect of salt on the interfacial packing of the DA 50 molecules, we evaluated the surface concentration (or surface excess) of DA 50 at saturation Γ∞ and the effective area per adsorbed DA 50 molecule a0(=
Γ∞
N
1
A
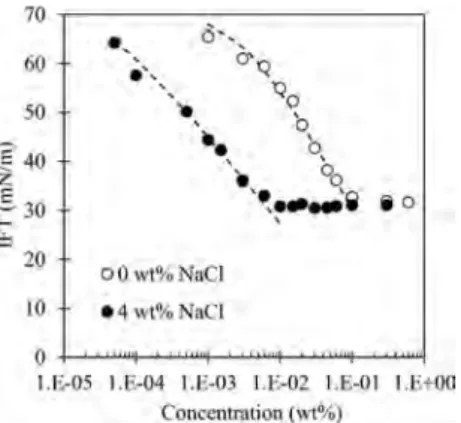
, where NA is Avogadro’s number) without and with NaCl. For these experiments, we measured the IFT between the air and the water using different DA 50 concentrations and 0 to 4 wt % NaCl, since the IFT between the CP and the water at high DA 50 concentrations was too low (<1 mN/m) to be measured with our tensiometer.Figure 10shows the equilibrium surface tension as a function of the logarithm of the DA 50 concentration for the systems without and with 4 wt % NaCl. Both the IFT vs the Log (c) curves show a similar profile, but for the experiment with NaCl the curve is shifted toward lower concentrations of DA 50. Accordingly, this results in a significant depression of the CMC (which corresponds to the break in the curves) of the DA 50 (Table 3).
The surface concentration Γ can be estimated using the Gibbs equation: γ Γ = − ∂ ∂ ⎜ ⎟ ⎛ ⎝ ⎞ ⎠ nRT c 1 ln T (1)
where n = 1 for ionic surfactants in the presence of excess electrolytes, and n = 2 for 1:1 ionic surfactants, R is the gas constant, T the temperature,γ the interfacial tension, and c the bulk surfactant concentration.
Based on the maximum slope of the IFT vs Log (c) curve (Figure 10), we obtainedΓ∞= 2.34× 10⁻⁶mol/m2(and a0= 71 Å2) for the system without NaCl, and Γ∞ = 3.13 × 10⁻⁶ mol/m2(and a0= 53 Å2) for the one with 4 wt % NaCl (see in
Table 3 the values for the other salt concentrations). The relative error on these values is estimated to be less than 8%.
We fitted the IFT values for the surfactant concentrations below the CMC using the Frumkin eq (eq 2) and the Langmuir isotherm (eq 3):30 = + Γ − Γ Γ ∞ ∞ ⎛ ⎝ ⎜ ⎞ ⎠ ⎟ nRT IFT IFT0 ln 1 (2) Γ = Γ + ∞ K c K c 1 L L (3)
where KL is the Langmuir equilibrium adsorption constant. Thefit (see the dashed line inFigure 10) gives a value of KL = 20 m3.mol−1 for the system without NaCl and an average value of 1776 m3.mol−1for the systems with NaCl: the larger the value of KL, the more surface active the surfactant (i.e., the higher its ability to reduce surface tension).
Consequently, the changes in the values of Γ∞, a0, and KL confirm that in the presence of salt, the DA 50 molecules are more surface active and more densely packed at the air/DA 50 solution interface. One can expect the same tendency at the CP/DA 50 solution interface, since DA 50 is a water soluble surfactant.
Figure 9.Interfacial tension (IFT) between CP and water with 0, 1, 2, 3, and 4 wt % NaCl and 0.003 wt % DA 50 (left), and 0.01 wt % DA 50 (right).
Figure 10.Equilibrium surface tension as a function of the logarithm of the DA 50 concentration without and with 4 wt % NaCl. Table 3. Critical Micellar Concentration (CMC), and Adsorption Equilibrium Parameters of the Langmuir Isotherm As Determined from Equilibrium Surface Tension Data, at 0 to 4 wt% NaCl NaCl (wt %) 0 1 2 3 4 CMC (wt %) 0.15 0.02 0.011 0.008 0.006 Γ∞(×10−6mol.m−2) 2.34 2.39 2.74 2.97 3.13 a0(Å2) 71 69 61 56 53 KL(m3.mol−1) 20 1820 1923 1695 1667
At concentrations of 0.01, 0.1, and 1 wt % DA 50 and 4 wt % NaCl, which are higher than the CMC (Table 3), the interface is saturated. As pointed out by Karanjkar et al.,15excess surface pressure on a saturated interface can be generated only if the surfactant desorption rate is slower than the hydrate crystal growth at the interface. These authors observed that most of the crystals that formed in the presence of 0.1% (by volume in CP) Span 80 at a subcooling of about 3.2°C were plate like, whereas hollow conical crystals formed at a subcooling of about 7°C. Since a lower subcooling induces slower hydrate growth, and therefore a slower reduction in the interfacial area, they inferred that, at a low subcooling, the adsorbed Span 80 molecules had enough time to desorb, meaning no excess surface pressure could be generated. Consequently, the hydrate crystals formed were plate like. In contrast, the fast hydrate growth at a high subcooling did not allow the Span 80 molecules sufficient time to desorb, and the authors claimed that the resultant molecular crowding generated an excess surface pressure responsible for the conical crystals observed.
In additional experiments, we observed the morphology of the hydrate crystals formed with 1 wt % DA 50 and 4 wt % NaCl at a subcooling of 1°C (instead of 4.5 °C). We assumed that the surface active properties (adsorption/desorption rates, surface concentration) of DA 50 are not significantly affected by this temperature change, unlike the hydrate growth rate that is expected to be reduced by more than 1 order of magnitude.12 In actual fact, 24 h after the seeding, the water/CP interface was almost totally free of hydrate crystals (only some hydrate crystals, isolated or agglomerated in small islands, werefloating at the interface (seeFigure 11)). This implies a huge decrease
in the rate of reduction of the interfacial area compared with the same system at a subcooling of 4.5°C, where the whole interface was covered in less than 1 h (Figure 5.4d). At such a low area reduction rate, we can reasonably assume that the adsorbed DA 50 molecules had enough time to desorb and hence remained at the same surface concentration. No excess surface pressure could therefore be generated for this system. However, as shown inFigure 11, a large number of the hydrate crystals formed had the same pyramidal shape as at a higher subcooling.
This experimental result suggests that the morphology changes of the hydrate crystals, from plate like to pyramidal when the NaCl concentration is increased from 0 to 4 wt % at 0.1 or 1 wt % DA 50, or from hairy to pyramidal when the DA 50 concentration is increased from 0.01 to 0.1 or to 1 wt % at 4 wt % NaCl, are not due to excess surface pressure. Our conjecture is that the adsorption kinetics of the DA 50
molecules on the forming hydrate crystals, and their density and configuration on the hydrate surface, play a key role in the hydrate crystal morphology. At a high DA 50 concentration and with NaCl, the surfactant molecules adsorbed more rapidly and densely on the growing crystal surface than without NaCl, and in a configuration that makes the hydrate crystal CP wettable, promoting its growth in the direction normal to the water/CP interface. An experimental observation that suggests different adsorption configurations inducing different hydrate crystal wettabilities s is that a small drop deposited on the hydrate shell formed without NaCl and 0.1 or 1 wt % DA 50 spreads (Figure 12a), whereas the pyramidal crystals formed at 4 wt % NaCl are CP wettable (see the next section).
Wettability of CP Hydrates. The growth of the pyramidal crystals in the CP phase (Figure 7) suggests that the hydrate formed is CP wettable. This point was confirmed by the experiments performed on a curved water/CP interface, in which the pyramidal hydrate crystals were clearly seen to be ejected from the water/CP interface to the CP phase (see
Supporting Information Video 2). It was also confirmed by placing a drop of aqueous solution (4 wt % NaCl, 1 wt % DA 50) at the top of the pyramidal crystals formed at the planar water/CP interface an hour and half after the crystals had completely covered the interface. The interface remained quasi spherical and did not wet the hydrate surface (Figure 12b).
These observations regarding hydrate wettability can be interpreted using the spreading coefficient, which is the driving force behind the spreading of a liquid over a solid. The spreading coefficient of CP on CP hydrates is defined by30
γ γ γ
= − +
SCP/H H/W (H/CP CP/W) (4)
where γH/W is the interfacial tension between hydrates and water,γH/CP the interfacial tension between hydrates and CP, andγCP/Wthe interfacial tension between CP and water.
If SCP/His positive, the hydrates are wetted spontaneously by CP, and if it is negative, the hydrates are wetted by water. In the case without surfactant, we measuredγCP/W0 = 49± 1 mN/m, and the IFT values for γH/W0 and γH/CP0 were taken from literature:γH/W0 = 0.32± 0.05 mN/m35
up to 45± 1 mN/m,36 andγH/CP0 = 47± 5 mN/m.35Because (γH/CP0 +γCP/W0 ) >γH/W0 , SCP/H0 is negative and CP hydrates are therefore water wettable. In the case with 0.1 or 1 wt % DA 50 and concentrations of 3 wt % NaCl and more, observations revealed that the hydrate crystals are CP wettable. In these conditions SCP/H> 0. All the IFT values ineq 2are modified by the adsorption of the DA 50 molecules. Based on our IFT experiments (Figure 8), we were able to deduce thatγCP/W reaches values lower than 1 mN/m. The values of γH/W and γCP/W are not known. As already Figure 11.Pyramidal hydrate crystals formed at 1 wt % DA 50 and 4
wt % NaCl, at a subcooling of 1°C after 24 h.
Figure 12.Drop of aqueous solution (of the same composition as the solution used to form the hydrate) put on the top of the hydrate layer formed with 1 wt % DA 50 without NaCl (a), and 1 wt % DA 50 and 4 wt % NaCl (b).
reported in the literature,29 the surfactant molecules can be adsorbed in different configurations on the hydrate surface: (i) lying down, with both the headgroup and alkyl chain tail “attached” to the hydrate surface, (ii) head down, with the headgroup attached to the hydrate surface and the alkyl chain tail oriented away from it, and (iii) forming a bilayer where the alkyl chain tails of both surfactant molecule layers are attached by hydrophobic interaction, and the head groups of the second layer are oriented away from the hydrate surface. At concentrations of 0.1 or 1 wt % DA 50 and with 4 wt % NaCl, we can reasonably assume that the interfaces are saturated by the surfactant molecules, since these surfactant concentrations are much higher than the CMC with 4 wt % NaCl (see Table 3). As a consequence, the lying down adsorption configuration can be excluded. If the polar heads of the adsorbed DA 50 molecules were oriented away from the hydrate surface, the affinity of the hydrate crystals should increase toward the aqueous phase (γH/Wshould be lower than γH/W0 ) and decrease toward the CP phase (γH/CP should be higher thanγCP/W0 ). Such a variation of these interfacial tensions is not compatible with a positive value for SCP/H. This suggests that the DA 50 molecules are adsorbed in a head down configuration on the hydrate surface. With such a configuration γH/Wshould increase (γH/W>γH/W0 ) andγH/CPshould decrease (γH/CP<γCP/W0 ), which is compatible with S
CP/H> 0.
Proposed Mechanism for Hedgehog-Shaped CP Hydrate Formation. Our previous observations regarding the pyramidal crystal formation (Figures 6 and 7) led us to propose the following formation mechanism for CP hydrates (shown inFigure 13) in the presence of 0.1 to 1 wt % DA 50
and 3 to 4 wt % NaCl. Soon after seeding, polygonal crystals form at the water/CP interface (Figure 13.A) and some of the DA 50 molecules are quickly adsorbed on the hydrate crystal in a head down configuration (Figure 13.B). As already mentioned, observation of the snapshots in Figure 5b to d and in Supporting Information Video 1 suggests that the hydrate crystals grew layer by layer (Figure 13.C), and are full, unlike the hollow conical crystals observed by Karanjkar et al. with Span 80.15 The question now is how can a full hydrate crystal grow into the CP phase? Actually, for the hydrate growth front to extend into the oil phase, it has to be supplied
with water. It was demonstrated by Maeda36that a premelting layer, or quasi liquid layer (QLL), is thermodynamically favorable at the surface of a gas hydrate. In the case of CP hydrates, Aman et al.37showed that the QLL can changes into hydrates provided that (1) a bulk water phase is present next to the QLL, (2) the QLL is in contact with the CP phase, and (3) a hydrate crystal is present at the water/CP interface. Because our experiments seem to fulfill these conditions, we can assume that the QLL changes into hydrates and thus forms a new hydrate layer above the initial crystal (Figure 13.C). For the hydrate crystal to continue to grow until the vertex is formed (Figure 13.D), the water layer on the top of the crystal has to be supplied with “fresh water”. Even if the hydrate crystal is macroscopically hydrophobic due to the surfactant molecules adsorbed, its surface, or at least the part between the adsorbed surfactant molecules, should remain microscopically hydro philic and water wettable. The QLL might therefore be renewed thanks to a surface mass transfer of the water molecules from the bulk aqueous phase passing through the DA 50 molecules adsorbed on the hydrate surface. When the water/CP interface is entirely covered with pyramidal crystals, the QLLs of the adjacent crystals come into contact and become hydrate forming bridges between the bases of the crystals (Figure 13.E). As a consequence, the QLL in contact with the CP phase is no longer supplied with fresh water, and the crystals stop growing.Figure 14a shows a snapshot of the
interface after bridging of the crystals. The largest crystals did not have time to form complete pyramids. This confirms that once the base of the crystals merge, crystal growth stops. Another interesting point is that a hexagonal hydrate crystal can be seen at the top of the incomplete pyramidal crystals, and a zoomed in view (Figure 14b) confirms that the pyramids are composed of a“pile” of thin hydrate layers.
■
CONCLUSIONCP hydrate formation at a water/CP interface was studied in the presence of a hydrophilic cationic surfactant and different NaCl concentrations. In a pure water/CP system, the addition of NaCl decreased the hydrate crystal growth rate. With 0.01 wt % of surfactant, hydrate formed needles constituting a thick unconsolidated layer. At a concentration greater than 0.1 wt %, and with 0 to 2 wt % NaCl, polygonal crystals formed and agglomerated at the interface creating a shell composed of smooth and striated plates separated by wrinkled areas. As from 3 wt % NaCl, spectacular changes in hydrate morphology and growth pattern were observed. Small hydrate crystals forming pyramids with their vertex pointing to the CP formed at the water/CP interface. These changes are probably due to the Figure 13.Schematic of the proposed hydrate growth mechanism at
the water/CP interface in the presence of 0.1 to 1 wt % DA 50, and 3 to 4 wt % NaCl: (1) CP phase; (2) water phase; (3) hydrate crystal; (4) quasi liquid water layer (QLL). (A) Formation of hydrate crystals at the water/CP interface saturated with DA 50 molecules. (B) Adsorption of DA 50 molecules on the crystal. (C) Vertical growth by conversion of the QLL to hydrate. (D) Step (C) repeated right up to the vertex. (E) Full coverage of the interface by pyramidal crystals.
Figure 14.Snapshot of uncomplete pyramidal hydrate crystals at the water/CP interface with 1 wt % DA 50 and 4 wt % NaCl (a), and a zoomed view of the step pyramids formed (b).