OATAO is an open access repository that collects the work of Toulouse
researchers and makes it freely available over the web where possible
Any correspondence concerning this service should be sent
to the repository administrator:
[email protected]
To cite this version: Romedenne, M. and Rouillard, F. and Hamon, D. and
Malard, B. and Monceau, D. Carburization of austenitic and ferritic stainless
steels in liquid sodium: Comparison between experimental observations and
simulations. (2019) Corrosion Science, 159. 108147. ISSN 0010938X
This is a Publisher's version published in:
https://oatao.univ-toulouse.fr/25152/
Carburization of austenitic and ferritic stainless steels in liquid sodium:
Comparison between experimental observations and simulations
M. Romedenne
a,⁎, F. Rouillard
b, D. Hamon
c, B. Malard
d, D. Monceau
daMaterials Science and Technology Division, Oak Ridge National Laboratory, Oak Ridge, TN 37831-6156, USA
bDen-Service de la Corrosion et du Comportement des Matériaux dans leur Environnement (SCCME), CEA, Université Paris-Saclay, F-91191 Gif-sur-Yvette, France cDen-Service de Recherches Métallurgiques Appliquées (SRMA), CEA, Université Paris-Saclay, F-91191 Gif-sur-Yvette, France
dCIRIMAT, Université de Toulouse, CNRS, INPT, UPS, ENSIACET 4, allée Emile Monso BP-44362, 31030 Toulouse cedex 4, France
A B S T R A C T
Three steels were exposed in carburizing sodium at 600 and 650 °C. The kinetics and extent of carburization were characterized. Numerical simulations using the coupled thermodynamic-kinetic modeling software DICTRA were performed. It was proposed that the observed carbon diffusion profiles were induced by the combined diffusion of carbon in the grains and at grain boundaries coupled with the slow formation of carbides. The blocking effect of carbides on the carbon diffusion was observed to evolve as a function of time and mi-crostructure. Acceptable agreement between experimental and simulated intragranular carbon profiles was achieved by optimizing the labyrinth factor and phases.
1. Introduction
In the framework of the development of a Sodium-cooled Fast nu-clear Reactor (SFR) prototype for industrial demonstration called ASTRID (Advanced Sodium Technological Reactor for Industrial Demonstration), the French Alternative Energies and Atomic Energy Commission and its industrial partners have launched intensive re-search programs on several reactor components where improvements are needed. In particular, in the core of the reactor, the control rods are prone to carburization, a phenomenon responsible for their embrittle-ment and thus, reduced lifetime [1]. The nature and kinetics of ca-burization of steels in liquid sodium at 450–650 °C, where the activity of carbon in sodium is close to unity, were studied in the past. These studies led to the development of simplified carburization models pre-dicting the evolution of the carburization kinetics of stainless steels in sodium[2–7]. In these approaches, apparent diffusion coefficients of carbon Dappwere calculated by fitting the carbon concentration profiles
with the usual solution of the Fick's second law [8]. In most of the studies, this parameter was neither clearly related to the diffusion of carbon in the matrix (ferrite or austenite) nor related to an effective grain boundary coefficient[2–6]. Only Dickson et al.[7]proposed a prediction of the carbon concentration profiles using two different ap-parent diffusion coefficients, Dapp, one for the apparent diffusion of
carbon in the grains and another one for the apparent grain boundary diffusion of carbon. In most of the cases, Dappwas a fitted parameter
used to predict the maximum thickness affected by the carburization process. It is obvious that the maximum carburized thickness depends on the material (carbon diffusion coefficient in the matrix and at grain boundaries and the amount of precipitated phases (carbides)). As a consequence, Dappis strongly dependent on the nature of the steel. It
cannot be used to predict the carburized thickness of another steel with a different chemical composition and microstructure. Thus, a more accurate lifetime model is needed.
In the present study, out-of-pile carburization experiments were performed in liquid sodium at 600 and 650 °C (maximum temperatures measured in the core). Three stainless steels grades coupons were ex-posed and their extent of carburization and kinetics were followed. Moreover, the carburization kinetics in liquid sodium was simulated using DICTRA-ThermoCalc software. DICTRA is a module of the com-mercial software ThermoCalc which allows simulations of diffusion controlled transformations in multi-component systems[9]. DICTRA is commonly used to simulate carburization or nitriding kinetics[10–14]. The first published DICTRA simulations, reported by A. Engström et al.
[10], simulated the carburization behavior of Ni-Cr and Ni-Cr-Fe at 850 °C after 1000 h exposure under 10% CH4and aC= 1 and
Fe-25Cr-20Ni alloys after carburization for 200 h at 1100 °C. They compared the results with literature data[15–17]. For the first set of experiments they simulated with reasonable accuracy the evolution of M3C2, M7C3and
M23C6carbides and the carbon concentration profiles with aC= 1 as
liquid sodium was observed[18,19].
Coupons of the three steels grades (20 mm × 20 mm × 1 mm) with as-received surface finish were cleaned in ethanol and weighed prior to exposure in high temperature liquid sodium. The specimens were ex-posed under two temperatures. The first experiment was performed at 600 °C for various exposure times up to 5000 h. In the second experi-ment the specimens were exposed at 650 °C for 200 h.
Specimens of 1 mm thickness were used to evaluate the carburiza-tion kinetics. Addicarburiza-tional 150μm thick strips of the respective steel grades were simultaneously exposed under the same conditions to measure the value of the carbon concentration reached in the samples at thermodynamic equilibrium with the carbon activity in sodium. Weight gain measurements were carried out after 500 h, 1000 h, 3000 h and 5000 h after three cleaning steps in ethanol to remove all metallic sodium from the surface of the samples. The total carbon content of the specimens was measured by infrared-inductive carbon combustion. Then, cross sections were polished and etched with either di-ammo-nium persulfate (10 g (NH4)2S2O8, 100 mL water) or oxalic acid (10 g of
C2H2O4, 100 mL water, 6 volts) for metallographic examination.
The carbon concentration profiles within the depth of the samples were measured on unetched cross sections by EPMA (SX 100 CAMECA) operated at 15 kV and 20 nA using the phi-rho-z method. The analytical crystal for Kα C was LPC2. Band scan mode (2 × 50 μm2) was used to
average the carbon concentrations over several grains of the sample. Three quantitative profiles (step 4μm) were realized in each sample and showed a relative deviation of 5%. The total carbon content de-duced from the EPMA profiles was in accordance with the values ob-tained using carbon combustion analysis and in agreement with the mass gain measurements within ± 5%[20].
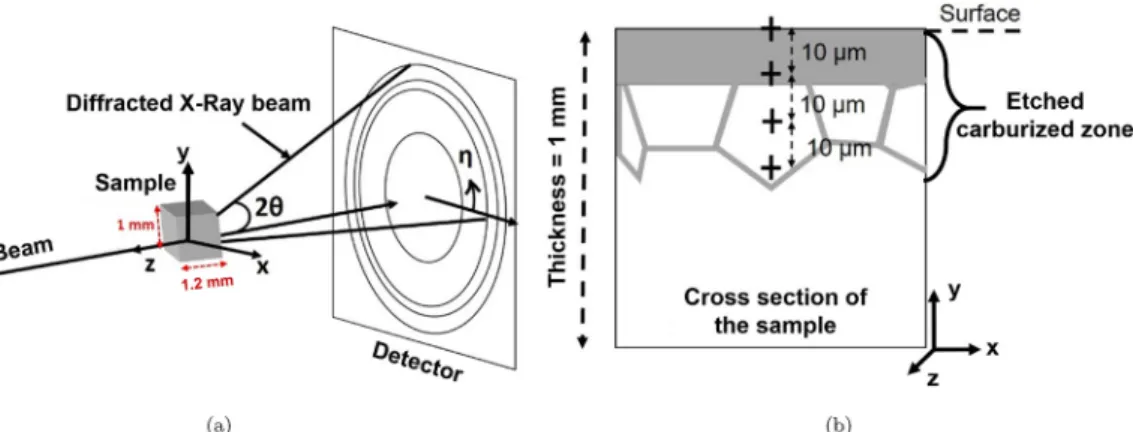
Transmission XRSD was performed on the ID11 beamline at the European Synchrotron Radiation Facility (ESRF). A single-scan ap-proach was used to evaluate the chemical and structural gradients within the cross section of the samples. The experimental set-up is re-presented inFig. 1. Similar set-up and experiments have already been used to study the phase ratio and stress gradient in ferritic thin films with a 150 nm depth resolution[21], or to measure the lattice para-meter evolution inα-titanium alloy after oxidation (beam dimensions of 300μm length and 7 μm height)[22]. The samples were illuminated at 65 keV with a beam of 5μm height in the y direction and 100 to 800 μm length in the x direction. A large length (800μm) was necessary to maximize the number of grains in the analyzed volume. Careful at-tention was given to align the beam parallel to the surface of the samples. For this purpose, the signal of a photodiode was used. Cali-bration of the distance between the sample and the detector and of the instrument resolution was performed using a standardized CeO2
powder (NIST 674b). The powder was inserted inside a capillary and glued above the middle of the sample. After integrating the data on the entire 2D diffractogram, the 1D data were analyzed using the Rietveld method within the MAUD software[23]. With this approach, the vo-lume fractions of the phases and their lattice parameters were refined using a full pattern matching approach.
Table 1
Composition of studied alloys (in wt. %) analyzed by inductively coupled plasma-optical emission spectrometry (ICP-OES) and combustion analysis for carbon.
Composition Cr Ni Mo C Ti Mn Co Si Cu Al Fe
AIM1 (wt. %) 14.35 14.05 1.40 0.09 0.36 1.40 0.02 0.73 0.12 0.015 Base 316L (wt. %) 16.55 10.52 2.05 0.03 – 1.55 0.12 0.18 0.24 0.022 Base EM10 (wt. %) 8.95 0.42 0.82 0.10 0.013 0.45 0.03 0.33 0.015 0.096 Base
Table 2
Composition of the nuclear grade sodium (industrial).
Na Ca Cl Fe K O
99.95 wt. % 2 ppm 4 ppm 1 ppm 4 ppm < 5 ppm
of this parameter will be detailed later in the manuscript). For the second set of experiments, good agreement was achieved between the simulated and experimental observations assuming the formation of M7C3 and M23C6 carbides, f2 as labyrinth factor and an adjusted
boundary condition at the gas-metal interface (aC = 0.45). Turpin et al.
[11] compared the experimental and calculated carbon profiles of Fe-13Cr-5Co-3Ni-2Mo-0.07C grades exposed at 955 °C for 23, 53 and 145 min. The predicted carbon profiles agreed well with the experi-mental carbon concentration profiles using the measured experiexperi-mental carbon concentration at the gas-metal interface and, again, a labyrinth factor equal to f2. Garcia et al. well predicted nitriding of alloy
W-Ti-Ta-Nb-Co-C at 1400 °C [13]. All the previous DICTRA simulations observed a good agreement with experimental observations at high temperatures (T > 850 °C). Few DICTRA simulations were reported for the carbur-ization of steels at lower temperatures (T < 850 °C) [12,14]. Sudha et al. attempted modelling the carburization behavior of 316L(N) steel at 525 °C after 16,000 h exposure without a clear description of their procedure [12]. Finally, Rong et al. attempted to simulate a carbur-ization process at low temperature for which the precipitation of chromium rich carbides was prevented. Although the carburization depth was in agreement with the experimental results, the predicted carbon concentration at the surface was not in accordance with the experimental value [14].
The purpose of the present study is twofold. First, the extent of carburization and kinetics of three steel grades exposed in carbon-sa-turated sodium at 600 and 650 °C are characterized. Second, the ex-perimental results are compared with simulations using the DICTRA module in order to discuss the processes which control the kinetics. In that purpose, an accurate description of the carburized samples, was crucial for the comparison with the DICTRA simulations. Electron Probe MicroAnalysis (EPMA), Transmission Electron Microscopy (TEM) and X-Ray Synchrotron Diffraction (XRSD) were used to thoroughly char-acterize the extent of carburization of the steels.
2. Materials and experimental procedure 2.1. Materials
Two austenitic steel grades, AIM1 (strain-hardened 25%) and 316L (solution-annealed), and one ferritic-martensitic steel, EM10 (strain-hardened 25%), were studied. Detailed chemical composition of the three steels is given in Table 1. The austenitic steels were constituted of relatively equiaxed grains with a grain size of 40 and 10 μm for AIM1 and 316L respectively. The microstructure of the EM10 was formed of martensite laths of 0.3–0.4 μm width.
2.2. Experimental procedure
The carburization experiments were performed in a mild steel cru-cible (iron containing 0.38 wt. % of carbon) filled with 2 liters of nu-clear grade liquid sodium previously purified from oxygen (composition reported in Table 2) with the use of Zr foils. A carbon activity higher than unity (aC > 1) was obtained in the liquid sodium by the rapid
dissolution of carbon from the crucible into the sodium. A carbon ac-tivity higher than unity can be achieved by the formation of Fe3C
considering the metastable Fe-C system. In liquid sodium, high carbon activities were measured where the formation of acetylide Na2C2 in
3. Modelling procedure in DICTRA
The carburization kinetics was simulated with the DICTRA module (database MOBFE3) implemented in the ThermoCalc software (data-base TCFE8). The Homogenization model was used for long-range dif-fusion occurring in each phase (matrix and carbides here) for which mobility data are available [24,25]. In this model, elemental con-centration profiles of all elements are calculated in one dimension. For carbon it is assumed that diffusion occurs only in a matrix which is the austenite or ferrite and that no diffusion occurs through the carbides as no mobility data in the carbides were available in MOBFE3.
In this coupled thermodynamic-kinetic approach, the flux Jk of
component k in the z direction is given as function of xkand VS, the
mole fraction and volume of substitutional elements only. The effective diffusion flux of carbonJCeffcan be written as follow
= − ∂∂
JC V1f M x µz
S
q C C C
eff tot tot
(1) where, = + ′ − ′ xktot xktot f x( k xk) (2)
•
x ′ktot, total mole fraction of k after the diffusion step;
•
xktot, total mole fraction of k before the diffusion step;•
xk′, mole fraction of k in the matrix after the diffusion step;•
xk, mole fraction of k in the matrix before the diffusion step;•
f, volume fraction of matrix.The productM xCtot totC corresponds to the average mobility and
compo-sition of carbon andμCrefers to the chemical potential of carbon. The
function fq(with f the volume fraction of the matrix and q a number), is Fig. 1. (a) Experimental set-up of the X-ray diffraction measurements at ESRF. (b) Schematic view of a sample cross section annotated with the successive mea-surements.
called the labyrinth factor and, is implemented in the software. This function is used to consider that the presence and the geometry of carbides can modify the diffusion of carbon in the matrix. In carbur-ization studies, the value of q is usually set at 2 [10–14]. In other studies, fq, with q equal to 1[26]or 2[27]was used to simulate the
effect of volume fraction binder on the sintering of carbides.
The sample geometry was discretized into a suitable number of volume cells. In the present work, the following phases considered for the calculations wereγ-FCC or α-BCC, M7C3and M23C6. As graphite and
cementite were not observed experimentally, their formation was pre-vented (dormant phases). This allowed to obtain a carbon activity greater than 1 at the surface of the steels. For durations up to 3000 h, the carbon concentrations measured by EPMA at the surface of the thick samples were used as boundary conditions at the sodium - metal in-terface (3.5, 4.0 and 2.7 wt. % for AIM1, 316L and EM10 respectively). These values were equal to their respective homogeneous carbon con-centration measured in the foils. For 5000 h exposure, boundaries va-lues equal to 3.7, 4.3 and 2.7 wt. % were used for AIM1, 316L and EM10 steels. The assumption of symmetry at the center of the samples provided the second spatial boundary condition of zero flux for all elements. The measured chemical compositions of the steels in the as-received state were used as the initial composition at time t = 0. The model provided element concentrations in the matrix (γ-FCC phase for AIM1 and 316L steels orα-BCC phase for EM10 steel), average element concentrations in all phases and phase fractions as a function of time
and distance.
4. Results and discussion 4.1. Exposure at 600 and 650 °C
For both austenitic steels, three carburized zones were observed after 500 h exposure at 600 °C (Fig. 2). The outer dark zone (called intragranular carburization zone) was composed of a dense precipita-tion of carbides in grains and at grain boundaries as shown on the TEM images inFig. 3. This dense precipitation could explain why these areas of the specimen were strongly revealed by the etching (zone entirely dark inFig. 2). The carbides were enriched in Cr and Fe and some of them were identified as M23C6carbides by diffraction TEM as shown in
Fig. 4. The presence of graphite or cementite at the surface of the steel could not be identified by TEM analyses. Underneath this first zone, the grains were partially revealed but all grain boundaries were etched (Fig. 2). Finally, this second zone was followed by grain boundaries strongly marked by etching suggesting the precipitation of carbides in grain boundaries. For the ferritic EM10 steel, one single carburized zone was observed inFig. 2(intragranular carburization zone). Similar carburized zones were observed at 650 °C (not shown here).
Micrographs and TEM observations did not provide enough in-formation about the nature and the volume fractions of carbides within the depth of the steels. For this purpose, the Rietveld refinements of the
Fig. 3. (a) BF and (b) HAADF images of carbides in grain and grain boundaries at 50μm from the surface of AIM1 steel after 1000 h exposure at 600 °C and aC> 1.
diffractograms, obtained every 10μm with transmission XRSD, were analyzed. The results are presented inFig. 5, for the three studied steels. For each diffractogram the following parameters were adjusted one at a time and always in the same order: number and type of phases (aus-tenite or ferrite, M23C6and M7C3), lattice parameters, crystallite size
and micro strain, the volume fractions of each phase and texture. The two last parameters are mainly related to the intensities of the peaks and significantly influenced the quality of the Rietveld refine-ment and thus the calculated volume fractions of carbides. The ex-perimental diffractograms did not allow to measure and simulate the
texture of the specimens. In order to correctly predict the volume fractions of phases, an arbitrary texture was used in the MAUD soft-ware. This procedure achieved a relative deviation of 5% for the vo-lume fractions of carbides for the AIM1 and EM10 steels. For the 316L steel, a significant relative deviation (around 20%) was observed for depths higher than 250μm. This effect was also observed for a few diffractograms of AIM1 and EM10 steels, where carbides could be identified but not quantified. This observation was due to the low number of peaks. The broadening of the peaks was induced by the small size of the crystallites or an increase of microstrain inside the crystal-lites. As a consequence, for the 316L steel, the volume fractions of carbides were not reported at depths higher than 250μm. For AIM1 and EM10 steels, only reliable values of the volume fraction of carbides, extracted from the diffractograms, were reported. Examples of dif-fractograms used to obtain the aformentioned results are reported in
Fig. 6for each alloy. These diffractograms were obtained at 40μm from the surface. Initial diffractograms and after 5000 h exposure at 600 °C are superimposed.
After exposure, M7C3and M23C6carbides (with M = Fe, Cr) were
identified in the first 50μm. In agreement with the TEM measurements, neither graphite nor cementite was found. According to the Rietveld refinements in Fig. 5, large volume fractions of carbides (M7C3 +
M23C6) were measured, around 50, 80 and 40% at 10μm depth for
AIM1, 316L and EM10 respectively. These values were in agreement with the high density of carbides observed on the TEM images. InFig. 5, the internal precipitation front was observed to progress with time re-sulting in the deeper precipitation of M23C6 located at the grain
boundaries of the steels revealed on the micrographs.
The precipitates nature and volume fraction slightly differed be-tween the steels. On one hand, for 316L steel, about 20% of M7C3and
50 to 60% of M23C6 were measured within the first 30μm with no
noticeable evolution between 1000 and 5000 h. On the other hand, for AIM1 steel, slightly higher volume fractions of M7C3were observed
over a larger thickness. The thickness increased with time (from 100 to 170μm between 1000 and 5000 h). Such a large difference in the vo-lume fractions of M23C6and M7C3carbides between 316L and AIM1
steel was not predicted by the ThermoCalc calculations (not shown here) as the two steels have rather similar chemical compositions. The larger volume fractions of carbides for AIM1 steel could be induced by the higher density of dislocations formed during its cold-working. These defects in addition to the presence of grain boundaries could have promoted the transformation of M23C6 into M7C3 carbides. For the
EM10 steel, much deeper precipitation of M23C6and M7C3was
mea-sured and again the thickness increased with time (from 150 to 180μm between 1000 and 5000 h). This observation can be explained by the greater permeability of carbon in ferrite (4 10−12wt. % cm2s−1) than
in austenite (5 10−14and 9 10−14wt. % cm2s−1for AIM1 and 316L
steels respectively) at 600 °C and by its finer microstructure (more grain boundaries acting as diffusion paths).
The difference in the precipitation behavior between the steels was also reflected on the carbon concentration profiles (Fig. 7). InFig. 7, the measured carbon concentrations were representative of the carbon dissolved in the matrix and the carbon trapped in carbide precipitates. The amount of carbon trapped in the precipitates (Ccarbides) was
calcu-lated using the measured carbide fractions using Eq.(3) [28], withρi
the densities of M7C3and M23C6carbides taken from literature[29,30],
fithe carbide volume fraction from the Rietveld measurements andw
Ci
the weight fraction of carbon in the carbides.
= ++
Ccarbides(wt. %)/100 fM C M Cρf wρCM C ffM C M Cρρ wCM C
M C M C M C M C
23 6 23 6 23 6 7 3 7 3 7 3
23 6 23 6 7 3 7 3 (3)
InFig. 7, considering the relative deviation of the XRSD measurements, a good agreement was observed between the carbon concentration profiles measured by EPMA and the ones calculated with the Rietveld refinement values. This observation suggested that the measured
Fig. 5. Carbide volume fractions in (a) AIM1, (b) 316L and (c) EM10 steels after 1000 and 5000 h exposure at 600 °C and aC> 1.
carbon concentrations corresponded mainly to carbon trapped in pre-cipitates. At 650 °C, the measured carbon concentrations values were close to the one obtained at 600 °C after 500 h exposure (Fig. 8), sug-gesting as well a large precipitation of carbides in the grains and at the grain boundaries of the steels. Finally, in Fig. 7, the carbon con-centration measured at the surface of the specimens was independent of time and corresponded to the homogeneous carbon concentration measured in the foils. This observation indicated that the carbon ac-tivity reached at the liquid-metal interface was, at any time, equal to the carbon activity imposed by the carburizing sodium. As mentioned previously, this value was used as a boundary condition for the DICTRA simulations described further in the article.
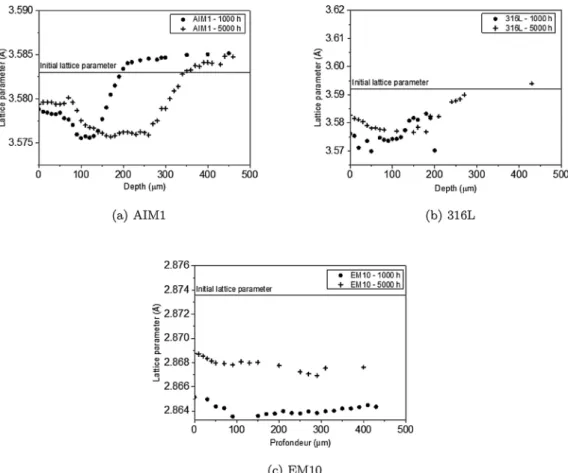
Interestingly, after carburization, the lattice parameters of austenite or ferrite (reported inFig. 9) evolved along the carbon concentration profiles (relative deviation of 0.002 Å). In the intragranular carburiza-tion zone, the lattice parameter value was lower than the lattice para-meter value measured before the experiment. Then, the value increased within the intermediate carburization zone (intra and intergranular
carburization zones) to finally reach the initial lattice parameter value deeper in the steel. The evolution of the lattice parameter is usually induced by modifications of the chemical composition and/or by chanical stresses in the metallic matrix. In this case, the effect of me-chanical stresses on the lattice parameter could be neglected because the integration from 2D to 1D of all the positions of the matrix peaks (austenitic or ferritic) were averaged along the Debye-Scherrer rings obtained on the 2D detector of the ID11 beamline. As a consequence, the decrease of the lattice parameters of austenite or ferrite was likely induced by a modification of the chemical composition. From the lit-erature, the concentration of chromium and the concentration of carbon in the matrix can impact the lattice parameter value. The lattice parameter of austenite increases with addition of chromium in auste-nite[31]and also with carbon in supersaturation in austenite[32,33]. As demonstrated previously (TEM and XRSD measurements), the carbon was mainly trapped into carbides. Thus, the carbon concentra-tion in the matrix of the studied steels were relatively low and no strong impact on the lattice parameter is expected. Thus, the evolution of the
Fig. 6. Diffractogram at 40μm from the surface of (a) AIM1, (b) 316L and (c) EM10 steels after 5000 h exposure at 600 °C and aC> 1 (▽ austenite ★ M7C3⊡ M23C6) superimposed with the diffractogram before exposure.
lattice parameter might be rather induced by an evolution of the chromium concentration in the matrix. The following scenario can be proposed. When the chromium carbides were formed, the matrix was depleted in chromium, consequently decreasing the lattice parameter. This decrease was both a function of the degree of chromium enrich-ment in the carbides and a function of the volume fraction of carbides. InFig. 9, for AIM1 steel, two “plateau” values were observed. They corresponded to the presence of M7C3and M23C6in the zone closer to
the surface and then to the presence of M23C6 underneath. A higher
lattice parameter value was observed in the first zone, near the surface,
in good agreement with a higher iron enrichment of carbides (lower chromium depletion) where the carbon activity/concentration is higher (seeFig. 10). Deeper in the steel, the volume fraction of M7C3started to
decrease while the volume fraction of M23C6increased. This resulted in
a higher chromium depletion in the substrate, since the M23C6carbides
were richer in metallic elements than M7C3(the total carbide volume
fraction was roughly the same). This can explain the observed larger decrease of the lattice parameter (2nd “plateau”). Finally, at the end of the intragranular carburization zone, the carbide volume fraction de-creased. The extent of chromium depletion decreased and the lattice parameter increased again to reach a value close to the initial lattice parameter value. For 316L steel, the two “plateau” were less pro-nounced due the lower volume fraction of M7C3. For EM10, the lattice
parameter was lower than the initial value through the whole sample thickness as the sample was carburized entirely.
4.2. Thermodynamic and kinetic modeling of carbon diffusion
After thoroughly investigating the extent of carburization in the three steels, numerical simulations were performed to discuss the me-chanisms which control the nature and kinetics of carburization. 4.2.1. Influence of grain boundary diffusion and carbides geometry on the carburization kinetics
In the simulations, both carbides M23C6and M7C3were considered
to be stable. As graphite and cementite were not observed experimen-tally, their formation was prevented (dormant phases). A comparison of the temporal evolution of the carbon concentration profiles is presented inFig. 11for the three steels after 500 and 3000 h exposure at 600 °C. For the austenitic steels inFig. 11a and b, the experimental carbon profile could not be simulated entirely. As a consequence, the carbon
Fig. 7. EPMA carbon concentration profiles of (a) AIM1, (b) 316L and (c) EM10 measured after 1000 and 5000 h exposure at 600 °C and aC> 1 and calculated carbon concentration profiles from the volume fractions of the carbides measured by XRD.
Fig. 8. EPMA carbon concentration profiles (symbols) and DICTRA simulations (lines) and respective labyrinth factors fqfor AIM1, 316L and EM10 after 200 h exposure at 650 °C and aC> 1.
concentration profile was divided in two parts: the intragranular and intergranular carburization zones. In the intragranular carburization zone, a good agreement between the predicted and the measured carbon profile was obtained. Nevertheless, this agreement strongly depended on the chosen q value for the labyrinth factor, fq. InFig. 11a
and b, it was not possible to simulate the carbon concentration profiles that corresponded to the intragranular zone with the commonly used labyrinth factor (neither f1or f2as in the literature[10–14,27,26]nor
without one (f0= 1)). The most accurate simulations were achieved
with labyrinth factors equal to f4after 500 h and f5after 3000 h
ex-posure. For the ferritic steel EM10 (Fig. 11c), the values were lower and equal to f2 after 500 h and between f2 and f3 after 3000 h. All the
exponents of the labyrinth factor values were greater than the ones used in the literature (f1 or f2[10–14,27,26]). Furthermore, for the three
steels, the q value increased with the exposure time. This observation suggested a progressive decrease of the diffusion rate of carbon which can be linked to the decrease of the matrix volume fraction (increase of the carbide volume fractions) and to the evolution of the carbide geo-metry. An evolution of the morphology of the carbides into a more complex and blocking geometry, such as platelets perpendicular to the inwards flux of carbon, could explain a decrease in the carbon diffusion in the alloy. This evolution could not be clearly observed on the etched cross-sections.
At 650 °C, the simulations are superimposed to the carbon con-centration profiles inFig. 8after 200 h exposure. Again, the labyrinth factors were adjusted in order to fit correctly the intragranular car-burization zone. For the austenitic steels, a factor equal to f4was used
whereas no labyrinth factor was necessary for the ferritic steel EM10 (f0).
Finally, the experimental intergranular carburization zone could not be simulated with the DICTRA model. The disagreement between the experimental and simulated carbon concentration profiles in this zone was clearly visible for the two austenitic steels inFigs. 8 and 11. For these steels, the transition from the intragranular to the intergranular carburization zone was marked by the presence of a carbon diffusion tail deep in the substrate. For the ferritic steel EM10, the effect of grain boundary diffusion was marked after 500 h and no longer visible after 3000 h, where only one “mixed” carburized zone was observed ex-perimentally. As a consequence, the whole carbon concentration profile observed after 3000 h could be simulated with the model with an ad-justed labyrinth factor value. The absence of simulated carbon con-centration profile in the intergranular zone was of course expected since the diffusion at grain boundaries was not considered in the model used
Fig. 9. Evolution of the crystal parameter of (a) AIM1, (b) 316L and (c) EM10 steel as a function of time and depth after 1000 and 5000 h exposure at 600 °C and aC> 1.
Fig. 10. Evolution of the composition of carbides as function of the total carbon concentration in the steel. Calculated with ThermoCalc at 600 °C with TCFE8 database and AIM1 steel composition.
Fig. 11. EPMA carbon concentration profiles (symbols) and DICTRA simulations (lines) with different labyrinth factors fqfor (a) AIM1, (b) 316L and (c) EM10 steels after 500 and 3000 h exposure at 600 °C and aC> 1.
Fig. 12. Experimental and simulated volume fraction of carbides measured in (a) AIM1 and (b) EM10 steels after 5000 h exposure at 600 °C and aC> 1. Fig. 13. (a) Experimental and simulated volume fraction of car-bides measured in 316L steel after 5000 h exposure at 600 °C and aC> 1 considering the precipitation of M23C6and M7C3. (b) Experimental and simulated volume fraction of carbides measured in 316L steel after 5000 h exposure at 600 °C and aC> 1 con-sidering the precipitation of M23C6only f2as labyrinth factor.
in this study. The model used underestimated of the carburization depths reached in the steels. The predicted carburization depths were about 2 times lower than the one measured experimentally for the austenitic steels and 1.5 times lower for the ferritic steel after 500 h exposure.
4.2.2. Non-equilibrium carburization state
In order to understand why higher values of q were needed for fqin
our study, compared to the ones usually used in published simulation of carburization kinetics, the experimental and simulated volume frac-tions of carbides formed in the steels grades were compared. The results are plotted inFigs. 12 and 13a. Two distinct zones were observed on the simulated profiles whereas three different zones were identified on the experimental results. The results are summarized inTable 3.
The last zone in the experimental carbon profile corresponded to the intergranular carburization. As mentionned previously, this zone could not be predicted by the model. Regarding the intragranular carburiza-tion zone (zone 1 and 2 inTable 3), the amounts and type of carbides predicted by the DICTRA simulations were different than the one measured experimentally. For the austenitic steels (AIM1 inFig. 12and 316L inFig. 13a), the simulations predicted a large amount of M7C3and
a small amount of M23C6 within the first 200μm. These predictions
differed strongly with the experimental results. Indeed, a large volume fraction of M23C6carbides and a smaller volume fraction of M7C3was
observed. For EM10 steel, both M7C3and M23C6carbides were formed
over 200μm whereas DICTRA only predicted the precipitation of M7C3
in the whole thickness of the EM10 steel. Both comparisons indicated that thermodynamic equilibrium of precipitation was not reached in the steels. At 600 °C, the conversion of M23C6into M7C3might have been
not fast enough to reach thermodynamic equilibrium. As a con-sequence, the volume fraction of M23C6and M7C3carbides could not be
precisely predicted with DICTRA. In this model the reactions of for-mation of carbides are assumed to be fast enough to be at thermo-dynamic equilibrium. With the aim of predicting correctly the nature and amount of carbides precipitated in the steels, new simulations were performed for the carburization of 316L steel. Only the precipitation of M23C6carbides was considered since their volume fraction was larger
than the volume fraction of M7C3 (the formation of M7C3 was
pre-vented, dormant phase). This assumption was relevant for the 316L steel for which a very low amount of M7C3was observed
experimen-tally.
InFig. 13b, a good agreement between the simulated and experi-mental carbide fractions was observed, except within the first 10μm where a non-negligible volume fraction of M7C3carbides was observed
experimentally. It is important to mention that, for the DICTRA simu-lations shown in Fig. 13b, a new labyrinth factor equal to f2(which
differs from the previously used f4considering both carbides M 7C3and
M23C6) was needed in order to fit correctly the EPMA carbon
con-centration profiles. This new labyrinth factor value is now similar to values of the common labyrinth factors used in the literature
[10–14,27,26]. 4.3. Conclusions
The extent of carburization of three different steels exposed in liquid sodium at 600 and 650 °C up to 5000 h was thoroughly characterized.
Precipitation of M23C6and M7C3was identified with the use of
trans-mission XRSD and TEM in the grains and at grain boundaries of the steels. The larger amount of M7C3observed in the AIM1 steel
(strain-hardened) than in the 316L steel (annealed) was associated with a higher density of dislocations. These defects, in addition to the presence of grain boundaries, could have allowed a faster conversion of M23C6
into M7C3carbides. The deeper precipitation of carbides observed in the
EM10 steel was induced by its fine microstructure and the higher so-lubility product compared to the austenite.
At 600 and 650 °C, several attempts were made to simulate the entire experimental carburization profiles obtained via EPMA mea-surements in the thickness of the three different steels with DICTRA. Firstly, the simulated carbon profiles strongly underestimated the maximum carburization depths. Half of the carbon concentration pro-files measured was induced by the carbon diffusion and precipitation at grain boundaries. This process could not be considered and simulated with the chosen model. New simulations should be performed with the grain boundary model in DICTRA in order to improve the accuracy of the simulations. Secondly, the carbon concentration profiles in the in-tragranular zone could be predicted correctly but needed a careful adjustment of two input parameters: the labyrinth factor fqand the
chosen carbide phases. At these intermediate temperatures, it is clear that local thermodynamic equilibrium, such as predicted by DICTRA, was not reached in the steels. As a consequence, the nature and evo-lution of the amount of the precipitated carbides could not be predicted with accuracy. In the simulations, for the 316L steel, the declared phases were chosen in accordance with the experimental observations. This indicated that the rate of precipitation of carbides must be con-sidered for correct simulations which is, currently, not possible with the DICTRA model.
Unfortunately, even if a more accurate description of the phases could be used for one specimen, the value of fqcould not be determined
experimentally. As a consequence, the value was adjusted to the ex-perimental profiles. As indicated in the literature[10–14], the role of the labyrinth factor is to decrease the carbon flux in the matrix when the precipitate volume fraction increases. At 600 and 650 °C, the blocking effect of the carbides could not be neglected and was observed to evolve with time. Thus, the description of the labyrinth factor in the model should be improved. For example, by considering the evolution of the morphology of carbides with time.
Acknowledgements
The authors are grateful to the ID11 beamline team: Pavel Sedmak and Jonathan Wright (ESRF Grenoble, France) for their assistance in carrying out the XRSD experiments. Prof. Daniel Chateigner (CRISMAT, Caen, France) is gratefully acknowledged for his help with the MAUD software and Rietveld analyses. Authors are also thankful to Rishi Pillai (ORNL, United States) for his advice with the DICTRA simulations. References
[1] J.P. Hugot, Prolongation de la durée de vie des EA de la filière N.R. Bilan des examens réalisés sur les gaines en 316Ti hypertrempé et 1515Ti écroui., Note Technique CEA: DECM/SRMA 99-2330 ind. 0, DR. (1999).
[2] W. Anderson, G. Sneesby, Carburization of austenitic stainless steel in liquid so-dium, Atomic International Report NAASR – 5289, (1960).
Zones XRD experimental results Simulations
Zone 1 Presence of M7C3and M23C6with almost constant volume fractions Presence of M7C3of decreasing volume fraction and M23C6of increasing volume fraction
(for AIM1 and 316L only) Zone 2 Presence of M7C3of decreasing volume fraction and M23C6of increasing
volume fraction
Rapid decrease of the volume fraction of M23C6
Zone 3 Slow decrease of the volume fraction of M23C6 Not predicted
Table 3
[3] J.R. Gwyther, M.R. Hobdell, A.J. Hooper, Carburization of austenitic and ferritic alloys in carbon-saturated sodium at 916 K, Metals Technol. 1 (1) (1974) 406–411,
https://doi.org/10.1179/030716974803288220.
[4] H. Aubert, M. Champigny, D. Gauvain, L. Meny, M. Pigoury, Carburation d’acier 316 par transfert de carbone dans le sodium, Note Technique CEA: SRMA/GMAR 78-812, (1978).
[5] A. Thorley, M. Hobdell, Carbon in Sodium – A Review of Work in the UK, CEGB, Berkeley Nuclear Laboratories, 1984.
[6] L. Brunel, Proposition d’une loi enveloppe de carburation des gaines d’éléments absorbants, Note Technique CEA: SDC 84-2014 ind. 0, (1984).
[7] J. Dickson, A. Raine, Carburisation of Stainless Steel Immersed in Carbon-Contaminated Sodium: A New Technique for Estimating the Diffusion Coefficients vol. 2, Liquid Metal Engineering and Technology, 1988.
[8] J. Crank, Mathematics of Diffusion, Oxford University Press, 1957.
[9] A. Borgenstam, L. Höglund, J. Ågren, A. Engström, Dictra, a tool for simulation of diffusional transformations in alloys, J. Phase Equilibria 21 (3) (2000) 269,https:// doi.org/10.1361/105497100770340057.
[10] A. Engström, L. Höglund, J. Ågren, Computer simulation of diffusion in multiphase systems, Metall. Mater. Trans. A 25 (6) (1994) 1127–1134,https://doi.org/10. 1007/BF02652288.
[11] T. Turpin, J. Dulcy, M. Gantois, Carbon diffusion and phase transformations during gas carburizing of high-alloyed stainless steels: Experimental study and theoretical modeling, Metall. Mater. Trans. A 36 (10) (2005) 2751–2760,https://doi.org/10. 1007/s11661-005-0271-4.
[12] C. Sudha, N.S. Bharasi, R. Anand, H. Shaikh, R. Dayal, M. Vijayalakshmi, Carburization behavior of aisi 316ln austenitic stainless steel – experimental studies and modeling, J. Nucl. Mater. 402 (2) (2010) 186–195,https://doi.org/10.1016/j. jnucmat.2010.05.023 http://www.sciencedirect.com/science/article/pii/ S0022311510002357.
[13] J. Garcia, O. Prat, Experimental investigations and dictra simulations on formation of diffusion-controlled fcc-rich surface layers on cemented carbides, Appl. Surf. Sci. 257 (21) (2011) 8894–8900,https://doi.org/10.1016/j.apsusc.2011.05.024 http:// www.sciencedirect.com/science/article/pii/S0169433211007148.
[14] D. Rong, J. Gong, Y. Jiang, Thermodynamic simulation of low temperature colossal carburization of austenitic stainless steel, Proc. Eng. 130 (2015) 676–684,https:// doi.org/10.1016/j.proeng.2015.12.296pressure Vessel Technology: Preparing for the Future,http://www.sciencedirect.com/science/article/pii/
S1877705815041806.
[15] K. Bongartz, R. Schulten, W.J. Quadakkers, H. Nickel, A finite difference model describing carburization in high-temperature alloys, CORROSION 42 (7) (1986) 390–397,https://doi.org/10.5006/1.3584919.
[16] K. Bongartz, W.J. Quadakkers, R. Schulten, H. Nickel, A mathematical model de-scribing carburization in multielement alloy systems, Metall. Trans. A 20 (6) (1989) 1021–1028,https://doi.org/10.1007/BF02650138.
[17] H.J. Grabke, U. Gravenhorst, W. Steinkusch, Aufkohlung von chrom-nickel-eisen-stählen in der kohlenstoffpackung, Mater. Corros. 27 (5) (1976) 291–296,https:// doi.org/10.1002/maco.19760270502.
[18] G.K. Johnson, E.H.V. Deventer, J.P. Ackerman, W.N. Hubbard, D.W. Osborne, H.E. Flotow, Enthalpy of formation of disodium acetylide and of monosodium acetylide at 298.15 k, heat capacity of disodium acetylide from 5 to 350 k, and some derived thermodynamic properties, J. Chem. Thermodyn. 5 (1) (1973) 57–71,
https://doi.org/10.1016/S0021-9614(73)80063-1 http://www.sciencedirect.com/ science/article/pii/S0021961473800631.
[19] R. Ainsley, L.P. Hartlib, P. Holroyd, G. Long, The solubility of carbon in sodium, J. Nucl. Mater. 52 (2) (1974) 255–276,https://doi.org/10.1016/0022-3115(74)
90172-X http://www.sciencedirect.com/science/article/pii/002231157490172X. [20] M. Romedenne, F. Rouillard, B. Duprey, D. Hamon, M. Tabarant, D. Monceau,
Carburization of austenitic and ferritic steels in carbon-saturated sodium: pre-liminary results on the diffusion coefficient of carbon at 873 k, Oxid. Metals 87 (5) (2017) 643–653,https://doi.org/10.1007/s11085-017-9733-5.
[21] N. Vaxelaire, P. Gergaud, G.B.M. Vaughan, Sub-micrometre depth-gradient mea-surements of phase, strain and texture in polycrystalline thin films: a nano-pencil beam diffraction approach, J. Appl. Crystallogr. 47 (2) (2014) 495–504,https:// doi.org/10.1107/S1600576714000557.
[22] J. Baillieux, D. Poquillon, B. Malard, Observation using synchrotron x-ray diffrac-tion of the crystallographic evoludiffrac-tion of alpha-titanium after oxygen diffusion, Philos. Mag. Lett. 95 (5) (2015) 245–252,https://doi.org/10.1080/09500839. 2015.1014876.
[23] L. Lutterotti, R. Vasin, H. Wenk, Rietveld texture analysis from synchrotron dif-fraction images. I. Calibration and basic analysis, Powder Diffr. 29 (1) (2014) 76–84,https://doi.org/10.1017/S0885715613001346.
[24] H. Larsson, A. Engström, A homogenization approach to diffusion simulations ap-plied toα + γ Fe-Cr-Ni diffusion couples, Acta Mater. 54 (9) (2006) 2431–2439,
https://doi.org/10.1016/j.actamat.2006.01.020 http://www.sciencedirect.com/ science/article/pii/S1359645406000954.
[25] H. Larsson, L. Höglund, Multiphase diffusion simulations in 1D using the dictra homogenization model, Calphad 33 (3) (2009) 495–501,https://doi.org/10.1016/ j.calphad.2009.06.004 http://www.sciencedirect.com/science/article/pii/ S0364591609000522.
[26] R. Frykholm, M. Ekroth, B. Jansson, J. Ågren, H.-O. Andrén, A new labyrinth factor for modelling the effect of binder volume fraction on gradient sintering of cemented carbides, Acta Mater. 51 (4) (2003) 1115–1121, https://doi.org/10.1016/S1359-6454(02)00515-3 http://www.sciencedirect.com/science/article/pii/
S1359645402005153.
[27] M. Ekroth, R. Frykholm, M. Lindholm, H.-O. Andrén, J. Ågren, Gradient zones in wc-ti(c,n)-co-based cemented carbides: experimental study and computer simula-tions, Acta Mater. 48 (9) (2000) 2177–2185, https://doi.org/10.1016/S1359-6454(00)00029-X http://www.sciencedirect.com/science/article/pii/ S135964540000029X.
[28] R. Pillai, A. Chyrkin, D. Grüner, W. Nowak, N. Zheng, A. Kliewe, W. Quadakkers, Carbides in an aluminised single crystal superalloy: tracing the source of carbon, Surf. Coat. Technol. 288 (2016) 15–24,https://doi.org/10.1016/j.surfcoat.2015. 12.066 http://www.sciencedirect.com/science/article/pii/S0257897215304965. [29] W.M. Haynes, CRC Handbook of Chemistry and Physics, 95th ed., Taylor and
Francis, Boca Raton, FL, 2014 an imprint of CR, Press, description based upon print version of record.https://www.lib.uts.edu.au/goto?url=http://UTS.eblib.com.au/ patron/FullRecord.aspx?p=1591582.
[30] W.B. Pearson, Interstitial Alloys, H.J. Goldschmidt, Plenum, New York; Butterworths, London, 1968,https://doi.org/10.1126/science.162.3850.251-a
SciencearXiv:http://science.sciencemag.org/content/162/3850/251.2.full.pdf. [31]D. Dyson, B. Holmes, Effect of alloying addition on the lattice parameter of
auste-nite, J. Iron Steel Inst. 208 (1970) 469–474.
[32] Y. Sun, X. Li, T. Bell, Structural characteristics of low temperature plasma car-burised austenitic stainless steel, Mater. Sci. Technol. 15 (10) (1999) 1171–1178,
https://doi.org/10.1179/026708399101505077.
[33] Y. Cao, F. Ernst, G. Michal, Colossal carbon supersaturation in austenitic stainless steels carburized at low temperature, Acta Mater. 51 (14) (2003) 4171–4181,
https://doi.org/10.1016/S1359-6454(03)00235-0 http://www.sciencedirect.com/ science/article/pii/S1359645403002350.