Electronic copy available at: http://ssrn.com/abstract=1665093
The Short-Term Timing of Initial Public Offerings
*Romain Bouis, University of Paris-Dauphine
July 2009
Forthcoming in Journal of Corporate Finance
Abstract
This paper examines the effect of stock market conditions on the waiting time of initial public offering (IPO) candidates, from the date firms file a registration statement with the Securities and Exchange Commission (SEC) to the effective IPO date. I find that issuers are going public faster when time-varying stock market valuations are high, and when time-varying market returns and time-varying market volatility are low. The volatility effect is not driven by regulatory delays consecutive to changes in the terms of the offers during the IPO process. Taken together, these results indicate that firms use a short-term market timing strategy when deciding the right time to go public and are consistent with a real option interpretation of IPO timing.
JEL classification: G14; G24; G32.
Keywords: IPO timing; Registration period; Real option; Hazard analysis.
*
I would like to thank the editor, Jeffrey Netter, two anonymous referees, as well as François Derrien, Edith Ginglinger and Ulrich Hege for helpful comments and suggestions. The usual disclaimer applies.
Electronic copy available at: http://ssrn.com/abstract=1665093 2
1. Introduction
In the financial turmoil of 2008, only 21 operating companies went public in the U.S., the lowest volume recorded since 1978, well below the 675 offers of the 1996 hot issue period or the 859 firms taken public in the years 1999 and 2000 (source: Ritter (2009)). These figures illustrate the well-known finding in finance that firms conduct their initial public offering (IPO) when stock market valuations are high, leading some researchers to conclude that entrepreneurs can successfully time the market when issuing shares.1 On theoretical grounds, the issue of IPO timing is modelled in several recent papers that view the decision to go public as exercising a real option. Draho (2000) and Benninga et al. (2005) study the optimal IPO timing of a firm that must weight private benefits with higher public valuations offered by diversified investors. Pastor and Veronesi (2005) develop a model where firms time their IPO to maximize the value of a patent. Finally, Busaba (2006) studies the option to withdraw the offering during the registration period, and argues that a firm attempting an IPO can be viewed as holding a risky asset whose value equals the uncertain offer price, plus a put option on this asset with an exercise price equal to the firm’s reservation value. Because of the option-like feature of the going public decision, the optimal timing of the offer is expected to depend not only on valuation levels but also on uncertainty surrounding market valuations. Draho (2000) conjectures for example that firms should be waiting longer before going public when market valuations are more volatile.
Consistent with this prediction, the large number of postponed or withdrawn IPOs during 2008
1
For example, Lerner (1994) analyzes the going public decision of a sample of biotechnology venture capital (VC)-backed firms and reports a return in the biotechnology index of about 10% in the sixty days preceding the offers and of -5% in the sixty days after. Loughran et al. (1994) and Rajan and Servaes (2004) document that firms are taken public during market peaks or after an increase in stock market valuations, while Pagano et al. (1998) find from a sample of Italian firms that high market-to-book ratios of similar firms constitute the most important determinant of the decision to go public.
3
(in progression of 60% compared with 2007) was not only the consequence of poor public valuations but also of high market volatility.2
This paper complements prior research on how market conditions impact the timing of initial public offerings by studying the determinants of the waiting time of issuers from the date firms file a registration statement with the Securities and Exchange Commission (SEC) to their effective IPO date. On average, the registration period lasts about 85 days but varies substantially among issuers. Yet, little research has been done to explain this cross-sectional variation and in particular to investigate the impact of general market conditions on the waiting time of IPO candidates. If the going public decision can be viewed as exercising an option with market valuations evolving stochastically, the usual comparative static results from real option theory should apply concerning the effect of general market conditions on the duration of IPO
registrations. More precisely, this paper tests three key predictions: firms that file with the SEC should go public faster when market valuations are high, when stock market volatility is low, and less likely to exercise their going-public option when they expect a future rise in stock prices.
Boehmer and Ljungqvist (2004) have already analyzed the determinants of the waiting time of a sample of issuers on the German IPO market from the date the firms announce their intention to go public to their effective IPO date.3 While these authors study IPO timing in a long-term perspective (the average waiting time of their sample firm is more than two years), I argue in this paper that IPO timing can also be analyzed in a short-term framework, that is from the filing date to the effective IPO date. Even if the firm has already filed a preliminary
2
“With equity markets still displaying heightened volatility (…) companies have decided to put any plans to go public on ice” (‘Big names wait in wings for end of IPO drought’, Financial Times, January 8, 2009).
3
There exists in Germany a financial newspaper, the Börsen-Zeitung, which publishes since June 1984 a list of firms announcing their intention to go public in a near future. This systematic record of IPO announcements allows Boehmer and Ljungqvist (2004) to follow each firm over time until the date of their offer. This kind of information does not exist in other countries. In the U.S. for example, the only information available is the date at which firms register their offer with the SEC.
4
prospectus with the SEC, it still enjoys sufficient flexibility to decide when to go public while market valuations can be sufficiently volatile in the short-run to create a value of waiting during the registration period. The description of the final stage of several offers reported in the financial press generally lends support to this conjecture. For example, in the case of Mead Johnson’s IPO on February 2009, the banks set the date of the offer on a day-to-day basis according to the short-term market sentiment: “On Tuesday, the market was down 300 points. On Thursday it was down 200 points. On Wednesday, however, Morgan Stanley and Citigroup managed to rush an initial public offering into the market on the only day this week that the market was up” (‘On Wall Street, a Good IPO is a Fast IPO’, The Wall Street Journal, February 12, 2009). Likewise, for the IPO of Rosetta Stone, a language-software company that went public on April 2009, the banks delayed the offer by a few days to coincide with low market volatility. “When it came time to actually time the exact day of the offering, the bankers watched the Chicago Board Options Exchange Volatility Index, or VIX, which measures the implied volatility of options on the S&P 500. When volatility hit a relative low, the bankers rushed the offering through” (‘Rosetta Stone: How to Sell an IPO in Difficult Markets’, The Wall Street Journal, April 20, 2009).
I use a sample of 5,639 U.S. firms that filed with the SEC from 1986 to 2007 and that subsequently went public or withdrew their offer. I follow each firm over time from their filing date to their IPO or withdrawal date. The effect of market conditions on the duration of the
registration periods is studied by employing survival analysis, and by allowing the values of stock market variables to change as the registration time of offers progresses. Because the duration of IPO registrations depends on institutional and marketing delays that are independent of the timing policy of the firms (the revisions of the preliminary prospectus in response to the SEC comments may take more or less time depending on the characteristics of the issuer), my regressions also
5
include variables controlling for the risk of the offers and the reputation of the financial
intermediaries involved in the issue and which are likely to extend the IPO process for regulatory or marketing reasons. Although I find mixed evidence that stock market conditions affect the timing of NYSE and AMEX offers, econometric estimates clearly show that firms in registration for an IPO on the Nasdaq (representing 83% of my sample) choose the right time to go public on the basis of stock market valuation levels, stock market returns and stock market volatility. As predicted, the instantaneous probability that the firms go public on the Nasdaq over the next week (the IPO hazard rate) increases with the time-varying level of the Nasdaq Composite index, decreases with the time-varying Nasdaq Composite return and with the time-varying volatility of the Nasdaq Composite returns. The negative effect of the time-varying market return on the IPO hazard is in line with the idea that exercising the timing option in periods when the market is rising fast is not optimal as issuers can expect a higher valuation by waiting. The negative relation between the IPO hazard and the volatility of stock market returns is consistent with the presence of a value of waiting due to uncertainty about general market conditions during the registration period and holds true even when excluding firms that filed in periods of exceptional volatility such as the stock market crash of 1987 or the 1998-2003 period. Importantly, market volatility increases the duration of IPO registrations both in bearish markets and in bullish markets. As regards issuer and offer-specific variables, I find that firms taken public by
prestigious underwriters and those which are VC-backed are going public faster than other IPO candidates, probably because experienced intermediaries – more familiar with the SEC duties – avoid the issuer losing time in administrative corrections and also increase investor interest for the offer, speeding up the IPO process.
6
documents with the SEC and sometimes recirculate the prospectus to potential investors, a practice that may delay the completion of the offer. Since issuers are a priori more likely to change the terms of the issue in a volatile market, the need to refile with the SEC and the
recirculation of the prospectus could explain why the duration of registration periods is positively related to market volatility. I provide evidence that this is not the case: even Nasdaq firms that do not refile for a change in their offer size are waiting longer before going public when the market is more volatile. This means that the positive relation between registration durations and market volatility is not driven by regulatory delays consecutive to revisions in the issue size. Overall, my results indicate that firms are voluntarily waiting longer before going public when market
conditions get more volatile because of the presence of a value of waiting due to uncertainty. The remainder of the paper is organized as follows. Section 2 highlights the option feature of the going public decision during the registration period and presents testable predictions. Section 3 discusses the timing leeway of the issuer within the institutional constraints of the IPO process in the U.S. Section 4 presents the data, the construction of the variables used in the analysis, and the econometric methodology. Section 5 contains the empirical results. Section 6 concludes the paper.
2. Option feature of the going public decision and empirical predictions
A small but growing literature studies the optimal timing of initial public offerings in a real option framework. Draho (2000) for example proposes a model with well-diversified public investors discounting future cash flows of the firm at a lower risk-adjusted rate than the
entrepreneur’s discount rate. As long as the firm is private, the entrepreneur receives the cash flows of the company and holds the option of selling his shares through an IPO to public
7
evolving stochastically, the firm is taken public only when the market valuation is sufficiently larger than the entrepreneur’s one to cover the cost of exercising the timing option. Draho predicts that firms should be waiting longer before going public when stock market volatility is larger and be more likely to exercise their going-public option after a positive shock on public valuations, explaining why IPOs cluster around market peaks.
In a similar vein, Benninga et al. (2005) study the going public decision of an
entrepreneur who arbitrates between private benefits of control when the firm is private and the higher price of the shares that more diversified public investors are willing to pay. The decision to go public or stay private is reversible at any point in time. Firms are expected to issue shares when their cash flows, and so their market valuations, are relatively high, that is when the absolute difference between public and private valuations outweighs the private benefits of control.
Pastor and Veronesi (2005) develop a model where firms own a patent that generates abnormal profits upon production. Going public enables the firms to raise the necessary funds to begin the exploitation of the patent. Delaying the IPO is costly because of foregone abnormal profits but waiting may be optimal if investment opportunities are expected to improve in the future. Firms then time their IPO to maximize the value of the patent, exercising their option only when there is a favourable change in market conditions.
These three papers focus on IPO timing in the long-run and do not consider the going public decision once the firm has filed with the SEC. For example, both Draho (2000) and Pastor and Veronesi (2005) limit their analysis to the optimal date chosen by the firm to file with the SEC and assume that the time elapsed from the filing date to the effective IPO date (the
8
the registration period can also be treated as a real option problem. Even if the firm has filed a registration statement with the SEC, it still enjoys flexibility concerning the choice of the IPO date as it can delay its offer, or even withdraw it, in case of weak investor interest. Besides, the firm still faces uncertainty as regards the outcome of the operation. The registration period lasts on average three months and market conditions can change considerably during this time. Finally, an issuer must incur several costs like filing fees, legal expenses, printing fees, and the
underwriting fee (on average equal to 7% of the proceeds of the issue), making the IPO choice an irreversible decision.4 Using the information revelation framework of Benveniste and Spindt (1989), Busaba (2006) develops a model of bookbuilding which includes the possibility for the firm to withdraw its offering in case of weak investor interest. Soliciting the services of the underwriter to conduct the bookbuilding amounts to getting an option to go public with a price revealed during the pre-market period. A firm attempting an IPO can therefore be viewed as holding a risky asset whose value equals the uncertain offer price, plus a put option on this asset with an exercise price equal to the firm’s reservation price. If the price investors are willing to pay is higher than the firm’s reservation price, the firm exercises its IPO option, otherwise it withdraws the offer. High uncertainty about the valuation of the firm, and consequently about the proceeds of the issue, raises the value of the withdrawal option to potential issuers. Busaba then predicts that firms can time their IPO to coincide with increased market volatility. However, he does not make any predictions as regards the duration of the waiting time of issuers before going public. The reason is that in Busaba (2006)’s model, the going public process is essentially a one shot game: the firm solicits indications of interest from investors, goes public if investors are willing to pay a higher price than its own reservation price, or walks away.
4
Of course, public firms can always become private again (see e.g. Benninga et al., 2005) but the aforementioned expenses are nevertheless lost forever.
9
Besides uncertainty surrounding the definitive offer price, issuers and investment banks are also concerned about uncertainty with respect to the aftermarket performance of the issue. At the date the firm is taken public, both parties run the risk that the IPO performs poorly on the secondary market if general market conditions deteriorate right after the issue. Because the completion of the offer can be delayed, the issuer and its investment bank have the opportunity to wait for new information to arrive about general market conditions before taking the firm public. Therefore, the IPO candidate not only holds a withdrawal option of the offer as in Busaba (2006) but also an option of waiting for the arrival of new information about stock market conditions.
In this setting, one should expect the issuer and the bank to be more likely to exercise the going-public option when the valuation obtained on the primary market is sufficiently high, given the level of uncertainty surrounding stock market conditions. Based on standard predictions of real options theory, I formulate the three following conjectures concerning the impact of general market conditions on the duration of IPO registrations (for an exposition of the basic model of real options and of the characteristics of the optimal investment rule see e.g. Dixit and Pindyck (1994, Chapter 5)). First, issuers should be less likely to exercise their timing option when general market conditions are highly volatile since the value of waiting for new information about market valuations increases with the degree of uncertainty surrounding these valuations. Second, firms are expected to go public faster when public valuations are higher because ceteris
paribus, the critical value that triggers the exercise of the going-public option is more likely to be reached. Third, firms should be waiting longer when market valuations are rising faster. As outlined by Dixit and Pindyck (1994, Chapter 5), “...both growth (...) and uncertainty (...) can
create a value of waiting and thereby affect investment timing.” The reason is that when the market is rising faster, firms can expect a higher valuation by postponing the completion of the
10 offer.
In what follows, I discuss the timing leeway of the issuer within the institutional
constraints of the IPO process. Then, I describe the sample, the variables used in the analysis and the methodology employed in testing the above predictions.
3. The timing leeway of the issuer within the institutional constraints of the
IPO process
The duration of the registration period depends notably on institutional constraints that are independent of the timing policy of the issuer. To illustrate how the issuer can time its offer within these constraints, Figure 1 represents a time line of the IPO process with the main stages involving the firm and the SEC (a detailed description of the IPO process in the U.S. can be found in Eckbo et al. (2007) and in Ellis et al. (1999)) along with some descriptive statistics on the duration of these stages.5
— Please insert Figure 1 about here —
The first stage consists in an inspection by the SEC of the registration statement (in general a Form S-1, and more rarely, for small business issuers, a Form SB-2) to ensure that the document contains complete and reliable information concerning the securities offered to the public. At the end of this review (that lasts on average 28 days), the issuer receives a first “letter of comment” from the SEC asking revisions of the registration statement.
The company then files amended filings S1-A, known as pre-effective amendments (stage 2) to incorporate the SEC comments (the comment letter process consists in fact in several iterations of letters from the SEC and responses from the firm) as well as to change the price
5
Since the end of 2004, the correspondence between the SEC and the issuer is publicly available on the SEC’s Electronic Data Gathering, Analysis, and Retrieval system (EDGAR). I can then hand collect the dates of the main stages of the IPO process for a sample of 272 IPOs that filed with the SEC from January 2005 to December 2007 (I excluded 9 IPOs with a registration period superior to one year).
11
and/or the number of shares of the offer. This stage is the longest of the IPO process with an average duration of 92 days for my sample firms.
It is only when the company and its advisers consider that all of the SEC’s comments have been satisfactorily addressed, that the marketing phase of the issue begins through the road show, a two or three-week speaking tour where the company is presented to prospective investors and security analysts and where the underwriters gather information about the valuations and the interest of investors (stage 3). Note from Figure 1 that this third stage overlaps with stage 2 as even when the road show is finished, the issuer can file new amendments to incorporate some minor modifications required by the SEC and/or to modify the size of the offer.
When the road show is completed and the SEC is satisfied with the contents of the prospectus, the company and the lead underwriter choose the optimal effective date according to market conditions. In theory, the registration statement will become effective 20 days after the last filing. However, the issuer and the underwriter cannot afford to wait for 20 days because of potential changes in market conditions. That is why they file with the SEC a request for
acceleration, asking it to accelerate the effective date of the registration statement. In general, the SEC declares the registration effective at the day specified by the issuer and the underwriter, provided that the request is made at least two business days prior to the proposed date (stage 4).
Once the issue is declared effective, the issuer has fifteen business days to complete the IPO (stage 5). During this post-effective period, new amendments may be filed to change the terms of the offer with some possible delays if the changes are substantial.6 The vast majority of
6
If the issuer wishes to modify the size of the offer, it can do so by filing an abbreviated registration statement (Form S-1MEF or SB-2 MEF), provided that the variation in the size of the offer does not exceed 20%. This new
registration statement will become effective immediately upon filing. However, if the issuer and the underwriter want to increase or to decrease the amount of the IPO by more than 20%, they have to file a post-effective amendment (Form POS AM) that must be reviewed again by the SEC and that can consequently delay the IPO.
12
firms (about 92% for my sample) are however going public in the two days following the date of effectiveness.
To sum up, the issuer has some control on the timing of the offer during stages 2, 3 and 5, while the SEC can influence the duration of the registration period during stages 1, 2 and 4. However, it must be noticed that the bulk of the cross-sectional variation in the duration of the registration periods comes from differences in the duration of stage 2. During this stage, both parties are involved and unfortunately, it is not possible to clearly distinguish when the company has some control and when the SEC is in the driving seat. As a result, the timing policy of the issuer must be analysed by considering variables controlling for possible institutional delays. Besides, because the paper focuses on the effect of market volatility on the duration of
registration, it is important to isolate institutional factors that could induce a positive relationship between market volatility and the duration of registration. The only reason why such a positive relationship may exist is through the need for the issuer to refile for changes in the offer terms and to recirculate the prospectus to potential investors. A test of robustness for the presence of a relationship between market volatility and the duration of IPO registration could then consist in testing whether volatility also influences the timing policy of firms that do not refile for changes in their offer size.
4. Data and methodology
4.1 The sample selection
The sample is composed of firms that filed a preliminary prospectus with the SEC between 1986 and 2007 to go public on the NYSE, the AMEX and the Nasdaq. Financial firms (SIC code 6), unit offerings, American Depository Receipts, offers of non-common shares, and issues with an offer price below five dollars (penny stocks) are excluded. I also eliminate offers
13
by foreign private issuers (registration forms F-1) because information on the true filing date of these issuers is not publicly available. Information on the identity of issuers and on the
characteristics of the issues comes mainly from the Securities Data Corporation (SDC) New Issues database. I lost 96 firms, for which I was unable to know the listing market. Finally, I only consider firms that attempt to go public for the first time (firms previously listed returning to the market and firms that have already tried to go public in the past are excluded).
To obtain the durations of the registration periods, I collect the dates the registration statements are filed with the SEC and the effective IPO dates for successful offers. For withdrawn issues, the date of termination of the registration period is the date the firm files a registration withdrawal request (RW filing). This information is however missing for several observations, as about one quarter of withdrawn offers of my sample did not file any withdrawal request. These registrations are deemed withdrawn by the SEC 270 days after the last amendment date. Following Benveniste et al. (2003), this is hence the termination date I consider for these observations.
The final sample is composed of 5,742 firms, of which 4,524 have gone public, 1,179 have withdrawn their offer and 39 have not yet gone public or withdrawn their offer by 30 June 2008 (right-censored observations).
4.2 Explanatory variables
Because the duration of the registration period depends on stock market conditions, but also on institutional and marketing delays that are independent of the timing policy of the issuer and the underwriter, I consider in addition to market condition variables, several variables reflecting issuer and offer characteristics, and which are likely to explain some differences in institutional and marketing delays.
14 4.2.1 Market conditions
Market valuations
The level of the stock market index (in logarithm) is measured at the beginning of the spell and takes different values every five business days, until the IPO or withdrawal date. A high level of the index should increase the risk that the firm goes public over the coming week. As evidenced by Pagano et al. (1998) the level of market valuations (and more precisely book-to-market ratios) is a major determinant of the timing of IPOs. Also, on theoretical grounds, Draho (2000), Benninga et al. (2005) and Busaba (2006) predict that firms are more likely to go public when market valuations are high.
Market return
The market return is defined for each issue as the buy-and-hold return of the market index over five business days. For example, for a company that files with the SEC on a Tuesday, the market return is computed as the buy-and-hold return of the stock market index, from the closing of the day before the filing date (that is Monday) to the closing of the fourth business day
following the filing date (that is the next Monday), and so on, until the five-day period
surrounding the IPO or withdrawal date. Because in a fast rising market the IPO candidate can expect a higher valuation by waiting, the time-varying market return is conjectured to decrease the risk that the firm is taken public over the coming week. Note that for this hypothesis to make sense, one must assume that the index return is positively autocorrelated, at least in a short horizon. In line with this idea, empirical evidence indicates some positive serial correlation in daily and weekly returns of stock indexes (see e.g. Lo and MacKinlay (1988)).
Market volatility
15
making candidates to the IPO market more reluctant to exercise this option. The time-varying volatility of the market is computed as the standard deviation of daily market returns over five business days. In order to get a forward-looking measure of volatility, I follow Bulan (2005) by using the realized values of volatility as a proxy of expected volatility under the assumption of rational expectation.7 Hence, for a company that files on a Tuesday, the time-varying volatility of the market is measured as the standard deviation of daily returns of the market index from
Tuesday to the next Monday.
Contemporaneous filings and contemporaneous IPOs
The number of contemporaneous IPO filings is expected to have a negative effect on the duration of the registration period. As outlined by Boehmer and Ljungqvist (2004), it is probable that firms compete in their efforts of promotion towards investors. The threat of competition for the attention of investors should then lead issuers to exercise their timing option sooner when the number of contemporaneous IPO candidates is higher. The number of contemporaneous filings is defined as the number of filings from the same Fama and French (1997) industry of the issuer of interest, observed over a period running from three weeks before, to three weeks after the filing date of the issuer. The number of contemporaneous IPOs from the same industry may also have a negative effect on the duration of the registration by making the valuation of the offer easier (see e.g. Benveniste et al. (2003)). The number of contemporaneous IPOs is defined as the number of firms from the same Fama and French (1997) industry of the issuer of interest going public over the six weeks surrounding the filing date of the issuer.
4.2.2 Characteristics of the offers and the issuers
The second set of explanatory variables consists of specific factors to the offers and to the
7
16 issuers, captured by the following variables.
Issue size
The size of the issue, which is likely to be correlated to the size of the firm, is expected to have a positive effect on the IPO hazard. Smaller firms are likely to receive more comments from the SEC review than bigger ones, extending the registration period. They may also be more difficult to market towards investors because of greater information asymmetry and because they are more risky. The issue size is measured as the log of the original maximum aggregate offering price (in millions of 2007 dollars) reported in the registration statement.
Underwriter reputation
The reputation of the lead underwriter of the issue is expected to be negatively related to the duration of the registration period for at least two reasons. First, high reputation investment banks are more familiar with the duties of the IPO process. Firms taken public by top-tier
investment banks are therefore less likely to lose time in administrative corrections with the SEC and should go public faster. Second, high reputation investment banks are likely to be more successful in promoting the offer and in generating investor interest, speeding up the closing of the order book. I use the Carter and Manaster (1990) reputation ranking updated by Carter et al. (1998) and by Loughran and Ritter (2004) as a measure of underwriters’ reputation.8
Venture capital dummy
VC-backed firms should attract more investor interest than non VC-backed offers, and should also benefit from the familiarity of venture capitalists with the SEC requirements. I incorporate in the regressions a dummy variable taking the value of one if the firm is VC-backed
8
This ranking is available on Jay Ritter’s website at http://bear.cba.ufl.edu/ritter/ipodata.htm. I lost 5 firms for which it was not possible to know the lead underwriter.
17
and zero otherwise.9 I conjecture that this variable is positively related to the probability that the firm goes public over the next week.
Debt retirement dummy
As stressed by Busaba et al. (2001), firms that use their proceeds to retire debt should be less pressured to get capital for expansion than firms that wish to fund investment opportunities. Hence, I conjecture that a debt retirement dummy variable (equal to one if firms intend to use their proceeds to repay debt and zero otherwise) should have a positive effect on the waiting time of issuers. To construct this variable, I do not rely on the “use of proceeds” variable of SDC, which is not very reliable and which is besides almost always absent for withdrawn offers. Instead, I hand-collect the information from the “Use of Proceeds” section of the prospectuses available from EDGAR since May 1996.
Finally, in order to control for omitted time and industry-specific factors, regressions include fixed-year effects and industry-fixed effects from the Fama and French (1997) industry classification.
4.3 Descriptive statistics
Panel A of Table 1 displays marginal and cumulated distributions of the durations of the registration periods of successful offers measured in calendar days. For the whole sample (columns (1) and (2)), almost half of the IPO candidates (41.7%) go public in the two months following the filing date, and three quarters (74.5%) in the three months following the filing date.
— Please insert Table 1 about here —
I also report in the table the distributions of the durations of the registration periods of
9
Information on VC-backing comes from SDC for completed offers and from VentureXpert for withdrawn issues, controlling for company name changes.
18
offers filed in periods of low stock market volatility and of offers filed in periods of high stock market volatility (respectively in columns (3) and (4) and in columns (5) and (6)). As can be seen from the table, the issuers of the low volatility group are almost twice as numerous as the issuers of the high volatility group to go public in the first two months following their filing date
(respectively 53.3% of 2,255 offers versus 30.2% of 2,269 offers). The null hypotheses of
equality of means (Anova test) and of equality of medians (Wilcoxon / Mann-Whitney test) of the duration of the registration periods of the two groups are both rejected at the 0.01% confidence level suggesting that stock market volatility may have a significant impact on the duration of the registration periods.
Panel B of Table 1 displays the same distributions of the durations of the registration periods for firms that withdrew their offers (median values of two-month market volatility for NYSE, AMEX, and Nasdaq withdrawn offers are respectively equal to 0.8%, 0.89%, and 1.38%). The main conclusions are opposite to the ones applicable to successful offers: a substantial
portion of firms withdrew their offer after one year of registration (this is also true when the sample includes only firms that filed a request for withdrawal) and market volatility seems to have a negative effect on the durations of registration probably because firms prefer to abandon their offer more quickly when the market is too volatile.
About 5% of the sample firms have a registration period of more than one year. In order to avoid the econometric results to be driven by these outliers, I restrict the analysis to firms whose registration duration does not exceed one year. Coefficient estimates for the whole sample are anyway very similar and often more statistically significant than those obtained for the sample of offers with a registration period inferior to one year. Results reported below can therefore be considered as conservative in this sense.
19
An analysis of the industry breakdown of IPO candidates does not indicate any major differences in the industry affiliation of successful and of withdrawn offers. About one quarter of the sample is composed of firms from the Business Services industry (Fama and French code 34), including more than 40 different lines of businesses. A huge part of firms from this industry (90.3%) are Nasdaq offers.
— Please insert Table 2 about here —
Table 2 reports summary statistics of the main explanatory variables for the 5,423 firms with a registration period below one year. The lowest (highest) market returns are observed in October 1987 (October 1987 and July 2002) for the NYSE and the AMEX and in October 1987 and April 2000 (May 2000) for the Nasdaq. Not surprisingly, Nasdaq returns are on average more volatile than returns of the two other markets. The most volatile periods occurred in October 1987 for the NYSE and the AMEX, and in April 2000 and January 2001 for the Nasdaq. 4.4 Methodology
This section presents the econometric methodology employed in analyzing the duration of firm registrations. Because the dependent variable (the time elapsed from the filing date to the IPO date or the withdrawal date) is measured in time, I use a hazard model to study the
determinants of the risk of going public. This model is widely used in financial economics papers that analyse the determinants of waiting times (see e.g. Ongena and Smith (2001), Boehmer and Ljungqvist (2004) or Giot and Schwienbacher (2007)).10
The hazard function of firm i, denoted hi(t) is defined as the limiting probability that firm
i will be taken public (or withdraw its offer) over a time interval ∆t given that it is still waiting to
10
An alternative method, known as accelerated failure time (AFT) model consists in regressing the logarithm of the waiting times on a set of explanatory variables. As we will see in section 5, results obtained with both types of models are anyway qualitatively the same.
20
go public (or to withdraw its offer) at the very beginning of this interval. Formally,
, ) | Pr( lim ) ( 0 t t T t t T t t h t i ∆ ≥ ∆ + < ≤ = → ∆
where T is a non negative random variable representing the waiting time. In the present case, ∆t is chosen to be five business days.
This hazard function depends on two elements: the time elapsed since the filing date, according to a baseline hazard function h0(t) determining the shape of the hazard with respect to
time, and a set of possibly time-varying covariates Xi,t. Hence:
), ), ( ( ) ( 0 i,t
β
i t g h t X h = ′where β represents the column vector of estimated coefficients. A form commonly employed for the hazard function is the proportional hazard rate model
), exp( ) ( ) ( 0 i,t
β
i t h t X h = ′where the risk of occurrence of the event is proportional to the baseline hazard h0. Depending on
whether the form of the baseline hazard function h0 is specified or not, the proportional hazard
rate model is said to be parametric or semi-parametric (Cox (1972) model). Parametric models assume a baseline hazard that increases or decreases monotonically over time. The Cox model is less restrictive since the form of h0 is not specified. It is in particular more appropriate when the
hazard function is not monotone with respect to time.
In the present case, the two possible types of exit (completion or withdrawal of the offer) are taken into account in a competing risks model (estimating the hazard of going public without considering withdrawn offers would indeed introduce a bias in the estimates). Each of the two exits is treated as a separate failure type assuming the other is right-censored. This implies that in
21
the case of the IPO exit (withdrawal exit), the likelihood function is maximized by considering withdrawn offers (firms that go public) as right-censored observations (see e.g. Giot and Schwienbacher (2007) for a detailed description of the competing risks model).
Clearly, no firm can go public immediately after its filing with the SEC. For this reason, I let the IPO hazard start from the beginning of the fourth week of registration (I lost three firms whose registration periods are inferior to three weeks).11 Note however that letting the IPO hazard begin from the filing date of the registration statement does not qualitatively change the results.
5. Empirical results
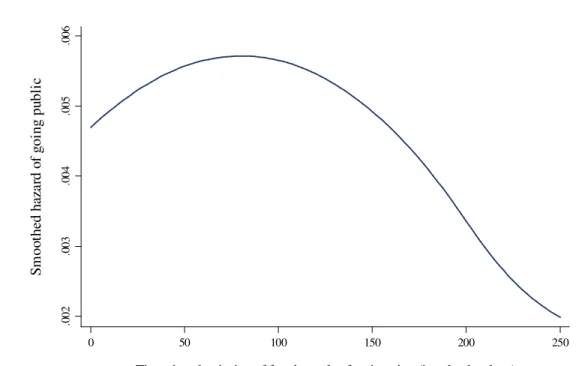
Before presenting coefficient estimates of the explanatory variables, it is useful to examine the shape of the hazard function. An estimation of this function derived from the semi-parametric Cox model for the whole sample of Nasdaq offers, is plotted on Figure 2 for the first 250 calendar days elapsed since the beginning of the fourth week of registration.12
— Please insert Figure 2 about here —
It can be seen from this figure that the hazard varies in a non-monotonous way over time. It first increases, reaching a peak at about 80 days after the third week of registration, before decreasing. Thus, the instantaneous probability that the firm is taken public over the next week ∆t increases with time (as the SEC begins to be satisfied with the contents of the registration statement, and the issuer gets a more precise estimation of investor interest) until the beginning of the fourth month of registration. After this date, if the firm has not gone public, it is less and less likely to
11
Ideally, I should use the date the first comment letter is issued by the SEC, but this information is only available for firms that filed from the end of 2004.
12
Hazard functions for NYSE offers and for AMEX IPOs (not displayed) have a similar profile, as well as the hazard function of withdrawing the offer.
22
do so. Because the hazard is not monotone, parametric models using the Weibull or the Gompertz distributions are not suitable for my sample. Also, I rely on the semi-parametric Cox model for the rest of the analysis.
5.1 Base specification
Table 3 reports the results of the competing risks model estimations for the two types of exit (IPO or withdrawal) of NYSE (columns (1) to (4)), AMEX (column (5)), and Nasdaq offers (columns (6) to (12)).
NYSE firms are going public faster when the market index is higher and market volatility is lower but do not seem to time their offer with respect to market returns (column (1)). A one standard deviation increase in the volatility of NYSE returns decreases the IPO hazard of these firms by 9.2%.13 Not surprisingly, firms abandon their offer earlier when the market index is low (column (2)).
— Please insert Table 3 about here —
For AMEX issuers, market volatility is the only stock market variable explaining the risk of going public, with the expected negative sign, at the 0.1% significance level: a one standard deviation increase in the AMEX volatility decreases the risk that the firm is taken public over the next five business days by about 34.8% (column (5)). I do not estimate the determinants of the risk of withdrawal of AMEX firms because of the very small size of the sample.
Only the IPO hazard rate of Nasdaq companies depends significantly (p-values below 0.01%) on the three variables of stock market conditions (column (6) of Table 3). First, Nasdaq firms are more likely to go public over the next week when the current level of the Nasdaq
13
The economic impact of the explanatory variable xi on the hazard is given by exp(βi×σi), where βi is the coefficient
23
Composite Index is high. Second, they are less likely to go public when the time-varying return of the index is high. This is consistent with the prediction that exercising the timing option in a fast rising market is not optimal as firms can expect a higher valuation by waiting. Nasdaq issuers are 8.7% less likely to go public over the next week ∆t if the market return increases by a one standard deviation over this week. This result also holds true when the five-day market return is measured over the prior week. Third, consistent with a positive value of waiting due to
uncertainty about general market conditions, the time-varying volatility of the Nasdaq Composite Index is negatively related to the risk of going public: a one standard deviation increase in the Nasdaq volatility leads to a decrease in the IPO hazard of about 12.6%.14 Note from column (7) that firms abandon their offer more quickly when the market is more volatile as well as when valuations are declining faster.
Contemporaneous filings and contemporaneous IPOs of firms from the same industry do not explain significantly the IPO and withdrawal hazards or with the unexpected negative sign (column (6), (10) and (12)).15
Turning now to issuer and offer-specific variables, Nasdaq firms taken public by
prestigious underwriters and those that are VC-backed have a higher risk of going public than the other firms (this last result also holds true among NYSE issuers). As previously mentioned, it is probable that the certification of the issue by reputable intermediaries makes the offer more attractive to potential investors while the expertise and the familiarity of these intermediaries with
14
I also considered a lagged measure of market volatility (that is the value of the standard deviation of daily Nasdaq returns over the five business days prior to the beginning of the spell). The results (not reported) are qualitatively the same. Finally, I find that results are robust to conditioning on industry (Fama and French equal-weighted industry returns) rather than market-wide returns.
15
Contemporaneous IPO volume has a negative effect on the IPO hazard but this effect is driven by outliers. The number of contemporaneous filings hastens the withdrawal of offers but is not significant over the whole sample period.
24
the SEC duties save the issuer from losing time in refilings for administrative corrections. The size of the issue (columns (3), (4), (9) and (10)) has no predictive power in explaining the IPO hazards, except for NYSE offers (this last result is however due to the presence of a few outliers) while the debt repayment dummy can only explain the risk of withdrawal but with a negative sign (column (10)). This last result seems to be driven by the high proportion of growth firms that tried to go public during the Internet bubble primarily to fund operating expenses and that withdrew their offer faster than other firms.
To assess the effects of the covariates on the registration time of IPO candidates, I estimate an accelerated failure time (AFT) model of the form
), log( )
log(Ti =
α
+Xi′,tγ
+τ
iwhere Ti is the registration time, α is a constant term, Xi,t is the vector of covariates, γthe column
vector of estimated coefficients, and τ is assumed to follow a log-normal distribution. Results for the sample of Nasdaq firms are reported in column (8) of Table 3 and are qualitatively similar to those derived with the Cox regressions (except for the number of contemporaneous IPOs that is no more significant at conventional levels). A one standard deviation increase in the Nasdaq volatility (in the Nasdaq return) leads on average to an increase of about 6 days (a decrease of 5 days) in the duration of registration of IPO candidates. These effects vary according to the characteristics of the issuers. For example, I find that a one standard deviation increase in volatility leads to an increase in the registration time of non-VC backed issuers of more than 9 days.
The positive relationship between market volatility and the duration of the registration period may be driven by a few outliers filing during periods of very high market volatility. Figure
25
3 plots the quarterly series of the average length of time in registration of Nasdaq IPOs and the quarterly series of standard deviations of daily returns of the Nasdaq Composite index.
— Please insert Figure 3 about here —
As can be seen from this figure, the fourth quarter of 1987, the third quarter of 1990 and the 1998-2003 period are characterized by high market volatilities as well as by relatively long durations of IPO registrations. Columns (11) and (12) in Table 3 report results of the estimations when firms that registered their offer in the fourth quarter of 1987, in the third quarter of 1990 or from 1998 to 2003 are removed from the sample. Results do not differ substantially from those obtained for the whole period 1986-2007 (column (6)). Importantly, the standard deviation of the Nasdaq Composite index daily returns is still significant in explaining the IPO hazard (the null hypothesis of a zero coefficient is rejected at the 5% confidence level).
5.2 Effects of market returns and market volatility in bullish and in bearish markets In this section, I differentiate the effects of market returns and of market volatility on the risk of going public, in bullish and in bearish periods. I focus on the sample of Nasdaq offers as it is the only sample of issuers whose IPO hazard depends significantly on the three variables of stock market conditions. For each observation, I construct four new variables. I first multiply the market return and the market volatility variables by a dummy variable equal to one if the five business day market return is positive or null, and to zero otherwise. Similarly, I multiply the market return and the market volatility by a second dummy variable that equals one if the five business day market return is strictly negative, and zero otherwise.
— Please insert Table 4 about here —
Estimates of the coefficients of positive and negative market returns are reported in column (1) of Table 4. The time-varying return of the Nasdaq Composite index has a significant negative effect
26
on the risk of going public when it is positive (p-value < 0.01%). This result is consistent with a real option interpretation of IPO timing. The value of waiting increases in bullish markets because issuers expect a higher market valuation in the future. Thus, firms are less likely to go public over the next week when market valuations are rising very fast. Conversely, the market return does not have any significant effect on the IPO hazard when it is negative (p-value = 0.94). A candidate explanation to this result is that the negative market return has two opposite effects on the risk of going public. On the one hand, when the market is bearish and the issuer anticipates that valuations are going to fall further in the future, waiting is costly and the firm will be more likely to go public faster before the window of opportunity closes definitely. On the other hand, if the fall in valuations is too large, the issuer may prefer waiting for a recovery in market
valuations before going public. The overall effect of the negative market return on the IPO hazard is therefore ambiguous, explaining why the estimated coefficient for this variable is not
statistically significant.
In regression (3), I incorporate the standard deviation of daily market returns in bullish markets and the standard deviation of daily market returns in bearish markets. These two
variables have a negative and very significant effect on the IPO hazard (p-values below 0.01%). Market volatility in rising markets has a larger economic impact on the IPO hazard than market volatility in declining markets. A one standard deviation increase in the market volatility in bullish markets (σ = 0.70%) translates into a decrease in the IPO hazard of 14.6% while a one standard deviation increase in the market volatility in bearish markets (σ = 0.85%) leads to a decrease in the IPO hazard of about 11.1%. This indicates that the negative effect of market volatility on the IPO hazard documented in Table 3 is not simply driven by the fact that market falls are generally associated with high volatility. Even in rising markets, issuers hold an option
27
value of waiting due to uncertainty about general market conditions.
Regression (5) simultaneously considers the return and the volatility of the Nasdaq
Composite index in bullish and in bearish periods as covariates of the IPO hazard. The results are qualitatively the same.
Finally, columns (2), (4) and (6) report estimation results for the risk of withdrawing the offer. The withdrawal risk depends significantly on negative market returns: the more the market is declining, the more quickly firms abandon their offer. Besides, as for IPO risk, market
volatility matters for withdrawn offers both in bearish and in bullish markets.
5.3 Is the negative relation between IPO hazard and market volatility due to institutional delays?
The results presented in the previous sections clearly indicate a negative effect of market volatility on the IPO hazard of Nasdaq issuers. In this section, I test whether Nasdaq firms are voluntarily waiting longer before going public when market volatility is higher or if the positive relation between the waiting time of IPO candidates and market volatility is driven by regulatory delays resulting from changes in the offer size during the registration period. Regulatory
constraints could indeed explain why IPO candidates are waiting longer in periods of high market volatility, since firms are more likely during these periods to modify their aggregate offer price by a large amount, breaking the 20% rule and redistributing the prospectus to potential investors.
As suggested in section 3, a simple test of the regulatory constraint hypothesis consists in studying the effect of market volatility on the IPO hazard of firms that do not refile for a change in the aggregate offer price range. If there exists a value of waiting due to volatility during the registration period, even non-refiling firms should be waiting longer before going public when market conditions are more volatile. Otherwise, the negative effect of market volatility on the
28 IPO hazard should only be valid for refiling firms.
I hand-collect information on the number of refilings from IPO prospectuses. For each issue, the number of refilings is here defined as the number of pre-effective amended
prospectuses (S-1/A and 2/A forms), of abbreviated registration statements (S-1MEF and SB-2 MEF amendments) and of post-effective amendments (POS AM form) that disclose a change in the price range and/or in the number of shares from those indicated for the first time in the
registration statement.16 For example, an issuer that revises the aggregate offer price in a pre-effective amended filing and then in a post-pre-effective amendment, has two refilings.
Because most IPO prospectuses have been available on the SEC’s EDGAR service only since May 1996, the sample is restricted to Nasdaq firms that filed with the SEC from May 1996 to December 2007. Excluding offers with a registration period over one year, and 24 IPOs with missing information leaves me with a final sample of 2,291 firms (1,617 IPOs, 652 withdrawals and 22 right-censored observations).
— Please insert Table 5 about here —
Panel A of Table 5 reports descriptive statistics for the number of refilings. Almost half of the observations (780 out of 1,617) are going public without changing the price range and/or the number of shares from the first filing disclosing the aggregate offer price range. The vast
majority of refiling firms (76%)modify their offer size and/or their price range only once, and in general in a pre-effective amendment (in 75% of the cases). On average, non-refiling issuers are waiting for about 90 days before going public (median value of 76 days) versus 101 days for
16
Although abbreviated registration statements become effective upon filing with the SEC, the issuer may want to recirculate the preliminary prospectus to potential investors after a change in the terms of the offer. Therefore, as a conservative test of the regulatory constraint hypothesis, aggregate offer price changes associated with abbreviated registration statement filings are assumed to possibly postpone the completion of the offers.
29
refiling firms (median value of 84 days). If the differences in the durations of the registration periods are due to regulatory constraints consecutive to refilings, at first sight these later do not seem to cause very large delays in the completion of the offers. This tends to be confirmed by Sun (2004) who documents from a random sample of 422 firms that filed with the SEC between May 1996 and September 2002, that among the 185 issuers that have refiled at least once, 125 (with 86 having modified the offer price by more than 20%) have gone public in the five next business days following their last refiling. As regards my sample, refiling firms are going public on average 10 days after their first change in the offer size, and 55% of these issuers are going public in the two days following their first refiling.
Column (1) of Table 5, Panel B shows Cox estimates of the risk of going public (competing risks model) of the 1,617 Nasdaq issuers that filed with the SEC since May 1996. Results are broadly the same as those obtained for the whole sample (1986-2007 filing firms). Column (2) reports the results of the estimation for the sample of non-refiling IPOs. All variables of market conditions are significant in explaining the IPO hazard. Importantly, the market
volatility still explains the IPO hazard with the expected negative sign at the 0.2% significance level, refuting the regulatory constraint hypothesis.
6. Conclusion
This paper investigates the presence of a short-term timing strategy of firms going public by examining how the waiting time of issuers reacts to stock market conditions, from the date firms file a registration statement with the SEC to the effective IPO date. The data show that overall market conditions have a significant impact on the duration of registration of Nasdaq firms, in three respects. Firms in registration for IPOs are more likely to go public over the next
30
week when the level of the stock market index is high, and when the time-varying market return and the time-varying stock market volatility are low. Besides, I find that candidates to the IPO market are withdrawing their offer sooner when market volatility is higher.
These results seem at odds with the predictions of Boehmer and Ljungqvist (2004) that firms are more likely to go public when market volatility is high (because stock market valuations should increase with the degree of uncertainty surrounding future profitability of firms) or of Busaba (2006) who claims that “firms can optimally time their IPO to coincide with increased market volatility”. It is important to stress that these conjectures concern IPO timing in the long-run (that is when firms should acquire an IPO or a withdrawal option by filing with the SEC) while my results apply to IPO timing in the short-run (that is when firms should exercise their going-public option once they have filed with the SEC). Thus, it is not impossible to observe simultaneously a higher volume of filings and longer durations of IPO registration in periods of high market volatility.
The adverse effect of volatility on the short-run decision to go public nevertheless raises questions about the efficiency of the functioning of the IPO market. Longer registration periods induced by uncertain market conditions (and more importantly withdrawals of offers) are costly to the firms, and can send a negative signal to the market. It is therefore surprising that no hedging instrument exists to limit these costs. A candidate explanation proposed by a banker is that such instruments would be relatively costly to firms since they would be mainly beneficial to small issuers whose IPOs are more likely to be concerned by market volatility. Yet, it must be noted that even IPOs of large corporations can be jeopardized during episodes of substantial volatility. As reported by Schill (2004), Goldman Sachs decided to withdraw its IPO in
31
large degree of volatility. Likewise, in October 2008 the German government postponed the country’s biggest privatization in eight years (the sale of a quarter stake in the state-owned national railway for more than 6 billion dollars), owing to extreme uncertainties in markets.17 However, there have also been some initiatives during the 2008-2009 financial turmoil to reduce the negative impact of market volatility on equity offers. For example, in order to help banks in trouble to recapitalize, the U.S. Treasury considered guaranteeing equity issues of these banks by combining the shares issued with put options (capping in this way investors’ losses). Evaluating the costs and the interest of arrangements to limit the negative effect of uncertain market
conditions on IPO transactions would be an interesting issue for future research.
17
“According to people close to the process, government officials and bankers from Deutsche Bank, Goldman Sachs, Morgan Stanley and UBS (…) abandoned the search for a price range after three days of unprecedented market volatility” (‘Berlin Delays IPO of Deutsche Bahn Unit’, Financial Times, October 10, 2008).
32
References
Benninga, S., Helmantel, M., Sarig, O., 2005. The timing of initial public offerings. Journal of Financial Economics 75, 115-132.
Benveniste L.M., Ljungqvist A.P., Wilhelm, W.J., Yu, X., 2003. Evidence of information
spillovers in the production of investment banking services. Journal of Finance 58, 577-608. Benveniste, L.M., Spindt, P.A., 1989. How investment bankers determine the offer price and the
allocation of new issues. Journal of Financial Economics 24, 343-361.
Boehmer, E., Ljungqvist, A.P., 2004. On the decision to go public: evidence from privately-held firms. Working paper, Texas A&M University and NYU Stern School of Business.
Bulan, L.T., 2005. Real options, irreversible investment and firm uncertainty: new evidence from U.S. firms. Review of Financial Economics 14, 255-279.
Busaba, W.Y., 2006. Bookbuilding, the option to withdraw, and the timing of IPOs. Journal of Corporate Finance 12, 159-186.
Busaba, W.Y., Benveniste, L.M., Guo, R.-J. 2001. The option to withdraw IPOs during the premarket: empirical analysis. Journal of Financial Economics 60, 73-102.
Carter, R.B., Dark, F.H., Singh, A.K., 1998. Underwriter reputation, initial returns, and the long-run performance of IPO stocks. Journal of Finance 54, 285-311.
Carter, R.B., Manaster, S., 1990. Initial public offerings and underwriter reputation. Journal of Finance 45, 1045-1067.
Cox, D.R., 1972. Regression Models and Life-Tables. Journal of the Royal Statistical Society 34, 187-220.
Dixit, A.K., Pindyck R.S., 1994. Investment under Uncertainty. Princeton University Press, Princeton, New Jersey.
Draho, J., 2000. The timing of initial public offerings: a real option approach. Working Paper. Yale University.
Eckbo, E.B., Masulis R.W., Norli, O., 2007. Security Offerings. In: Eckbo, E.B. (ed.), Handbook of Corporate Finance: Empirical Corporate Finance, Vol. 1 (Handbooks in Finance Series, Elsevier/North Holland), Amsterdam, p. 233-361.
33
Ellis, K., Michaely, R., O’Hara, M., 1999. A guide to the initial public offering process. Working paper. Johnson Graduate School of Management, Cornell University.
Fama, E.F., French, K.R., 1997. Industry costs of equity. Journal of Financial Economics 43, 153-193.
Giot, P., Schwienbacher A., 2007. IPOs, trade sales and liquidations: modelling venture capital exits using survival analysis. Journal of Banking and Finance 31, 679-702.
Lerner, J., 1994. Venture capitalists and the decision to go public. Journal of Financial Economics 35, 293-316.
Lo, A., MacKinlay, C., 1988. Stock market prices do not follow random walks: evidence from a simple specification test. Review of Financial Studies 1, 41-66.
Loughran, T., Ritter, J.R., 2004. Why has IPO underpricing changed over time? Financial Management 33, 5-37.
Loughran, T., Ritter, J.R., Rydqvist, K., 1994. Initial public offerings: international insights. Pacific-Basin Finance Journal 2, 165-199.
Ongena, S., Smith, D.C., 2001. The duration of bank relationships. Journal of Financial Economics 61, 449-475.
Pagano, M., Panetta, F., Zingales, L., 1998. Why do companies go public? An empirical analysis. Journal of Finance 53, 27-64.
Pastor, L., Veronesi, P., 2005. Rational IPO waves. Journal of Finance 60, 1713-1757. Rajan, R., Servaes, H., 2004. The effect of market conditions on initial public offerings. In:
McCahery J., Renneboog L. (eds.), Venture Capital Contracting and the Valuation of High-Tech Firms, Oxford University Press, New York, p. 437-463.
Ritter, J.R., 2009. Some factoids about the 2008 IPO market. Working paper, University of Florida.
Schill, M.J., 2004. Sailing in rough water: market volatility and corporate finance. Journal of Corporate Finance 10, 659-681.
Sun, C., 2004. Refiling behavior in the IPO process. Working Paper. School of Business, Queen’s University.
34 Table 1
Distributions of the duration of the registration periods of completed offers and of withdrawn offers
Panel A - IPOs
Registration (days) Whole sample Std. Dev. of market
returns < median σ
Std. Dev. of market returns ≥ median σ
(1) (2) (3) (4) (5) (6)
Marginal Cumulated Marginal Cumulated Marginal Cumulated
1-30 0.5% 0.5% 0.6% 0.6% 0.4% 0.4% 31-60 41.2 41.7 52.7 53.3 29.8 30.2 61-90 32.8 74.5 27.9 81.2 37.8 68.0 91-120 11.2 85.7 8.2 89.4 14.1 82.1 121-150 5.3 91.0 3.7 93.1 6.9 89.0 151-180 2.5 93.6 1.8 94.9 3.3 92.3 181-210 1.6 95.2 1.2 96.1 1.9 94.2 211-240 1.1 96.3 0.7 96.8 1.5 95.8 241-270 0.6 96.9 0.5 97.3 0.7 96.4 271-300 0.6 97.5 0.5 97.8 0.7 97.1 301-330 0.5 98.0 0.3 98.1 0.7 97.8 331-360 0.5 98.4 0.4 98.5 0.5 98.3 >360 1.6 100.0 1.5 100.0 1.7 100.0 Mean 86.5 77.9 94.9 Median 64 58 73 Min 20 20 21 Max 1,016 857 1,016 No. of observations 4,524 2,255 2,269 Panel B - Withdrawals
Registration (days) Whole sample Std. Dev. of market
returns < median σ
Std. Dev. of market returns ≥ median σ
(1) (2) (3) (4) (5) (6)
Marginal Cumulated Marginal Cumulated Marginal Cumulated
1-30 0.2% 0.2% 0.2% 0.2% 0.2% 0.2% 31-60 2.7 2.9 2.6 2.7 2.9 3 61-90 8 10.9 6.5 9.3 9.4 12.4 91-120 9.2 20.1 8.2 17.5 10.2 22.7 121-150 8.4 28.5 7.9 25.4 8.9 31.5 151-180 5.9 34.4 5.3 30.7 6.5 38.1 181-210 6.1 40.5 3.3 34 8.9 47 211-240 6.1 46.6 4.6 38.6 7.6 54.5 241-270 11.7 58.4 12.3 50.9 11.1 65.6 271-300 4.7 63.1 5.1 56.1 4.4 70 301-330 9.4 72.5 11.3 67.4 7.6 77.5 331-360 6.1 78.6 7.7 75.1 4.5 82 >360 21.4 100 24.9 100 18 100 Mean 280.4 300.2 261.0 Median 259 270 222 Min 8 8 23 Max 2,332 2,130 2,332 No. of observations 1,179 583 596
Columns (1) and (2) of Panel A (Panel B) report marginal and cumulated distributions of the registration periods in calendar days of 4,524 IPOs (2,332 withdrawn offers) that filed a preliminary prospectus with the SEC between 1986 and 2007. The registration period is defined as the number of days elapsed from the filing date to the effective IPO date (the withdrawal date). Columns (3) and (4) and columns (5) and (6) show respectively the marginal and cumulated distributions of the registration periods of offers filed in periods of low market volatility and the marginal and cumulated distributions of registration periods of offers filed in periods of high market volatility. An offer is assigned to the low (high) volatility group if market volatility over the two months following the offer’s filing date is strictly inferior (superior or equal) to the median market volatility of the sample of firms taken public on the same market.
35 Table 2
Descriptive statistics of covariates
Variable Mean Median Std. Dev. Min Max
NYSE return 0.20% 2.08% -25.88% 13.03% NYSE volatility 0.69% 0.48% 0.03% 9.51% AMEX return 0.22% 2.14% -29.62% 13.48% AMEX volatility 0.76% 0.53% 0.05% 11.52% Nasdaq return 0.23% 3.12% -25.3% 19.24% Nasdaq volatility 0.95% 0.78% 0.07% 7.68%
Number of contemporaneous filings 8.8 3 15.7 0 99
Number of contemporaneous IPOs 5.6 2 8.9 0 47
Offer size (in millions of 2007 dollars) 105.8 67.6 184.6 4.7 5,853.8
Ranking of the lead underwriter 7.6 8 1.8 0 9
The sample includes 5,423 firms with a registration period below one year which filed a registration statement with the SEC between 1986 and 2007. Descriptive statistics of returns (volatilities) for NYSE, AMEX and Nasdaq markets (respectively the NYSE Index, the Nasdaq Composite Index, and the AMEX Major Index) are drawn from the daily series of the five-day buy-and-hold market returns (five-day standard deviations of daily market returns) over the period 1986-2007. The number of
contemporaneous filings (number of contemporaneous IPOs) is calculated as the number of filings (IPOs) from the same industry of the firm of interest over a period of six weeks surrounding the firm’s filing date. The ranking of the lead underwriter is the Carter and Manaster (1990) reputation ranking of the lead underwriter and comes from Jay Ritter’s website.