M
@n@gement
Copies of this article can be made free of charge and without securing permission, for purposes of teaching, research, or library reserve. Consent to other kinds of copying, such as that for creating new works, or for resale, must be obtained from both the journal editor(s) and the author(s).
M@n@gement is a double-blind refereed journal where articles are published in their original language as soon as they have been accepted.
For a free subscription to M@n@gement, and more information: http://www.management-aims.com
© 2010 M@n@gement and the author(s).
Manuel Cartier
Sébastien Liarte 2010
Market entry timing, uncertainty and temporal
agglomeration: The case of the Hollywood cinema
industry
M@n@gement, 13(2), 70 - 98.
M@n@gement est la revue officielle de l’AIMS
M@n@gement is the official journal of AIMS
ISSN: 1286-4892
Editors:
Emmanuel Josserand, HEC, Université de Genève (Editor in Chief) Jean-Luc Arrègle, EDHEC (editor)
Stewart Clegg, University of Technology, Sydney (editor) Philippe Monin, EM Lyon (editor)
José Pla-Barber, Universitat de València (editor) Linda Rouleau, HEC Montréal (editor)
Michael Tushman, Harvard Business School (editor) Olivier Germain, EM Normandie (editor, book reviews) Karim Mignonac, Université de Toulouse 1 (editor)
Thibaut Bardon, Université Paris-Dauphine, CREPA - HEC, Université de
Genève (editorial assistant)
Florence Villesèche, HEC, Université de Genève (editorial assistant) Martin G. Evans, University of Toronto (editor emeritus)
Bernard Forgues, EMLyon Business School (editor emeritus)
accepted by Jean-Luc Arrègle
A s s o c i a t i o n I n t e r n a t i o n a l e d e M a n a g e m e n t S t r a t é g i q u e
Market entry timing, uncertainty and
temporal agglomeration:
The case of the Hollywood cinema
industry
Manuel Cartier
Sébastien Liarte
DMSP – DRM UMR 7088 Université Paris Dauphine manuel.cartier@dauphine.fr
CREOP – EA 4332 Université de Limoges (IAE) sebastien.liarte@unilim.fr
Abstract.
The aim of this article is to show that firms opt for temporal agglomeration (entering the market at the same time as their competitors) when uncertainty concerning the success of their products is particularly significant. An analysis of the major Hollywood studios from 2000 to 2006 shows that these firms limit uncertainty by adopting similar behaviours. Results show that a combination of factors lead to the agglomeration of film release dates. Budgets and styles are used as reference points by players in the industry; Oscar and day-off effects are strong. Rules and standards relating to the process of selection limit firms’ behaviour. More than a deliberate strategy, temporal agglomeration seems to emerge from complex interactions, increasing competition and thus decreasing the movies’ market performance.
Keywords:
entry timing, agglomeration, uncertainty, movie industry.
INTRODUCTION
Companies’ positioning in the competitive space determines with whom they enter into direct competition and whom they try to avoid (Porter, 1982). In a similar way to product positioning (what to sell) or geo-graphical positioning (where to sell), companies regulate competitive intensity by choosing to launch their products at a date (when to sell) which is closer to or more distant from that chosen by their competitors. Many studies in both strategy and marketing have examined this issue of the optimal timing for market entrance as compared with competi-tors. Two aspects of this problem have been studied in detail: move order (for a synthesis, see Szymansky, Troy & Bharaddwaj, 1995) and
move timing (Lee, Smith, Grimm & Schomburg, 2000). However, these approaches are not suitable for short life cycle products (Kurawarwala & Matsuo, 1996). In fact, it is not possible to talk about move order or move timing when the products concerned by a competitive response are no longer present on the market. In these cases, competitive stra-tegy should, rather, be considered in terms of proximity: either the com-panies are on the market at the same time because they release their products at the same date (as in temporal agglomeration), or they are not on the market at the same time because they launch their products when competitors are not present (as in temporal differentiation). Al-though in a large number of industries the choice of launch date for a new product is essential to its success or failure (Einav, 2007), there is a lot of uncertainty about the consequences resulting from this choice. In such a context, it seems that companies try to limit uncertainty (Cyert & March, 1963) by imitating dominant behaviours (Henisz & Delios, 2001). For example, empirical research has shown that geographical uncertainty has previously led companies to agglomerate around the same areas of implantation (Martin, Mitchell & Swaminathan, 1995; Martin, Swaminathan & Mitchell, 1998; Guillén, 2002).
The central focus of the present article is to find out if temporal agglo-meration also turns out to be companies’ response to uncertainty when they have to decide on timing for the launch of short life cycle products. In order to answer this question, this study examines the Hollywood ci-nema industry. Movies are products with very short life cycles because they average under ten weeks on release (Elberse & Eliashberg, 2003). There is also great uncertainty as to their success (Krider & Weinberg, 1998). In an industry where prices are relatively fixed, competition is waged through non-monetary characteristics such as the release date (Foutz & Kadiyali, 2008). As Barry Reardon, president of Warner Bros from 1982 to 1999 reminds us, ‘If you don’t pick the right release date, you can destroy the movie’ (cited by Corts, 2001: 514). Although re-search has developed models for predicting the results of a movie (see for example Neelamegham & Chintagunta, 1999 Eliashberg, Jonker, Sawhney & Wierenga, 2000), Hollywood remains‘The land of the hunch and the wild guess’ (Litman & Ahn, 1998, cited by Sharda & Delen, 2006: 243). This study thus aims to reveal why the temporal agglo-meration of film releases (Corts, 2001; Einav, 2002) proves to be the Hollywood majors’ response when they are faced with this situation of great uncertainty even though theoretical models demonstrate the interest of spacing out film releases (Krider & Weinber, 1998; Einav, 2002).
In the first section, we set out the theoretical justifications for choosing temporal agglomeration. The second section presents the empirical re-sults in detail. The rere-sults are then analysed in the third section and discussed in the fourth section. Finally, the conclusion stresses the limi-tations of this study and proposes avenues for future research.
LITERATURE REVIEW
More than any other decision, the choice of a movie’s release date is one which generates uncertain consequences in an environment where ‘nobody knows anything’ (Wall, 2005). Faced with this situation, decision makers are tempted to let themselves be guided by pressu-res exerted as much by demand as by supply. One way of minimi-sing uncertainty is by responding in a similar way to such pressures by choosing similar release dates. Moreover, institutions also encourage industry players to opt for temporal agglomeration when their movies are released.
Temporal agglomeration and characteristics of
de-mand
Traditionally, economics literature underlines the fact that increased demand influences supply (Cooper, 1979, Axarloglou, 2003). Notably, this results in the entry of new companies (Beath & Katsoulakos, 1991) even in uncertain and competitive environments (Chatterjee & Sugita, 1990).
High demand may be sought geographically, by looking for a propitious catchment area, or temporally, by exploiting seasonality. In fact, seaso-nality exists in almost all industries, giving rise to temporary peaks in demand. These peaks constitute an opportune zone for product re-lease because supply is more likely to be successful when launched during the cycle’s high phase (Radas & Shugan, 1998; Rajagopal, 2008). Consequently, the more sectors are marked by strong seaso-nality, the more companies opt for neighbouring release dates as they seek proximity to favourable periods (Axarlogiou, 2003).
The strong seasonal variations in box office sales (Sochay, 1994; Kri-der & Weinberg, 1998; Einav, 2002, 2007) are responsible for placing the North American cinema industry in the situation described above. More specifically, three periods appear to be particularly important (Lit-man, 1983; Litman & Kohl, 1989; Sochay, 1994) : Christmas (Novem-ber and Decem(Novem-ber), Easter (March and April) and the Summer (from June to September). For some authors, seasonality explains over 80% of box office variance (Makradakis & Wheelright, 1978). Business lo-gic makes it appear crucial that studios be present during these busy periods. Indeed, the studios seek to maximise sales momentum by attracting the maximum possible number of box office sales during the first weekend of a movie’s release (Lampel & Shamsie, 2000).
If companies do not always manage to launch their new products du-ring these particularly favourable periods (given the difficulties of timing for product schedules which do not always run smoothly), they can put it off and wait for another period where demand is higher (Rajagopal, 2008). Disney, for example, had planned to release The Lion King du-ring Christmas 1993 but the movie was not ready until January. The studios preferred to wait for the following summer, releasing it on July 15th so that they could benefit from a new period of high demand.
Hypothesis 1: The higher the demand, the more studios reduce the
temporal distance between their own movies and those of their com-petitors.
Temporal agglomeration and the characteristics of
supply
When companies offer undifferentiated supply, they are co-dependent (Gimeno, 2004, Kim & Mauborgne, 2005). Studies of competitive dyna-mics (Smith, Grimm, & Gannon, 1992; Day & Rebstein, 2004; Grimm, Lee, & Smith, 2005) show that companies offering products with similar characteristics tend to adopt the same behaviour and target the same markets (Chen, 1996; Jayachandran, Gimeno & Varadajan, 1999). There are several explanations for this. Firstly, reactions of defence and retaliation are to be expected if a company sets itself apart on a market where a competitor is clearly dependent (Chen & MacMillan, 1992; Gimeno, 1999). Secondly, if the companies are aiming at the same markets, they have to mobilise the same resources, which will re-sult in their exhibiting similar behaviour (Gimeno & Woo, 1996; Zaheer & Zaheer, 2001). In the cinema industry, majors tend to adopt similar behaviours when setting up release strategies for similar movies (Bord-well & Thompson, 2001; Zuckerman & Kim, 2003). Consequently, it is common in Hollywood to decide to release movies targeting the same audience on the same weekend. Columbia Studios, for example, deci-ded in 1992 to change the release date of the movie A Few Good Men, bringin it forward from December 18 to December 11. This was in order to release it the same day as Hoffa, a movie produced by Fox and also starring Jack Nicholson (Grover, 1992).
The degree of similarity of supply can be evaluated on two levels, one qualitative and the other quantitative. The qualitative view evaluates the specific characteristics of the markets being targeted (types of consu-mers), while the quantitative view looks at the size of markets being targeted (numbers of consumers).
Addressing the same public, that is seeking qualitative similarity, can create synergies. The theory of cumulative attraction1, which
esta-blishes a positive relationship between the size of supply and demand (Nelson, 1958) makes it possible to predict an increase in demand du-ring periods when there is concentration of supply. This theory is also put forward in Hollywood (Radas & Shugan, 1998). Increased demand through higher competitive intensity can be explained in two ways. Firstly, audiences who come to see a blockbuster and find the showing full may choose to see another movie at the same theatre.
They will tend to choose a similar type of movie. Secondly, if they do see the movie they expected, they will be satisfied by the supply of the specific entertainment offered by cinema-going. This satisfaction will encourage them to go and see other movies on show during the same period (Sochay, 1994).
1. Research has shown that geographical syn-ergies exist between shops (sometimes called positive externalities of demand) which result in increased turnover (Goldstein and Gronberg, 1984 ; Fujita and Thisse, 2002). Clustered supply results in increased consumption which spreads over all the competitors: this is the prin-cipal of cumulative attraction (Nelson, 1958).
Hypothesis 2a: The more studios find themselves in competition over
similar supply in terms of quality, the more they will reduce the tempo-ral distance between their films and those of their competitors.
Quantitatively speaking, similarity of supply concerns the number of consumers to be reached. If companies are targeting a similar num-ber, they may find it worthwhile to agglomerate. A commensalistic rela-tionship (Hawley, 1950), which relies on the non-parasitic exploitation of one organisation by another, may in effect appear (Barnett & Ca-roll, 1987). Voss, Parasuraman and Grewal (1998) demonstrate that a company does not benefit from being in competition with players which are less demanding than itself. The companies must be similar in size if the commensalistic relationship is to work at its best and parasitic be-haviour avoided. For example, Kalnins and Chung (2004) observe the geographical clustering of highly ambitious organisations in some areas and of those with weaker ambitions in others. A studio targeting a large number of consumers for a movie may therefore opt for temporal ag-glomeration, with those movies also seeking a high number of consu-mers. Moreover, it is necessary to set up more or less formal structures to favour exchange and co-operation between these players (Ingram & Inman, 1996). In the cinema industry, the temporal agglomeration of new films may be an opportunity to pool resources to attract attention to the cinema in general, thus acting together to stimulate demand and incite audiences to go to the cinema during particular periods (McCann & Folta, 2008).
Hypothesis 2b: The more studios find themselves in competition for
similar supplies in quantitative terms, the more they the reduce tempo-ral distance between their films and those of their competitors.
Temporal agglomeration and institutions
In order to survive in particularly uncertain environments, companies are motivated to follow the rules imposed by institutions. Inasmuch as they are the ‘rules of the game in a society’ (North, 1990 : 3), institu-tions are constraints which shape individuals’ acinstitu-tions. Such instituinstitu-tions influence economic, political and social behaviours because players are culturally linked into societies where institutions are important (Gra-novetter, 1985). At the temporal level, the proximity of activities gene-rally leads to the emergence of special occasions constituting temporal institutions (Demil, Leca & Naccache, 2001), that is to say, they are stabilised modes of social co-ordination (Selznick, 1996). Temporal institutions ensure social co-ordination by reducing the uncertainty which hangs on the behaviour of other players. These institutions may be formal, such as laws, or informal, such as conventions or codes of behaviour. The institutions may be endogenous to the sector, that is, generated and controlled by its players, or they may be completely exogenous. Neo-institutionalists (Meyer & Rowan, 1977; DiMaggio & Powell, 1983) suggest that adopting behaviours which match institu-tional expectations can be explained by the desire to conform to what
is perceived as a legitimate practice. This legitimacy can be defined as ‘a generalised perception of assumption that the actions of an entity are desirable, proper or appropriate within some socially constructed system of norms, values, beliefs and definitions’ (Suchman, 1995 :574). This search for legitimacy occurs because it has considerable effects (Heugens, Ven Riel & van den Bosch, 2004). Indeed, it facilitates ac-cess to resources, especially in environments where institutional pres-sures are high (Meyer & Rowan, 1977; DiMaggio & Powell, 1983). The cinema industry is characterised by a certain number of institutions which influence the behaviour of its firms (De Vany, 2003). Institutions exoge-nous to the industry influence the rhythm of audience demand, whereas endogenous institutions influence the rhythm of studio supply.
Regarding exogenous institutions, which influence demand, public ho-lidays (such as Independence Day, etc.) are institutions which are part of American culture and integrated into their symbolic systems (Warner, 1961). More specifically, these are temporal institutions exogenous to the cinema sector which influence the timing of studios’ film releases because demand is particularly available.
Hypothesis 3a : The more studios seek institutional legitimacy at the
level of demand, the more they will reduce temporal distance between their films and those of their competitors.
On the supply side, industry players have also set up institutions endo-genousto the sector. The festivals and prize-giving ceremonies or ga-nised by the cinema industry are institutions which influence the timing of movie releases. In fact, there is a ‘movie awards season’ (Gemser, Leenders & Wijnberg, 2008 : 33) with over 20 big ceremonies taking place over a period of six months. These are particularly important mo-ments because prizes and awards confer greater legitimacy and the-reby access to greater resources (Rao, 1998; Anand & Watson, 2004). Moreover, the large body of research into the link between a picture’s obtaining a prize and its box office figures tends to confirm this idea (Dodds & Holbrook, 1988; Nelson et al., 2001; Deuchert, Adjamah, & Pauly, 2005). Since studios have completely accepted the importance of these institutions for the performance of their films, they integrate competition for awards into their release strategy. For example, Disney has teams responsible for optimising film release strategies in line with the award season (Leenders, Gemser & Wijnberg, 2004). At the tempo-ral level, this means that studios seek to time a movie’s market release to correspond with the awards. Since they are competing for the same awards, studios will tend to opt for the same temporal strategies when releasing their products.
Hypothesis 3b: The more studios seek institutional legitimacy at the
level of supply, the more they will reduce the emporal the distance between their films and those of their competitors.
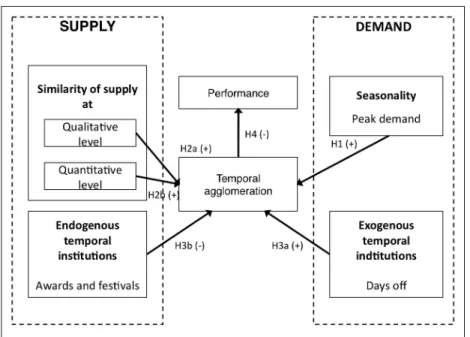
Figure 1 The hypotheses and model explained above were tested on the North American cinema industry. More specifically, movies re-leased in the United States between 1 January 2000 and 31 December 2006 by the six largest Hollywood studios were retained for analysis. Financial, production and distribution information on the movies was collected from the Internet Movie Database Pro (IMDBPro) and The Movie Times. These data were scrossed with those supplied by the weekly edition of Variety magazine.
Figure 1. Theoretical model: determinants of temporal agglomeration
EMPIRICAL STUDY
The hypotheses and model explained above were tested on the North American cinema industry. Specifically, movies released in the United States between 1 January 2000 and 31 December 2006 by the six lar-gest Hollywood studios were retained for analysis. Financial, production and distribution information on the movies was collected from the Internet
Movie Database Pro (IMDBPro) and The Movie Times. These data were
crossed with those supplied by the weekly edition of Variety magazine.
The North American cinema industry
With box-office takings generating a turnover of 9.78 billion dollars2 in
2008, the cinema industry is one of the central and most dynamic com-ponents of the entertainment industry and the North American economy in general (Eliashberg, Elberse & Leenders, 2005). Development and distribution costs are always on the rise. In 2007, The Motion Picture Association of America (MPAA) estimated the average cost of deve-loping a new film in the United States at 70.8 million dollars, not
inclu-2. Source: Motion Picture Association of Amer-ica, 2009.
ding 35.9 million dollars for distribution and marketing. Nevertheless, the results for companies remain more than uncertain; for example it is considered that six or seven in every ten pictures produced in the Uni-ted States do not generate enough revenue to cover their costs (Vogel, 2007). Given the large amounts of money involved and the uncertainty of the results, there is a particularly high risk associated with each mo-vie’s release.
Key players
The cinema sector includes three main players: producers, distributors and theatre owners. Producers ensure the film’s financing, control expen-diture and, if necessary, help the director with artistic choices such as the actors or the shooting location. Distributors manage the purchase of rights and the duplication of copies, promotions and programming (through ne-gotiations with the networks of exhibitors). At the end of the chain, theatre owners diffuse films to the public. This structure implies a free choice of release date because it is left to the discretion of the distributor, although this choice may be influenced by the availability of movie theatres. In so far as the industry is dominated by big studios which have incorporated the operations of production and distribution, we use the latter as the de-cision centre of a film’s release date (figure 2). Apart from their own films, studios may establish specific contracts with independent producers in order to help them produce and distribute their projects. In this case, the studios are not the only ones involved in decisions about the future film. However, given the economic weight of the majors and the exclusive contracts linking independent producers to studios in the case of regular projects3, the biggest studios keep the upper hand on crucial decisions
such as the release date of a movie (Mason & Gold, 2004).
This study is centred on the six Hollywood majors: Sony Pictures4,
BuenaVista Motion Pictures, NBC Universal, Warner Bros, Paramount Motion Pictures and Fox Entertainment. The final analysis deals with 1040 films which represent 46.6% of the total number of films released over the period in question but over 90% of total box office sales for the same period. Given their weight and history on the North American cinema market, these companies, also known as the Big Six, are repre-sentative of the tensions likely to exist within the industry as a whole.
3. In exchange for a possible collaboration with independent producers, the biggest stu-dios manage to obtain the right to be the first to agree to or to refuse a project through the cluses of « first refusal contracts ».
Operationalisation of variables
In order to test the hypotheses and model which we had constructed, it was necessary to operationalise the different concepts. We thus deve-loped indicators for the following: temporal dispersion, level of demand, similarities between competitors and proxies of institutions.
Temporal dispersion
In order to grasp the strategies behind companies’ movie releases compared to those of their competitors, an indicator of agglomeration with competing releases was constructed for each movie. Most re-search aiming at comprehending competitive intensity tends to resort to indicators of concentration determined over a period (Jedidi, Krider & Weinberg, 1998; Litman & Ahn, 1998; Zufryden, 2000; Einav, 2004). This type of indicator poses two problems. Firstly, it involves making a binary choice concerning the period (film released or not during the same period as the competition). Secondly, it does not make it possible to obtain a precise measure of the degree of proximity sought. A tem-poral dispersion indicator for each films i, measured by the root of the mean sum square between the release date of the film and its n closest temporal neighbours, and was used to respond to these problems. Temporal dispersion i =
A dispersion indicator equal to zero means that a film is released the same day as its n neighbours, that is, maximum temporal agglome-ration. The choice of release date as an indicator of market entry is retained here because most of the releases of the six main studios are national. In the case of films which have premieres (about 10% of cases), this must be considered as a communication operation before the release and not as market entry (Mohr, 2007).
Level of demand
Seasonality is used to operationalise the level of demand in a given period. A weekly diary can be used to understand the seasonality of the cinema industry in the United States. Over 75% of films come out on Fridays (as opposed to 20% on Wednesdays) and about 70% of the takings come from weekend box office sales. Decisions to withdraw films from the screen are also made each week by cinema owners. Nevertheless, even if an analysis in weeks demonstrates seasonal ef-fects (Radas & Shugan, 1998), this method comprises two limitations. Firstly, the traditional division of the year into 52 weeks is incapable of giving a perfect picture of the seasonal effects of the market. In fact, certain public holidays which correspond to peaks in cinema at-tendance are not on fixed dates (such as Memorial Day, the last Mon-day in May). Secondly a market’s seasonality is endogenous. In fact the studios anticipate periods of high demand and this incites them to release more movies or the movies with the highest potential, which in turn accentuates seasonality. To minimise these effects the method recommended by Einav (2007) was used. 56 dummy variables were
! with n the number of closest
neighbours considered and T the release date of a film
created in order to homogenise the specific characteristics of each year. It was therefore necessary to divide each year up coherently with the incidence of public holidays. Thus, weeks 1, 6, 13, 35, 42, and 56 do not appear every year. For example, Labour Day and Thanksgiving are always numbers 38 and 51 although there may be 11 or 12 weeks between these events. In this case, week 42 is included in the database when there are 12 weeks between the two, and disappears when there are only 11 weeks between them.
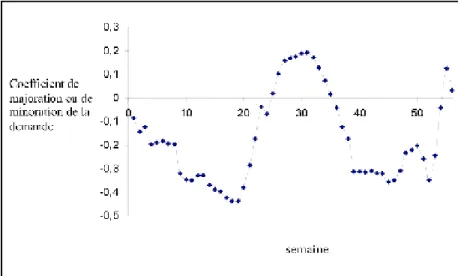
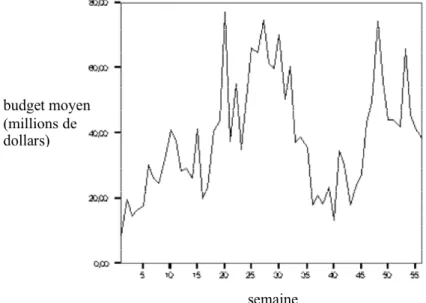
Furthemore, Einav (2007) isolates exogenous seasonal effects by ta-king account of the ‘movie’ effect on demand in terms of number and weight on the market. In fact, by releasing their movies during the same periods, the companies accentuate seasonality. In this case, it is supply which pulls demand. This phenomenon explains why ‘estimated seaso-nality in underlying demand is much smaller and slightly different from the observed seasonality of sales’ (Einav, 2007 : 127). To calculate the attractiveness of release at a given date, it is not enough to take ac-count of the exogenous demand for the week in question: acac-count must also be taken of demand for the whole duration of the movie’s diffusion. For this reason, we constructed a coefficient of increase or decrease in demand by combining demand per week and the relative importance of the first eight weeks, since on average, box office sales from the ninth week onward represent less than 5% of total takings (Radas & Shugan, 1998). The exogenous intensity of demand for a given week is shown in figure 3. The increase or decrease coefficient thus represents the relative increase or decrease in demand for a movie in each week of its release, all other things being equal.
Figure 3. Coefficient of increase or decrease of demand according to week
The peak where demand is highest is between weeks 21 and 36. Five of the six pictures with the highest budgets over the period 2000-2006 (Superman Returns, Pirates of the Caribbean 3, X-men 3, Terminator 3 and Spider Man 2) were in fact released between weeks 21 and 28. Only two periods of strong exogenous demand emerge, contrary to
tra-ditional literature, which refers to raw seasonality comprising Spring as a third period (Litman, 1983; Izod, 1988; Litman & Kohl, 1989; Sochay, 1994).
Similarity of markets between competitors
In terms of quality, market similarity can be understood through gen-re. As Austen mentions (1988 : 75), ‘audiences have type film prefe-rences and can articulate their prefeprefe-rences, frequently by employing commonly used genre labels’. Movies classified as the same genre share common scenario elements (Hsu, 2006) which form the ba-sis of audience expectations. These elements include characteristics such as the types of protagonists, the dramatic structure of the action, the major events, the style, the structure and the tone (Dancyger & Rush, 2002). The genre corresponds to a set of audience preferen-ces and explains why it is the main reason for their choice of film (Austin, 1988). The IMDBPro database lists 27 genres. Genres not corresponding to movies (music clips, news, shorts, documentaries, reality TV, sport, TV games and talk shows) as well as genres which are never represented alone (history, science-fiction, mystery, crime fantasy, film noir and biography) were withdrawn from the list. In the end, twelve genres were retained: war, drama, family, comedy, hor-ror, action, thriller, adventure, romance, western, cartoons and music. This classification across twelve genres facilitates a more refined understanding than the six-category classification (comedy, science fiction, drama, action/adventure, horror and children) used in pre-vious research (Litman, 1983; Litman & Khol, 1989; Sochay, 1994). For each film i, the diversity of markets regarding quality of films is measured by the proportion of neighbouring films of different genres. An indicator equal to zero means that all the neighbours are identical over the twelve genres in question, whilst an indicator of 1 means that they are all different.
Regarding quantity, the diversity of markets is studied through film budgets. It is important to consider the budget per movie because studios’ ambitions differ depending on the genre of movie. Disney, for example, is a giant in terms of cartoons and has enormous bud-gets dedicated to this genre. On the other hand, the company weighs less on the market for comedies because this genre is not its core business and there are bigger competitors playing in that field. The diversity of markets regarding quantity is measured for each film by the root sum square between the film’s budget and that of its n clo-sest temporal neighbours.
Diversity of markets for quantity i = Temporal institutions
Regarding temporal institutions which influence demand, six particular public holidays were retained. In the United States, the calendar of
!
With n the number of closest neighbours in question, m the number of genres and Gik the genre k of the film i
ceremonies is organised around two types of event: religious holidays and secular holidays based on significant events in the country’s history. Two religious holidays are to be noted: Thanksgiving (the last Thursday in November) and Christmas (25 December). For secular holidays, four days are noteworthy: Independence Day (4 July), Presidents Day (the third Monday in February), Labour Day (the first Monday in Septem-ber) and Memorial Day (the last Monday in May). The dummy variable ‘public holiday’ has the value 1 for films released at least seven days before a public holiday and 0 for the others. Furthermore, a dummy variable was created for each public holiday considered in order to be able to test their individual influence.
Regarding institutions with an influence on supply, attention is directed to the awards season. In fact, in the cinema industry, the main source of legitimacy for a film resides in winning awards (Gemser et al., 2008) especially in the annual competition for Oscars (Deuchert et al., 2005). This ceremony attracts worldwide media attention and involves more than 5800 members of the Academy, all of whom are professionals in the sector. Consequently, the choices and especially the nominations made by the Academy of Oscars are important signals for the market. Most of the profit from the ‘Oscar effect’ is generated by the nomina-tions, whereas winning an Oscar only generates a very small supple-ment (Nelson et al., 2001). Above all, the Oscar nominations have fi-nancial consequences. For example, a nomination in the ‘Best Motion Picture’ or ‘Best Actor in a Leading Role’ category can triple box office takings, and a nomination in the ‘Best Actress in a Leading Role’ in-creases takings by 150% (Deuchert et al., 2005).
The necessity of taking part in the competition can result in modifying a movie’s release date because, as King reminds us ‘clearly, the lure of added box-office punch that normally comes with the Best-Picture Oscar is another reason studio executives have preferred to open promising movies at the end of the year’ (King, 1992 : B4). The industry considers that the closer a movie’s release date to the deadline for an Oscar nomi-nation, the more that movie is present in the mind of those whose vote decide the nominations (Levy, 2001). Since, in order to be considered as a candidate, the movie must be in the cinema between 1 January and 31 December of the year before the ceremony, studios tend to release their movies at the end of the year (Gemser et al., 2008). All the pictures which won the Oscar for ’Best Picture’ between 1980 and 1990 were indeed released during the last four months of the year (King, 1992). A release close to the ceremony also avoids the movie’s being withdrawn from the cinemas before the awards are made, thus enabling the studios to take full advantage of the related rewards (Levy, 2001). All other things being equal, the search for legitimacy consists therefore in being eligible for the Oscars and thus choosing a release date close to the deadline in order to maximise the chances of nomination.
Seeking institutional support for supply i = Ji/365 where Ji is the day of the year of release of film i (ex-cept leap years)
Control variables
The results of the tests of the hypotheses are controlled using five variables. Firstly, the day of the movie’s release is taken into account, given the existence of a trend to increase the number of releases since 20005. Secondly, the movie genre is taken into consideration because
certain genres tend more strongly towards agglomeration than others, notably because of specialised festivals (like the International Festival of Animated Film in Annecy6 in June, the American Film Festival in
Deauville in September, or the New York City Horror Film Festival in October7). Indeed, the desire to participate in a festival, as described
above with the ‘Oscar effect’, is likely to modify the forecasted release date. Furthermore, certain movie genres have a more pronounced in-trinsic seasonality than others (like cartoons around Christmas). Thirdly, the studio is taken into account because a link can be made between certain studios and their available resources (Litman, 1983; Litman & Kohl, 1989; Zuckerman & Kim, 2003; Hsu, 2006). Movies re-leased by powerful studios have more resources for launch campaigns and for accessing distribution networks. Consequently, it is easier for them to access a wider audience. Six dummy variables, ‘Sony’, ‘Bue-naVista’, ‘Universal’, ‘Warner Bros’, ‘Paramount’ and ‘Fox’, have the value 1 if the film is distributed by the studio in question and 0 if not. Fourthly, the maximum number of cinemas where a given movie has been shown is taken into account. This variable has a great influence on the size of potential audience by determining the movie’s geogra-phical coverage and the available space for competition.
Fifthly, the number of screens in the United States from 2000 to 2006 is controlled, access to distribution being a possible criterion of choice for release date (Ferrari & Rudd, 2008).
RESULTS
Table 1 presents statistic descriptions of all the quantitative variables. Table 1. Statistics describing quantitative variables
5. A linear regression gives a coefficient of de-termination (R2) of the number of releases per year as 0.826.
6. Over the period 2000-2006, June is the month with the greatest number of releases of animated films: eight films out of a total of 58. 7. Over the period 2000-2006, September and October saw 28 of the 97 films released.
Temporal dispersion (5
neigh-bors)
Level of
demand Diversity of Qualitative supply 5 neigh-bours) quantitative diversity of supply (5 neigh-bours) Seeking support from endogenous institutions Maximum diffusion (number of cinemas) Total number of cinemas Mean Median Standard deviation Maximum Minimum 10,14 11,11 4,69 28,86 0 - 0,17 - 0,24 0,19 0,19 - 0,44 0,26 0,25 0,08 0,53 0,07 73,7 62,2 50,0 399,9 5,0 0,56 0,57 0,29 1 0,01 2 395,8 2 543,5 9 16,2 4 223 6 37 229 36 764 1 519,7 39 668 25 280
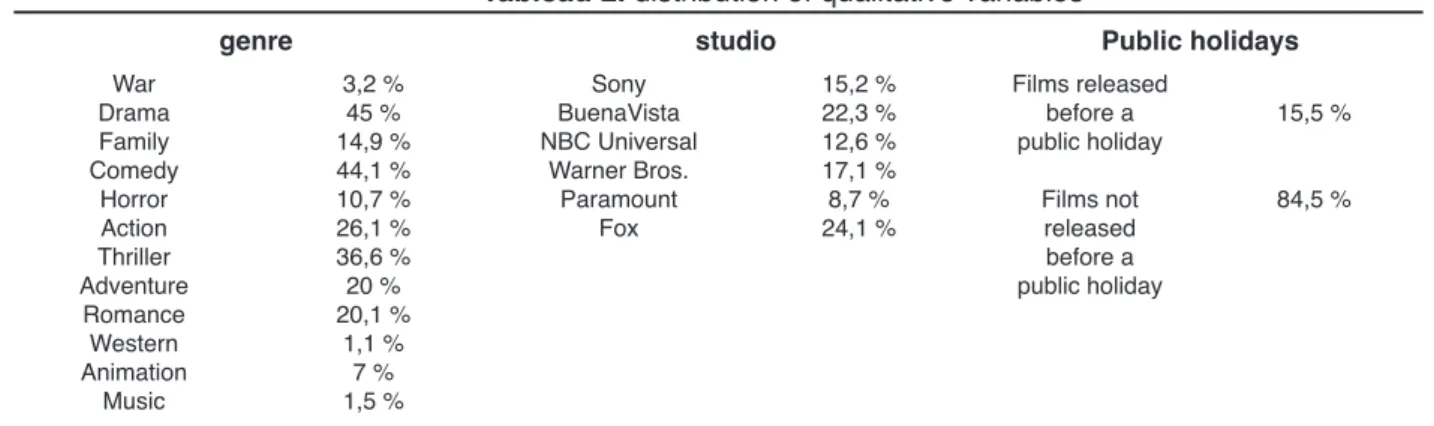
Table 2 shows the distribution for qualitative variables. Tableau 2. distribution of qualitative variables
Table 3 shows the correlations between all the quantitative variables. Tableau 3. Pearson Correlation between quantitative variables
The distribution of independent variables is a normal one (coefficient of asymmetry below 0.6 and Kurtosis coefficient below 1.3 for all the quantitative variables). Furthermore, the presence of threshold effects was tested, notably for the variables of qualitative and quantitative mar-ket similarity. We observe that, firstly, the direction of the relationships remains identical for high and low values of the considered variables and, secondly, that the models which integrate these effects are not si-gnificantly better than simple models. Baum and Haveman (1997) used a dispersion indicator with five, ten and fifteen neighbours for calcula-ting the geographical distance between new hotels in Manhattan and their competitors.
The same calculation was effected with movies whose release dates were closest to the movie being considered. Table 4 presents the re-sults of the linear regression OLS for the three models. Although colli-nearity might bias the estimate of the Beta coefficients (Belsay, 1991), its level was measured by variance inflation factors (VIF) between 1.05 and 1.43 for the independent variables and between 1.05 and 5.66 for the control variables, which is far lower than the maximum (VIF=10) indicated by Hair, Anderson, Tatham and Black (1998).
genre studio Public holidays
War Drama Family Comedy Horror Action Thriller Adventure Romance Western Animation Music 3,2 % 45 % 14,9 % 44,1 % 10,7 % 26,1 % 36,6 % 20 % 20,1 % 1,1 % 7 % 1,5 % Sony BuenaVista NBC Universal Warner Bros. Paramount Fox 15,2 % 22,3 % 12,6 % 17,1 % 8,7 % 24,1 % Films released before a public holiday Films not released before a public holiday 15,5 % 84,5 % 1. 2. 3. 4. 5. 6. 7.
1 Temporal dispersion (5 neighbors) 2 Level of demand
3 Qualitative diversity of supply (5 neighbors) 4 Quantitative diversity of supply (5neighbors) 5 Seeking suppport of endogenous institutions 6 Maximum diffusion (number of cinemas) 7 Total number of cinemas
1 -,089 1 ,176 ,064 1 ,061 ,322 ,271 1 -,440 ,239 -,117 -,134 1 -,191 ,091 ,263 ,294 ,114 1 -,098 ,005 ,011 ,017 ,034 ,046 1
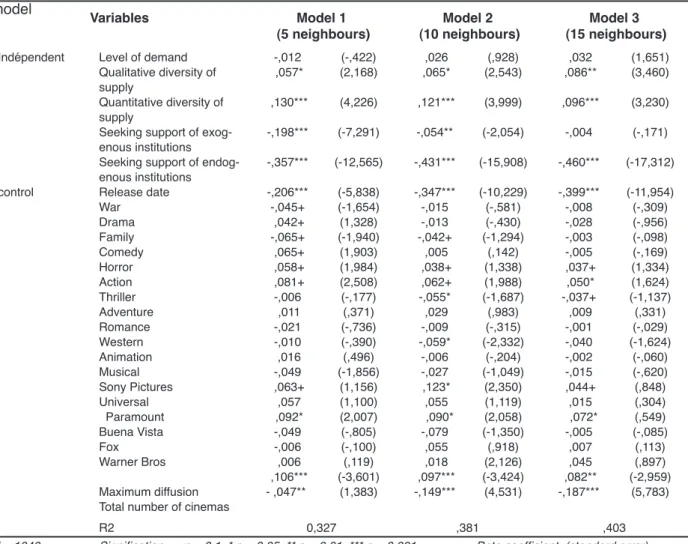
Tableau 4. Estimate of temporal dispersion using a linear regression model
The three models give similar results for the direction and significance of the five independent variables. The results are therefore valid wha-tever the level of proximity.
Impact of demand on temporal agglomeration
Hypothesis 1 is not corroborated. Temporal agglomeration does not match the level of market demand. Market seasonality therefore does not appear to be a satisfactory explanation for temporal agglomeration. Although this result may appear counterintuitive, it is coherent with pre-vious research and can be explained in three ways.
Firstly, there is no clear strong link between periods of high demand and the results of movies. The idea that releasing a movie in a period of high demand will increase its chances of success has often been questioned in previous research. Only tenuous links between certain
Variables Model 1
(5 neighbours) (10 neighbours)Model 2 (15 neighbours)Model 3
Indépendent control Level of demand Qualitative diversity of supply Quantitative diversity of supply
Seeking support of exog-enous institutions Seeking support of endog-enous institutions Release date War Drama Family Comedy Horror Action Thriller Adventure Romance Western Animation Musical Sony Pictures Universal Paramount Buena Vista Fox Warner Bros Maximum diffusion Total number of cinemas
-,012 ,057* ,130*** -,198*** -,357*** -,206*** -,045+ ,042+ -,065+ ,065+ ,058+ ,081+ -,006 ,011 -,021 -,010 ,016 -,049 ,063+ ,057 ,092* -,049 -,006 ,006 ,106*** - ,047** (-,422) (2,168) (4,226) (-7,291) (-12,565) (-5,838) (-1,654) (1,328) (-1,940) (1,903) (1,984) (2,508) (-,177) (,371) (-,736) (-,390) (,496) (-1,856) (1,156) (1,100) (2,007) (-,805) (-,100) (,119) (-3,601) (1,383) ,026 ,065* ,121*** -,054** -,431*** -,347*** -,015 -,013 -,042+ ,005 ,038+ ,062+ -,055* ,029 -,009 -,059* -,006 -,027 ,123* ,055 ,090* -,079 ,055 ,018 ,097*** -,149*** (,928) (2,543) (3,999) (-2,054) (-15,908) (-10,229) (-,581) (-,430) (-1,294) (,142) (1,338) (1,988) (-1,687) (,983) (-,315) (-2,332) (-,204) (-1,049) (2,350) (1,119) (2,058) (-1,350) (,918) (2,126) (-3,424) (4,531) ,032 ,086** ,096*** -,004 -,460*** -,399*** -,008 -,028 -,003 -,005 ,037+ ,050* -,037+ ,009 -,001 -,040 -,002 -,015 ,044+ ,015 ,072* -,005 ,007 ,045 ,082** -,187*** (1,651) (3,460) (3,230) (-,171) (-17,312) (-11,954) (-,309) (-,956) (-,098) (-,169) (1,334) (1,624) (-1,137) (,331) (-,029) (-1,624) (-,060) (-,620) (,848) (,304) (,549) (-,085) (,113) (,897) (-2,959) (5,783) R2 0,327 ,381 ,403
periods and better or worse results, or more pronounced but contradic-tory results, have been discovered (Litman, 1983; Sochay, 1994). This gap between the true level of demand and movie release dates may be explained by an endogenous effect created by the studios (Einav, 2002). By deciding to concentrate their releases over periods which they consider to be favourable in terms of demand, studios do in ef-fect stimulate demand. When they observe good results over these pe-riods, deciders are therefore reassured about their choice of periods; however, all the while, this high level of demand could be no more than an unfounded belief. For a certain number of periods such as Spring, positive results are not generated by exogenous demand but by the agglomeration of supply during this period.
Next, Radas et Shugan (1998) have shown that movies released during periods of low demand are more successful than those released during periods of high demand. These results can above all be explained by the fact that the studios try to release their big-budget movies over less popular periods (Einav, 2002). Competition is weaker and the movies, given their budget, are able to attract audiences by themselves. Studios thus do not seek to exploit these periods of high demand, but prefer to generate demand themselves.
Finally, the studios can constrain the choice of their competitors by pre-venting them from opting for temporal agglomeration. In periods of high demand, big-budget movies are released and pre-empt a share of the resources necessary for a movie’s exploitation (advertising space, ci-nemas with more copies of the movie available given its potential), thus limiting the possibility for competitors to enter the arena. The average budget per movie is shown in column 4. This budget is significantly correlated with the level of demand (R2=0,225) for big budget movies released during the summer and public holiday periods.
The budget makes it possible to implement a strategy of mass distri-bution, pre-empting a maximum number of cinemas. In fact, the maxi-mum number of cinemas where a movie is diffused is significantly cor-related with the average budget per movie (R2=0,426). The strategy of pre-empting cinemas through widespread diffusion is thus a means employed by the studios to avoid strong competition for their biggest budget movies (Swami, Eliashberg & Weinberg, 1999; Eliashberg, et
al., 2005)
Impact of supply on temporal agglomeration
The results show clearly that a similar level of supply leads to temporal agglomeration. Hypothesis 2a which postulated that the similarity of qualitative supply leads to temporal agglomeration is thus corrobora-ted (to a threshold of 5% for models with five and ten neighbours, 1% for the model with 15 neighbours). Even if the industry undergoes the « black hole effect » (Sochay, 1994 : 13), that is, particularly disappoin-ting results generated by cannibalisation between same genre movies released at the same time, similarity in terms of genre does not seem to be a brake on studios’ agglomerating releases. The belief that the posi-tive effects generated by agglomeration outweigh the « black hole » is a probable explanation for this result.
Hypothesis 2b, which postulates that the similarity of quantitative supply leads to temporal agglomeration, is also corroborated (at a threshold of 1% for all the models). The closer the budgets of neigh-bouring movies, the more their releases are concentrated over time. Companies behave in a similar way to other companies within their cognitive framework, that is, those which they consider to be their com-petitors (Reger & Huff,1993). Companies tend to adjust their behaviour to a point of reference through processes of signalling and imitation (Fiegenbaum & Thomas, 1995). In the domain of cinema, the key pro-jects of each studio are clearly identified. Budgets are therefore used as points of reference by the other players in the sector.
Impact of institutions on temporal agglomeration
Hypothesis 3a, stresses that the search for institutional legitimacy through demand leads to temporal agglomeration. It is corroborated for the models with five and ten neighbours (to a threshold of 1%). Indeed, seeking the support of exogenous institutions gives a signi-ficant explanation of temporal dispersion in the models with five and ten neighbours, and loses this power in the model with 15 neighbours. This difference comes from the role of local attraction played by public holidays. The result is agglomeration in the week which contains the holiday, but greater dispersion in the preceding or succeeding weeks. The average number of movie releases during a week preceding a public holiday was 3.84 (the average number of releases during a week which does not precede a public holiday is 2.85), more distance includes movies released further from the period resulting in sparser distribution. Studios choose to release their biggest budget pictures during periods with a strong institution for demand in order to limit risks
by guaranteeing a minimum box office. In fact, the average budget of movies released one week preceding a public holiday is 50,1 million dollars compared to 40,4 million dollars for a release at another period. (the t test of comparison of averages is significant at 0.3%). Neverthe-less, the influence of public holidays as an institution must be qualified, because taken one by one, only the impacts of Christmas and Indepen-dence Day are significant at respective thresholds of 1% and 5% (for the models with five and ten neighbours).
Hypothesis 3b, stressed that seeking institutional legitimacy through supply leads to temporal agglomeation. It is corroborated for all the models (at a threshold of 1%). Movie distributors are subject to strong pressure from film critics and from their permanent search for the pu-blic’s interest (Eliashberg & Shugan 1997). Distributors thus need to ex-ploit all institutions which attract this public interest through nominations or awards. Movie industry players adhere to this quest for legitimacy. Their compliance with peer selection (Gemser et al., 2008) implied by the Oscars, is imposed on all players in the institutional field (Meyer & Rowan, 1977). The regulations and norms linked to the selection process constrain the companies’ behaviour and lead to temporal ag-glomeration. In other words « the architecture tries to impose behaviour which may go against the companies’ strategy » (Demil et al., 2003: 246). The Oscars thus constitute a non-coercive normative institution in the sense of DiMaggio and Powell (1983). No formal sanction is ap-plied to movies which do not take part in the ceremony or which can-not benefit from the positive impact of their nomination until long after their release. However, the Oscars do incite the studios to release their picture closer to the date of the ceremony, thus delaying their release during the year.
Temporal agglomeration and control variables
Because over the years, an ever greater number of movies is released, the release date explains the temporal agglomeration of movies. The increase in the number of releases results in a mechanical increase in their proximity. The second control variable, movie genre, only has significant impact for action and horror movies. In fact, these genres suffer from rapid audience erosion and this means that they try to avoid strong competition when they are released (Jedidi, Krider, & Weinberg, 1998). The third control variable, the studio, only has significant im-pact on agglomeration for movies released by Paramount and Sony Pictures, both of which appear to have more systematic strategies of avoiding competition than their competitors. The fourth control variable, maximum diffusion, indicating the maximum number of cinemas where the movie is shown, has significant impact : the greater the number of theatres, the more the neighbouring movies are dispersed. This is because the movie in question pre-empts rare resources which are no longer accessible to competitors. On the other hand, an increase in the total number of cinemas available in the Unites States, covered by the fifth control variable, makes greater temporal agglomeration possible.
DISCUSSION
Studios tend to release their movies at the same periods as much from pressures of supply as from those of demand. Even if studios try indi-vidually to maximise the success of their movie by taking advantage of attractors such as periods favourable to certain genres (for example, Christmas time for children’s films), festivals and public holidays, the collective dynamic may in the end turn out to be a negative one. Despite the difficulties of proposing a reliable predictive model for a movie’s performance (Sharda & Delen, 2006), the impact of temporal dispersion can be studied so as to determine whether the individual benefits associated with the antecedents of agglomeration are offset by its collective disadvantages. In order to test the strategy of temporal agglomeration on performance, three models were constructed using three performance indicators.
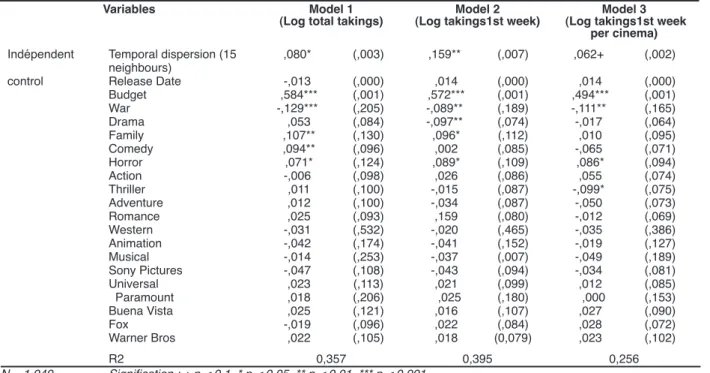
Box office takings remain the principal indicator of movie performan-ce (Sochay, 1994 ; Neelamegham & Chinatagunta, 1999 ; Zufryden, 2000). Given the supposed short term impact of temporal dispersion, box office during the first week is also taken into account. Finally, to estimate the potential impact of temporal dispersion apart from its ef-fects on distribution, a third model included the average takings in the first week per cinema in cinemas where the film was shown. In order to compensate for sample skewness, the logarithm function was applied to these three variables. The budget was controlled because it has a positive effect on takings, (Zufryden, 2000) and is linked to the choice of release date. Table 5 shows the result of the OLS linear regression for the three models.
Table 5. Estimate of takings with a model of linear regression
Variables Model 1
(Log total takings) (Log takings1st week)Model 2 (Log takings1st week Model 3 per cinema) Indépendent control Temporal dispersion (15 neighbours) Release Date Budget War Drama Family Comedy Horror Action Thriller Adventure Romance Western Animation Musical Sony Pictures Universal Paramount Buena Vista Fox Warner Bros ,080* -,013 ,584*** -,129*** ,053 ,107** ,094** ,071* -,006 ,011 ,012 ,025 -,031 -,042 -,014 -,047 ,023 ,018 ,025 -,019 ,022 (,003) (,000) (,001) (,205) (,084) (,130) (,096) (,124) (,098) (,100) (,100) (,093) (,532) (,174) (,253) (,108) (,113) (,206) (,121) (,096) (,105) ,159** ,014 ,572*** -,089** -,097** ,096* ,002 ,089* ,026 -,015 -,034 ,159 -,020 -,041 -,037 -,043 ,021 ,025 ,016 ,022 ,018 (,007) (,000) (,001) (,189) (,074) (,112) (,085) (,109) (,086) (,087) (,087) (,080) (,465) (,152) (,007) (,094) (,099) (,180) (,107) (,084) (0,079) ,062+ ,014 ,494*** -,111** -,017 ,010 -,065 ,086* ,055 -,099* -,050 -,012 -,035 -,019 -,049 -,034 ,012 ,000 ,027 ,028 ,023 (,002) (,000) (,001) (,165) (,064) (,095) (,071) (,094) (,074) (,075) (,073) (,069) (,386) (,127) (,189) (,081) (,085) (,153) (,090) (,072) (,102) R2 0,357 0,395 0,256 N = 1 040 Signification : + p < 0.1 * p < 0.05 ** p < 0,01 *** p < 0,001
Although from a theoretical point of view comprising competitive inte-ractions the best strategy appears to be temporal avoidance (Krider & Weinberg, 1998), the empirical results corroborate that temporal dis-persion is favourable to movie performance. Its impact is stronger in the short term (significant effect at a threshold of 1% on the first week’s takings) and remains positive throughout the whole diffusion period (si-gnificant effect at a threshold of 5% on the total takings). Since the im-pact of temporal dispersion is low during the first week per cinema, this positive effect seems to be linked to easier access to cinemas.
In order to maximise their a priori capacity of attraction evaluated by first week’s takings, movies should thus avoid frontal competition (Simonoff & Sparrow, 2000). In fact, first week’s takings make it possible to predict the movie’s final result (Elberse & Elisahberg, 2003) and consequently determine whether it continues to be screened. The a posteriori capaci-ty to attract audience due to reviews and positive word of mouth (Krider & Weinberg, 1998) is also important. On this level, movies should also avoid each other because the number of films which can be reviewed by critics and seen by audiences is limited.
It remains to be seen why players in the cinema industry adopt a less than optimal strategy (Krider & Weinberg, 1998) which results in smal-ler box-office success. In sectors of very high uncertainty, this question echoes another essential enquiry: « How do we manage in such cir-cumstances to behave in a manner which saves our faces as rational, economic men? » (Keynes, 1973 : 114).
In situations of uncertainty, traditional economic rationality which is « perfect, logical and inductive » (Arthur, 1994 : 406) no longer opera-tes : « in interactive situations of complication, agents cannot rely upon the other agents they are dealing with to behave under perfect rationa-lity, and so they are forced to guess their behaviour. This lands them in a world of subjective beliefs, and subjective beliefs about subjective beliefs.[…] In turn, rational, deductive reasoning […] itself cannot apply » (Arthur, 1994 : 406).
In this situation, individuals are obliged to act on the basis of conjec-ture about the anticipated behaviour of the group. It is then necessary to consider how the market behaves, its “norms” and representations (Orléan, 2001). One’s own individual opinion loses its value. Now, the psychology of a society made up of individuals where each tries to copy the others, results in conventional judgement (Keynes, 1973). In fact, conventions are formed and supported by individuals who try to decide what to do in a situation while trying to evaluate and reproduce what others would think or do in the same situation (Dupuy, 1989 ; Orléan 1989 ; Dupuy, 1994).
The results of this research show that a set of factors lead to the tem-poral agglomeration of movie releases. This choice does not result from deliberate and intentional actions on the part of the studios, but rather from external pressures. These factors then represent the rules to which studios submit in order to reduce uncertainty about the suc-cess of their films. Far from being a truly deliberate strategy, temporal agglomeration thus appears to be one of these rules, set up by the cinema industry in order to confront very high uncertainty. Einav (2002)
for example, shows that above average box-office in springtime is not attributable to demand (which remains stable during this period), but to the high concentration of supply at this time. Since decision makers have observed above average results for this period, they consider that it is a particularly good time for releases, thus they maintain the effect. Chiou (2008) also points out that the studios consider the week before Independence Day to be one of exceptionally high demand. Conse-quently, it is at this time that they decide to release their highest bud-get movies in order to limit the risks. It is not therefore surprising that audiences go to the cinema a lot during a period when a large number of big budget movies are released. In this way, periods which appear to be good for demand become high points when it makes sense to release movies. It is difficult for studios to question these conventions. Nevertheless, certain studios have taken steps to challenge certain in-dustry conventions. In 2002, the Columbia studio deliberately released Spiderman the week-end before Labor Day (traditionally looked upon as a dead weekend) to prove that there is no such thing as a bad wee-kend in itself. (Ainslie, Drèze, & Zufryden, 2005). However, such efforts remain exceptions.
Given the number of movies released annually the large number of stu-dios, it is very difficult for decision makers to find the right balance. In fact, theoretical models (Krider & Weinberg, 1998 ; Einav, 2004) adopt reasoning based on two players in non-repeated games to find the op-timal solution. Indeed, by multiplying the interactions, equilibrium situa-tions are also multiplied (Schelling, 1960 ; Lewis, 1969 ; Dupuy, 1989) making it possible to co-ordinate the actions of different players. Although temporal agglomeration turns out to be less than optimal ex post, it is clear that it appears to be a rational behaviour ex ante. The high uncertainty in the sector obliges the studios to choose a strategy which has become a convention regulating the interactions and the industry as a whole. Temporal agglomeration is therefore the result of normative mimicry (Orléan, 2001) whose end is to respect the beliefs, habits and norms specific to the community where the company is si-tuated. This respect may be the consequence of such a deep interio-risation of collective norms that these are imposed on the individual consciousness beyond all reason. In this case, for the studios, tempo-ral agglomeration becomes a non reflective behaviour, a simple rule of decision making (Einseinhardt & Sull, 2001), making it possible to deal with a situation of high uncertainty.
CONCLUSION, LIMITATIONS AND FUTURE
RE-SEARCH
This article has examined a certain number of factors which lead to movies being released concomitantly. However, there exist other fac-tors resulting in the temporal agglomeration of movies which have not been taken into account, and which it appears important to consider in future research. It is fairly rare to see research in the cinema industry dealing with markets outside the United States (Neelamegham & Chin-tagunta, 1999 ; Elberse & Eliashberg, 2003). However, this dimension could become more and more crucial for studios which increasingly opt for worldwide release at the same date (Eliashberg et al., 2005). Re-lease dates are thus chosen according to pressures common to most of the countries concerned; although these pressures may in the end be fewer, their influence is even more important. The peaks of seasonality around Christmas and the summer holidays are shared by a great number of markets (especially Europe for the North American studios). These peaks could thus constitute even more sought-after periods for release by the studios.
The choice of release date also has to be determined in agreement with the strategies decided for the distribution circuits outside the cinema (DVD, television, video on demand, etc.) (Hennig-Thurau, Hennings, Sattler, Eggers & Houston, 2007). This choice is even more important since the revenues generated by those channels are greater than those generated by the cinemas themselves (9.78 billion dollars in cinemas in 2008 compared to 22.4 billion dollars on the video market the same year8). Meanwhile, each of these distribution channels has its
speci-fic peaks of demand, and these too must be taken into account.There again, it is important to be able to determine a release date which allows optimal exploitation of all these peaks of demand, which this time are exogenous. The Christmas period is one of high demand for DVDs, one of the most common gifts at that time of year (Prasad, Bronnenberg & Mahajan, 2004; Chiou, 2008). In the US, the average gap between a movie’s cinema release and its release on DVD is from four to six months (Waterman & Lee, 2003). Releasing a movie at the beginning of the summer, for example, makes it possible to exploit this favourable box office period while still being able to exploit the Christmas period for DVD sales.
This explains why the temporal agglomeration of movie releases is greater for Independence Day and the 4 July than for Labour Day on 1 September (Chiou, 2008).
However, since temporal agglomeration turns out to be negative in terms of results ex post, this article sheds light on the strategies used by the studios to limit it. In fact, pre-empting the maximum possible number of cinemas is a way of avoiding the release of other movies at the same time. There are other ways of avoiding temporal agglomeration which deserve further examination in future research. Studios sometimes use co-financing as a tool enabling them to manage and limit risk
(Goett-8. Source : Motion Picture Association of America, 2009.
ler & Leslie, 2005). Co-financing appears to be a way for big studios to reduce competitive intensity through their choice of movie release dates (Goettler & Leslie, 2005). Studios tend to distance the release of movies which they produce alone from those of their partners; they also tend not to release their own movies close to those they co-produce (Goettler & Leslie, 2005).
Given the length of time it takes to make a movie, studios choose the release date far in advance. The announcement of this release, inclu-ding the actual date of release, is a way of avoiinclu-ding temporal agglome-ration as it sends an explicit signal to all the other players. Moreover, studios do not hesitate to change the real release date according to the announcements and releases of competing studios (Krider & Wein-berg, 1998; Foutz & Kadiyali, 2008). Dreamworks Studio, for example, decided to advance the release of Monsters vs. Aliens from 15 May 2009 to 27 March 2009 in order to counter Avatar, which Paramount had decided to release on the same date (15 May). It is noticeable that, on average, the studios do not shift their release dates by more than four weeks at the most (Foutz & Kadiyali, 2008). Changes in release dates cannot therefore be attributed to delays in production, but are truly strategic changes.
Finally, although this article studies the timing of these companies’ market entry vis-à-vis their competitors by analysing in particular the reasons and possible consequences of temporal agglomeration, it is important not to neglect the quality of the product for the consumer, and this is especially true for a movie. As a work of art, the quality of a movie can be defined by the intensity of emotion it is capable of arou-sing in the audience. In fact, it is this experiential dimension which is central and so difficult to anticipate for this type of good. It is this above all which remains the main predictor of success or failure, for as Tom Ortenberg, the distribution director of Lions Gate, reminds us, ‘There is never a bad time to release a good film – and there is never a good time to release a bad film’ (Rottemberg, 2003).
Acknowledgements. We extend our thanks to the editor, Jean-Luc Arrègle, for
the clarity and quality of his recommendations. Our thanks also go to the three anonymous reviewers for their very pertinent comments.
Manuel Cartier is a senior lecturer at Université Paris Dauphine. His research
focuses on industrial dynamics and innovation. He is interested in network-based organisations, modular products, technological breakdowns and their consequences and competition strategies employed to face uncertain circums-tances.
Sébastien Liarte is a professor at Limoges University (IAE). His research
focu-ses on competitive dynamics. He is interested in the competitive activities which influence inter-company relationships and facilitate competitive advantage.
REFERENCES
.
Ainslie, A., Drèze, �., & Zu-Ainslie, A., Drèze, �., & Zu-fryden, F. (2005).Modeling Movie Lifecycles and Market Share. Marketing Science, 24(3), 508– 517.
.
Anand, N., & Watson, M. R. (2004).Tournament rituals in the evolution of fields: The case of the Grammy Awards.
Academy of Management Journal, 47(1), 59-80.
.
Arthur, B. W. (1994).Inductive Reasoning and Bounded Ra-tionality. American Economic Review,
84(2), 406-411.
.
Austin, B. (1988).Immediate Seating: A Look at Movie Audiences, Belmont, CA: Wadsworth.
.
Axalogiou, K. (2003).The cyclicality of new product introduc-tions. Journal of Business, 76(1), 29-48.
.
Barnett, W., & Carroll, G. (1987).Competition and Mutualism Among Ear-ly Telephone Companies. Administrative
Science Quarterly, 32(3), 400-421.
.
Baum, J. A. C., & Haveman, H.A. (1997).Love thy neighbor? Differentiation and agglomeration in the Manhattan hotel industry, 1898-1990. Administrative
Science Quarterly, 42(2), 304-338.
.
Beath, J., & Katsoulakos, Y. (1991).The economic theory of product diffe-rentiation. Cambridge: Cambridge
Uni-versity Press.
.
Bordwell, D., & Thompson, K. (2001).Film art: An Introduction. New York, NY:
McGraw-Hill.
.
Chatterjee, R., & Sugita, Y. (1990).New product introduction under demand uncertainty in competitive industries.
Managerial and Decisions Economics, 11(1), 1-12.
.
Chen, M.-J. (1996).Competion Analysis and Interfirm Ri-valry: Toward a Theoretical Integration.
Academy of Management Review, 21(1), 100-134.
.
Chen, M.-J., & MacMillan, I.C. (1992).Nonresponse and Delayed Response to Competitive Moves: The Roles of Competitor Dependence and Action Ir-reversibility. Academy of Management
Journal, 35(3), 539-570.
.
Chiou, L. (2008).The Timing of Movie Releases: Evi-dence From the Home Video Industry.
International Journal of Industrial Orga-nization, 26(5), 1059-1073.
.
Cooper, R. G. (1979).The Dimensions of Industrial New Pro-duct Success and Failure. Journal of
Marketing, 43(3), 93-103.
.
Corts, K. S. (2001).The Strategic Effects of Vertical Market Structure: Common Agency and Divi-sionalization in the U.S. Motion Picture Industry. Journal of Economics and
Ma-nagement Strategy, 10(4), 509-528.
.
Cyert, R. M., & March, J. G. (1963).A Behavioral Theory of the Firm.
En-glewood Cliff, NJ: Prentice Hall.
.
Dancyger, K., & Rush, J. (2002).Alternative Scriptwriting: Successfully Breaking the Rules. Boston, MA: Focal
Press.
.
Day, G. S., & Reibstein, D. J. (2004).Wharton on Dynamic Competitive Stra-tegy. Hoboken, NJ: Wiley.
.
De Vany, A. (2003).Hollywood Economics: How Extreme Uncertainty Shapes the Film Industry New York. NY: Routledge.
.
Demil, B., Leca, B., & Nacca-Demil, B., Leca, B., & Nacca-che, P. (2003).Architecture de marché et régulation dans l’exploitation cinématographique française. Revue Française de Gestion,
142, 229-252.
.
Deuchert, E., Adjamah, K., & Pauly, F. (2005).For Oscar Glory or Oscar Money?
Jour-nal of Cultural Economics, 29(3),
159-176.
.
DiMaggio, P. J., & Powell, W.W. (1983).The Iron Cage Revisited: Institutional Isomorphism and Collective Rationality in Organizational Fields. American