Science Arts & Métiers (SAM)
is an open access repository that collects the work of Arts et Métiers Institute of Technology researchers and makes it freely available over the web where possible.
This is an author-deposited version published in: https://sam.ensam.eu Handle ID: .http://hdl.handle.net/10985/18158
To cite this version :
Guillaume DUBOIS, Philippe ROUCH, Dominique BONNEAU, Jean-Luc GENNISSON, Wafa SKALLI - Muscle parameters estimation based on biplanar radiography - Computer Methods in Biomechanics and Biomedical Engineering. - Vol. 19, n°15, p.1592-1598 - 2016
Any correspondence concerning this service should be sent to the repository Administrator : [email protected]
Muscle parameters estimation based on biplanar radiography
G. Duboisa, P. Roucha, D. Bonneaua, J. L. Gennissonband W. Skallia
aLBM/Institut de Biomecanique Humaine Georges Charpark, Arts et Metiers ParisTech, Paris, France;bInstitut Langevin, Laboratoire Ondes et Acoustique, CNRS UMR 7587, ESPCI ParisTech, INSERM ERL U979, Universite Paris VII, Paris, France
ABSTRACT
The evaluation of muscle and joint forcesin vivo is still a challenge. Musculo-Skeletal (musculo-skeletal) models are used to compute forces based on movement analysis. Most of them are built from a scaled-generic model based on cadaver measurements, which provides a low level of personalization, or from Magnetic Resonance Images, which provide a personalized model in lying position. This study proposed an original two steps method to access a subject-specific musculo-skeletal model in 30 min, which is based solely on biplanar X-Rays. First, the subject-specific 3D geometry of bones and skin envelopes were reconstructed from biplanar X-Rays radiography. Then, 2200 corresponding control points were identified between a reference model and the subject-specific X-Rays model. Finally, the shape of 21 lower limb muscles was estimated using a non-linear transformation between the control points in order to fit the muscle shape of the reference model to the X-Rays model. Twelfth musculo-skeletal models were reconstructed and compared to their reference. The muscle volume was not accurately estimated with a standard deviation (SD) ranging from 10 to 68%. However, this method provided an accurate estimation the muscle line of action with a SD of the length difference lower than 2% and a positioning error lower than 20 mm. The moment arm was also well estimated with SD lower than 15% for most muscle, which was significantly better than scaled-generic model for most muscle. This method open the way to a quick modeling method for gait analysis based on biplanar radiography.
KEYWORDS
Stereoradiography; muscle; gait analysis; lower limb
1. Introduction
The evaluation of muscle and joint forcesin vivo is still a challenge; this is why musculo-skeletal models are widely used to simulate and compute forces based on movement analysis. Models have different levels of precision and detail. Most of them are built from a scaled-generic model based on cadaver measurements (Delp and Loan 1995). Magnetic Resonance Images (MRI) are also used to adjust bone geometry, muscle via-points or origin and insertion points (Scheys et al. 2006). Musculo-skeletal models were used to study the influence of joint replacements (Kia et al. 2014) and muscle–tendon transfers (Delp et al. 1994). Neuro-muscular pathologies such as cerebral palsy (CP) were also widely studied (Arnold et al. 2006;Hicks et al. 2007;Scheys et al. 2011;Rezgui et al. 2013).
Authors have underlined the interest of using a subject-specific musculo-skeletal model. Functional roles of the muscles could be well predicted using a scaled-generic model (Correa et al. 2011). However, the level of detail had a major effect on the moment arm (MA)
CONTACT G. Dubois [email protected]
(Scheys et al. 2008) and on muscle force estimation. The effects of the hip joint center location (Lenaerts et al. 2009), body segment parameters (Pillet et al. 2010; Wesseling et al. 2014) and musculo-skeletal geometry have been studied.
Recently, the development of the low-dose biplanar X-Ray has provided a fast method for the reconstruc-tion of subject-specific bones (Baudoin et al. 2008;Chaibi et al. 2012;Quijano 2013), skin envelope and body seg-ment parameters of the lower limb (Nérot et al. 2015). Hausselle et al. (2012) proposed an original method to obtain a subject-specific musculo-skeletal model of the lower limb in the standing position by combining bi-planar X-Ray and MRI. However, the used of MRI is restrictive due to availability, cost and reconstruction time.
Biplanar X-Ray based reconstruction could be a com-promise between scaled and fully personalized musculo-skeletal models in the standing positing. The present study explores the level of accuracy that could be obtained using solely low dose biplanar X-Ray.
2. Materials and methods
2.1. Reference model in the standing position
Using both biplanar X-Rays in the standing position and MRI in lying position, the subject-specific musculo-skeletal model in the standing position was computed from the method proposed by Hausselle et al. (2012). This original method is based on a serie of rigid and elastic transformations to register muscle data based on 3D X-Rays reconstruction. The main steps of this method are reminded hereafter:
(1) Two perpendicular radiographies in the standing position of the lower limb were acquired. 3D ge-ometry in the standing position of bones (pelvis, femurs, tibias), skin envelope (Chaibi et al. 2012; Quijano 2013;Nérot et al. 2015) and estimation of insertion points coordinate were assessed from biplanar X-Ray using morphorealistic parametric subject specific model.
(2) 3D model of muscles and skin envelope model in lying position were manually reconstructed from MRI using DPSO method (Jolivet et al. 2008,2014; Nordez et al. 2009).
(3) For both X-Ray and MRI models, corresponding local coordinate systems of each segment were identified based on anatomical landmarks. (4) First, a rigid transformation was performed for
each segment. The skin envelopes of both models were placed in the same local coordinate system. (5) Then, in order to estimate the muscle shape in the
standing position, an elastic transformation was applied on each muscle using control points on skin envelope and bones (Trochu 1993).
(6) This process resulted in a musculo-skeletal model in the standing position, which combined the 3D models of skin envelope, muscles, bones and in-sertion points.
The obtained 3D musculo-skeletal model of the lower limb in the standing position was considered as the ref-erence model.
2.2. Geometric musculo-skeletal model in the standing position
By considering solely biplanar X-rays acquisition, a two steps method was considered and presented in details hereafter. First from biplanar X-Rays, 3D reconstruction was performed for skin envelope and bones, including location of muscle insertions. This model was further named bone-envelope model. To estimate the muscle shape, a reference model (bones, skin envelope, origin and insertion points and muscles) was deformed to fit
the subject-specific bone-envelope model. All the param-eters which refer to the geometric subject-specific bone-envelope model were designated with a subscripted be and all which refer to reference model with a subscripted
ref.
Step 1 Subject-specific bone-envelope model
The subject-specific bone-envelope model was acquired from low-dose calibrated biplanar radiography (Dubousset et al. 2005) (EOS®, EOS Imaging, Paris, France). 3D geometry of pelvis, femurs, tibias, fibulas and skin envelope were obtained in the global coordinate system of the X-Ray device using reconstruction meth-ods proposed by Chaibi et al. (2012), Quijano (2013) and Nérot et al.(2015). Virtual Reality Modeling Lan-guage was used to describe 3D surface of bony models. Moreover, the coordinates of muscle origin and insertion points were simultaneously obtained (Hausselle et al. 2012).
A local coordinate system was defined for each bone based on anatomical landmarks identified on the 3D surface:
• Pelvic frame: the centers of acetabular spheres and the sacrum plateau,
• Femoral frame: the centers of condylar spheres and the femoral head center,
• Tibial frame: the middles of the tibial plateaus and the middle of the tibial malleoli.
The following parameters were defined:
• five regions, associated to the following bones re-spectively, were defined and noted as Bref,iand Bbe,i for reference and bone-envelope models, withi = 1. . . 5: pelvis, right and left femur, right and left tibia.
• for each region homogeneous matrix was calculated from the global coordinate system to their local coordinate system and noted respectively as HMref,i
and HMbe,i, withi = 1 . . . 5 depending of the bone. • skin envelopes were respectively noted as SErefand
SEbe,
• origin and insertion points were respectively noted as IPrefand IPbe, with i = 1 . . . 42 (a single origin and insertion points were considered on 21 mus-cles).
Step 2 Reference model deformation
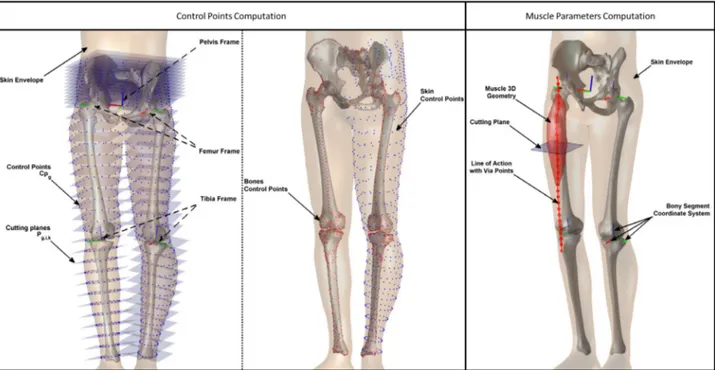
In order to fit the reference model to the subject-specific bone-envelope model, corresponding control points (respectively CPref, CPbe) were identified in both models by following steps (Figure1(a)):
(1) The nodes of each skin envelope were expressed in the local coordinate system of the associated bony segment (Equations (1) and (2)).
Figure 1.(a) Control points CPrefwere equally distributed and computed by cutting skin envelope with planes Pref,i,j,kdefined in each bony region. (b) Muscles were cut by planes Pref,i,j,kto evaluate muscle parameters: points, length and cross sectional area.
SEg Loc,i = HM−1ref,i· SEref (1) SEbe Loc,i = HM−1be,i· SEbe (2)
(2) Local controls points (CPg Loc,i, CPbe Loc,i) were defined on both models for each bony segment: (a) j planes were equally distributed along the
length of the bony segment: Pref,i,j and Pbe,i,j, withj = 1 . . . 12 plane number.
(b) contours were computed at the intersection between the planes Pref,i,j (respectively Pbe,i,j)
and the mesh of the skin envelope SEg Loc,i
(respectively SEbe,i,j).
(c) on each contour a cubic spline was computed by interpolation of k equally distributed con-trol points CPg Loc,i,j,kand CPbe Loc,i,j,k.
(3) the local control points CPg Loc,i,j,kand CPbe Loc,i,j,k were expressed in the global coordinate system to get the final control points CPrefand CPbe (Equa-tions (3) and (4)). ⎡ ⎢ ⎢ ⎣ Xref,i Yref,i Zref,i 1 ⎤ ⎥ ⎥ ⎦ = HMref,i· ⎡ ⎢ ⎢ ⎣ Xg Loc,i,j,k Yg Loc,i,j,k Zg Loc,i,j,k 1 ⎤ ⎥ ⎥ ⎦ (3) ⎡ ⎢ ⎢ ⎣ Xbe,i Ybe,i Zbe,i 1 ⎤ ⎥ ⎥ ⎦ = HMref,i· ⎡ ⎢ ⎢ ⎣ Xbe Loc,i,j,k Ybe Loc,i,j,k Zbe Loc,i,j,k 1 ⎤ ⎥ ⎥ ⎦ (4)
Moreover, in order to control the bone shape, 200 control points were added for each bone based on the node of the WRML models. Thus, a total of 2200 control points was defined.
(4) A Non-linear kriging transformation was applied to each muscle from CPrefto CPbe(Trochu 1993) to deform muscles of the reference model to match the subject-specific bone-envelope model. Thus, an estimation of the muscle shapes of the sub-ject was obtained resulting in a subsub-ject-specific musculo-skeletal model of the lower limb in the standing position.
2.3. Method evaluation
Subjects described by Hausselle et al.(2012) were used: four male volunteers with no documented muscular pathology, gave their written consent to participate in this protocol which was approved by the Institutional Ethics Committee (CPP 06036, Paris, France).
The main muscles of the lower limb were considered and divided into three groups:
• pelvic muscles: Gluteus Maximus (GlMa), Gluteus Medius (GlMe), Gluteus Minimus (GlMi) and Iliacus (Ilc).
• thigh muscles: Adductor Brevis (AddB), Adductor Longus (AddL), Adductor Magnus (AddM), Biceps Femoris Long head (BFL), Biceps Femoris Short head (BFS), Gracilis (Gra), Rectus Femoris (RF),
Table 1. Mean and SD of estimated volume and its difference (Ve ), estimated muscle length and its difference (ML % ), via points d istance (Dist), MA and its difference (Hip MA e and Knee MA e ) and maximum cross section area and its difference (CSA e,max ) between estimated muscles and their reference. Volume Length D istance Hip MA Knee MA Cross section area Value Ve Value ML e Dist Value MA e Value MA e Value CSA e (cm 3) (%) (mm) (%) (mm) (mm) (%) (mm) (%) (cm 2)( % ) Muscle Mean SD Bias SD Mean SD Bias SD Mean SD Mean SD Bias SD Mean SD Bias SD Mean SD Bias SD Pelvis G lMa 1090 340 4 22 213 18 2 6 8 4 66 6 0 9 72 20 5 20 GlMe 353 148 9 41 202 18 3 7 10 3 37 5 6 24 41 17 12 43 GlMi 81 24 13 48 182 12 − 2 1 29 4 3 75 6 2 4 1 33 7 2 9 Ilc 149 48 19 63 226 9 0 6 11 6 28 11 21 77 15 4 7 33 Thigh AddB 170 38 9 48 235 7 1 3 15 6 77 11 1 27 16 3 2 34 AddL 129 78 − 24 55 234 10 − 1 5 21 11 77 11 1 27 12 6 − 23 38 AddM 658 102 7 10 274 6 0 3 7 2 85 2 − 1 3 43 11 9 26 BFL 161 54 16 68 466 6 1 1 15 8 70 3 0 0 48 4 1 4 10 3 6 45 BFS 138 33 0 31 461 2 0 1 18 6 48 4 1 4 11 2 2 28 Gra 87 21 5 29 473 10 0 3 16 14 87 3 − 2 9 20 7 4 46 5 1 16 41 RF 320 117 1 31 566 6 0 1 6 3 47 4 1 8 53 8 1 5 17 6 0 29 Sar 140 28 2 17 667 17 1 2 8 2 68 9 3 10 40 5 4 9 4 1 3 19 Smem 168 65 10 64 457 8 0 1 9 3 61 2 0 0 28 4 − 81 5 1 0 3 3 4 8 Sten 233 76 3 33 522 8 0 1 9 3 74 3 0 1 15 4 20 44 12 5 10 47 TFL 50 20 5 26 590 15 0 1 7 2 56 9 1 10 48 3 0 1 5 2 8 24 VI 356 78 1 10 443 5 0 0 7 2 47 6 3 6 18 5 2 17 VL 999 285 2 29 430 5 0 1 6 2 47 6 3 6 42 12 2 30 VM 656 261 15 60 415 5 0 2 11 4 39 7 − 10 13 32 10 8 36 Calf GL 187 47 − 6 18 480 13 0 2 18 13 27 6 7 35 13 3 − 12 2 GM 169 60 13 40 480 14 1 3 23 18 24 3 4 17 12 4 9 22 Sol 508 161 11 46 376 8 0 2 8 2 33 10 10 44
Sartorius (Sar), Semimembranous (Smem), Semitendinous (Sten), Tensor Fascia Latae (TFL), Vastus Intermedialis (VI), Vastus Lateralis (VL) and Vastus Medialis (VM).
• calf muscles: Grastrocnemius Lateralis (GL), Grastrocnemius Medialis (GM) and Soleus (Sol). The subject-specific musculo-skeletal model in the standing position of each subject was reconstructed using the method described in Section2.3. One by one, each reference model was used to estimate the muscle shape of the other three. Thus, 4 × 3 = 12 estimated models were constructed. The estimated muscle shapes were compared to their reference.
2.4. Parameters studied
To evaluate the accuracy of the method, the estimated muscles were compared to their references. The bias (mean) and the reliability (SD) were used to evaluate the difference of the 24 estimated muscles for the following parameters (Figure1(b)):
• Volume.
• Maximum Cross Sectional Area (CSA): each muscle was sectioned on 50 planes equally spaced along the length of the muscle and the maximum CSA was retained.
• Muscle length: a Line of Action (LoA) was defined as a spline of 50 via points from the origin to the insertion points passing through the center of each cross section. The muscle length was computed as the sum of the distance between via points.
• Distance between via points: RMS of the distance between corresponding via points of both models. • MA: the distance between the LoA and the joint
centers. The center of the hip joint was defined as the center of the sphere fitting the femoral head and the center of the knee joint was defined as the middle of the centers of the spheres fitting the posterior part of the condyles.
3. Results
3.1. Evaluation of the method
Bias (Table1) Most muscle volumes were overestimated with a bias between 0 and 19%, except for the gastrocne-mius lateralis (−6%) and the adductor longus (−24%). Muscle length was estimated with a bias of between−1 and 3%. The MA of the hip joint was over estimated for the iliacus with a bias of 21%; however the biais was between −2 and 6% for the other muscles. For most muscles, the MA in knee joint was estimated with a bias of between −10 and 7%, except for the Semitendinous
(20%). Most muscles had an over-estimated CSA, which was positive up to 16%, except for the gastrocnemius lateralis (−1%) and the adductor longus (−23%).
Standard Deviation (SD) (Table1) The muscle volume SD ranged from 10% for the vastus indermedialis to 68% for the biceps femoris long head. The muscle length SD was lower than 12% for all muscles. The SD of MA in hip joint ranged from 1% for the semitendinous to 77% for the iliacus. The SD of the MA in knee joint ranged from 1% for the tensor fascia latae to 46% for the semitendinous. The SD of the CSA ranged from 15% for the adductor magnus and 183% for the adductor longus.
The Rmusculo-skeletal of the via point distances ranged from 6± 2 mm for the vastus intermedialis to 23 ± 18 mm for the gastrocnemius medialis (Table1). Most muscles were estimated with a mean lower than 15 mm.
4. Discussion
This study proposed an original method to quickly access a subject-specific musculo-skeletal model of the lower limb in the standing position based on low-dose bipla-nar X-Ray. The reconstruction time was about 30 min vs. about 2.5 h with an MRI based method combining MRI and X-Ray to obtain a subject-specific MS model in the standing position (Hausselle et al. 2012). Bones and skin envelopes were subject-specific, origin and insertion points were estimated and muscle shapes were computed from reference model deformation.
This original method produced an accurate estima-tion of muscle LoA. Indeed, the LoA of thigh and calf muscles were well estimated with a SD of the muscle length lower than 5%. Muscles were also well positioned with the RMS of the via point distances under 20 mm for the majority of the muscle. The gluteus muscles were more difficult to estimate because they are superficial, thin and short; thus, the LoA was more influenced by the deformation, especially the muscle length error in percent. Otherwise, only a single LoA was considered here, while Arnold et al. (2006), Martelli et al. (2013) had decomposed them in several bodies. This choice was made in order to simplify the comparison between models. Calf muscle error was mainly due to the inser-tion posiinser-tion, which was estimated, because the Achilles tendon position was unknown. Despite that, results were better than those provided using a scaled-generic model. Indeed,Scheys et al.(2008) reported a length difference of around 20% between the reference and personalized models.
The MA was also well estimated with a SD lower than 15% for most muscles compared to Scheys et al. (2006) andScheys et al.(2008), which shows a difference
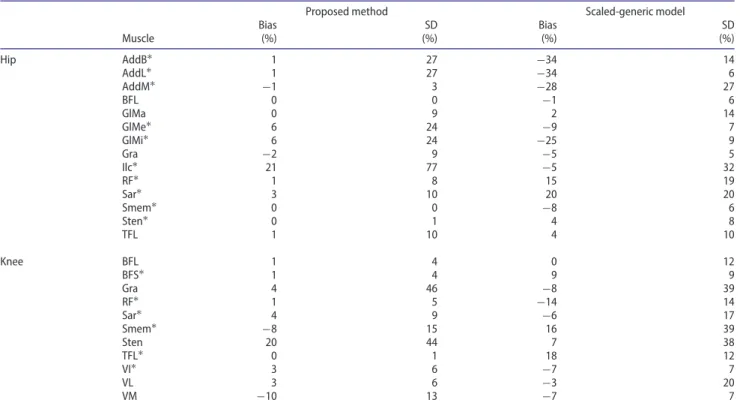
Table 2.MAs in hip and knee joints computed for the proposed method and generic-scaled model compared to the method proposed byHausselle et al.(2012).
Proposed method Scaled-generic model
Bias SD Bias SD Muscle (%) (%) (%) (%) Hip AddB∗ 1 27 −34 14 AddL∗ 1 27 −34 6 AddM∗ −1 3 −28 27 BFL 0 0 −1 6 GlMa 0 9 2 14 GlMe∗ 6 24 −9 7 GlMi∗ 6 24 −25 9 Gra −2 9 −5 5 Ilc∗ 21 77 −5 32 RF∗ 1 8 15 19 Sar∗ 3 10 20 20 Smem∗ 0 0 −8 6 Sten∗ 0 1 4 8 TFL 1 10 4 10 Knee BFL 1 4 0 12 BFS∗ 1 4 9 9 Gra 4 46 −8 39 RF∗ 1 5 −14 14 Sar∗ 4 9 −6 17 Smem∗ −8 15 16 39 Sten 20 44 7 38 TFL∗ 0 1 18 12 VI∗ 3 6 −7 7 VL 3 6 −3 20 VM −10 13 −7 7
∗indicates a lower significant difference between proposed method and generic-scaled model (p < 0.05).
between the reference and personalized models of over 20% for most muscles and up to 100% for some muscles. For most muscles, the use of a reference model including a tendon pathway could better predict MA. Indeed, a tendon pathway was estimated between the belly part ends and the insertion point by a spline, which could be different to the real one. The tendon pathway could not segmented due to the lack of visibility on MRI for some muscles.
The presented model must be compared with the scaled-generic model. Table2summarizes the difference of the MA in hip and knee joints computed for the pre-sented study and for the scaled-generic model compared to the reference model (Hausselle et al. 2012). The pro-posed method significantly increased the accuracy of MA computation for Adductors, GlMe, GlMi, RF, Sar, Smem in the hip joint and BFS, RF, Sar, Smem, TFL in the knee joint.
The muscle volume was less accurately estimated. The non-linear deformation from the reference model to the subject-specific musculo-skeletal model allowed an esti-mate of muscle belly in the transverse plane. The indi-vidual height variability of muscle belly length was not accurately estimated. Thus, CSA was better estimated than muscle volume (p < 0.03). The proposed method had not taken into account subject fat thickness, this was the main limitation. The closer the fat thickness is to
the reference model, the more accurate the estimation is.
The choice of the reference model will affect the es-timation of the muscle shape: if the reference model is close to the subject, the estimation may be more accu-rate. Generally, the reference model could be an average subject of a large database in order to cover the largest morphology range. In our case, we only have a database of four subjects and by considering each one as the reference model to estimate the other three, the sensitivity of the reference model was investigated.
The main limitation was the number of subjects. An increase of the database would increase the relevance of the estimation. However, the first presented results highlighted the good potential of the method. A fur-ther large scale study, which includes information on fat thickness and gait analysis, will be performed, this should yield an improvement of the database and of the estimation.
This study proposed a fast method for subject-specific skeletal modeling of the lower limb in the standing posi-tion, with a good estimation of the muscle line of action. The bones and skin envelope were subject-specific and most muscle parameters were more accurately estimated than with scaling. This method open the way to a quick modeling method for gait analysis based on biplanar radiography.
Acknowledgements
The authors wish to thank Lee-Anne Welgemoed for the English correction.
Disclosure statement
The authors do not have any conflicting financial interests.
References
Arnold AS, Liu MQ, Schwartz MH, Ounpuu S, Delp SL.2006. The role of estimating muscle-tendon lengths and velocities of the hamstrings in the evaluation and treatment of crouch gait. Gait Posture. 23:273–281.
Baudoin A, Skalli W, de Guise JA, Mitton D.2008. Parametric subject-specific model for in vivo 3D reconstruction using bi-planar X-rays: Application to the upper femoral extremity. Med Biol Eng Comput. 46:799–805.
Chaibi Y, Cresson T, Aubert B, Hausselle J, Neyret P, Hauger O, de Guise JA, Skalli W.2012. Fast 3D reconstruction of the lower limb using a parametric model and statistical inferences and clinical measurements calculation from biplanar X-rays. Comput Methods Biomech Biomed Eng. 15:457–466. Correa TA, Baker R, Graham HK, Pandy MG.2011. Accuracy of
generic musculoskeletal models in predicting the functional roles of muscles in human gait. J Biomech. 44:2096–2105. Delp SL, Loan JP.1995. A graphics-based software system to
develop and analyze models of musculoskeletal structures. Comput Biol Med. 25:21–34.
Delp SL, Ringwelski DA, Carroll NC. 1994. Transfer of the rectus femoris: effects of transfer site on moment arms about the knee and hip. J Biomech. 27:1201–1211.
Dubousset J, Charpak G, Dorion I, Skalli W, Lavaste F, Deguise J, Kalifa G, Ferey S.2005. A new 2D and 3D imaging approach to musculoskeletal physiology and pathology with low-dose radiation and the standing position: The EOS system. Bulletin de l’Académie nationale de médecine. 189:287–300.
Hausselle J, Assi A, El Helou A, Jolivet E, Pillet H, Dion E, Bonneau D, Skalli W .2012. Subject-specific musculoskeletal model of the lower limb in a lying and standing position. Biomed Eng: Comput Methods Biomech. 17:480–487. Hicks J, Arnold A, Anderson F, Schwartz M, Delp S.2007. The
effect of excessive tibial torsion on the capacity of muscles to extend the hip and knee during single-limb stance. Gait Posture. 26:546–552.
Jolivet E, Daguet E, Pomero V, Bonneau D, Laredo JD, Skalli W.
2008. Volumic patient-specific reconstruction of muscular system based on a reduced dataset of medical images. Comput Methods Biomech Biomed Eng. 11:281–290.
Jolivet E, Dion E, Rouch P, Dubois G, Charrier R, Payan C, Skalli W. 2014. Skeletal muscle segmentation from MRI dataset using a model-based approach. Comput Methods Biomech Biomed Eng: Imaging Visual. 2:138–145.
Kia M, Stylianou AP, Guess TM. 2014. Evaluation of a musculoskeletal model with prosthetic knee through six experimental gait trials. Med Eng Phys. 36:335–344. Lenaerts G, Bartels W, Gelaude F, Mulier M, Spaepen A, Van
der Perre G, Jonkers I.2009. Subject-specific hip geometry and hip joint center location affects calculated contact forces at the hip during gait. J Biomech. 42:1246–1251.
Martelli S, Calvetti D, Somersalo E, Viceconti M, Taddei F. 2013. Computational tools for calculating alternative muscle force patterns during motion: A comparison of possible solutions. J Biomech. 46:2097–2100.
Nérot A, Choisne J, Amabile C, Travert C, Pillet H, Wang X, Skalli W. 2015. A 3D reconstruction method of the body envelope from biplanar X-rays: Evaluation of its accuracy and reliability. J Biomech. 48:4322–4326.
Nordez A, Jolivet E, Südhoff I, Bonneau D, de Guise JA, Skalli W.2009. Comparison of methods to assess quadriceps muscle volume using magnetic resonance imaging. J Magn Reson Imaging. 30:1116–1123.
Pillet H, Bonnet X, Lavaste F, Skalli W.2010. Evaluation of force plate-less estimation of the trajectory of the center of pressure during gait. Comparison of two anthropometric models. Gait Posture. 31:147–152.
Quijano S, Serrurier A, Aubert B, Laporte S, Thoreux P, Skalli W. 2013. Three-dimensional reconstruction of the lower limb from biplanar calibrated radiographs. Med Eng Phys. 35:1703–1712.
Rezgui T, Megrot F, Marin F. 2013. Musculoskeletal modelling of cerebral palsy children: sensitivity analysis of musculoskeletal model parameter’s values for gait analysis. Comput Methods Biomech Biomed Eng. 16(sup1):155–157. Scheys L, Desloovere K, Spaepen A, Suetens P, Jonkers I.
2011. Calculating gait kinematics using MR-based kinematic models. Gait Posture. 33:158–164.
Scheys L, Jonkers I, Loeckx D, Maes F, Spaepen A, Suetens P.2006. Biomedical simulation. Lecture notes in computer science, Vol. 4072, Springer: Berlin Heidelberg.
Scheys L, Van Campenhout A, Spaepen A, Suetens P, Jonkers I. 2008. Personalized MR-based musculoskeletal models compared to rescaled generic models in the presence of increased femoral anteversion: Effect on hip moment arm lengths. Gait Posture. 28:358–365.
Trochu F.1993. A contouring program based on dual kriging interpolation. Eng Comput. 9:160–177.
Wesseling M, de Groote F, Jonkers I. 2014. The effect of perturbing body segment parameters on calculated joint moments and muscle forces during gait. J Biomech. 47: 596–601.