COMPARAISON DE L’ACCROISSEMENT LIGNEUX
ENTRE L’ÉCLAIRCIE COMMERCIALE PAR
DÉGAGEMENT D’ARBRES-ÉLITES ET L’ÉCLAIRCIE PAR
LE BAS
Mémoire présenté
dans le cadre du programme de maîtrise en gestion de la faune et de ses habitats en vue de l’obtention du grade de maître ès sciences
PAR
© Laurie Dupont-Leduc
iii
Composition du jury :
Dominique Arseneault, président du jury, Université du Québec à Rimouski Robert Schneider, directeur de recherche, Université du Québec à Rimouski Luc Sirois, codirecteur de recherche, Université du Québec à Rimouski Jean-Claude Ruel, examinateur externe, Université Laval
v
UNIVERSITÉ DU QUÉBEC À RIMOUSKI Service de la bibliothèque
Avertissement
La diffusion de ce mémoire ou de cette thèse se fait dans le respect des droits de son auteur, qui a signé le formulaire « Autorisation de reproduire et de diffuser un rapport, un mémoire ou une thèse ». En signant ce formulaire, l’auteur concède à l’Université du Québec à Rimouski une licence non exclusive d’utilisation et de publication de la totalité ou d’une partie importante de son travail de recherche pour des fins pédagogiques et non commerciales. Plus précisément, l’auteur autorise l’Université du Québec à Rimouski à reproduire, diffuser, prêter, distribuer ou vendre des copies de son travail de recherche à des fins non commerciales sur quelque support que ce soit, y compris l’Internet. Cette licence et cette autorisation n’entraînent pas une renonciation de la part de l’auteur à ses droits moraux ni à ses droits de propriété intellectuelle. Sauf entente contraire, l’auteur conserve la liberté de diffuser et de commercialiser ou non ce travail dont il possède un exemplaire.
vii
REMERCIEMENTS
Mes premiers remerciements vont à mon directeur de recherche, Robert Schneider. Merci pour la confiance que tu m’as accordée depuis le tout début de mon travail pour la Chaire de recherche. Ta disponibilité, tes conseils et tes schémas m’ont grandement aidé tout au long de mon parcours. La route vers le côté obscur est parfois difficile, mais tu me pousses à me dépasser, même lorsque je doute et cela contribue à ma progression, autant d’un point de vue professionnel que personnel. J’espère que notre collaboration sera encore aussi bonne dans le futur, du moins encore pour quelques années !
Merci à Luc Sirois, mon codirecteur, pour ta disponibilité, pour les discussions et la critique très constructive de mes travaux. Tes commentaires m’ont toujours fortement aidé, et ce, depuis le tout début de mon parcours à l’UQAR. Ton enseignement au bac a contribué à me faire avancer et m’a donné envie de poursuivre dans le domaine de l’écologie forestière. Toi aussi tu m’as fait confiance pour ce projet et je t’en suis très reconnaissante.
Un gros merci à mes assistant(e)s de recherche, David Grenier-Héon et Sophie Proudfoot. Vous avez tenu bon tout le long de cette campagne de terrain. Les longues heures de travail, les mouches, les 8 000 carottes extraites et tout autant de mesures n’ont jamais entravé votre enthousiasme, votre rigueur au travail et votre capacité à me faire rire. Cet été restera gravé dans ma mémoire. Gracias !
Je tiens aussi à remercier tous les assistant(e)s de recherche qui ont travaillé avec minutie en laboratoire sur ma collection de carottes d’arbres études. Merci à : Aurélie Chagnon-Lafortune, Bérengère Curtit, François Douville, Frédéric Dwyer-Samuel, Jérôme Lavoie, Marc Lepage, Vincent Roy, Anthony Schmutz et Agathe Valette. Votre travail a été vraiment apprécié !
J’aimerais aussi remercier mes collègues du laboratoire en aménagement et sylviculture. Tout particulièrement, Tony Franceschini et Emmanuel Duchateau pour l’aide lors de différentes étapes de mes analyses statistiques. Merci à l’ensemble du laboratoire pour le soutien, les discussions et les critiques toujours constructives et pertinentes à différent
moment de mes travaux de recherche. Merci également à Alain Caron, auxiliaire d’enseignement et de recherche au département de biologie, chimie et géographie à l’UQAR pour les conseils lors de mes analyses statistiques.
Le projet n’aurait pu voir le jour sans l’implication de Luc Lavoie et de Laurent Gagné de la CRÉBSL (maintenant CRD-BSL). Votre aide lors de la mise sur pied du projet et le début de la campagne de terrain a été très appréciée.
Ce projet de recherche n’aurait pu être possible sans la contribution financière de la Chaire de Recherche sur la Forêt Habitée, de la CRÉBSL (maintenant CRD-BSL), du Fonds Québécois de Recherche sur la Nature et les Technologies, de la Fondation de l’UQAR et du Centre d’étude de la forêt.
D’un côté personnel, merci à ma famille, mes amis et à tous ceux qui se sont intéressés et ont contribué de près ou de loin au projet. Plus particulièrement, je veux remercier mes parents pour l’appui et l’amour inconditionnel que vous m’avez offerts lorsque j’ai eu l’idée de poursuivre mes études à 500 kilomètres de la maison. Merci pour le soutien que vous me donnez depuis que je suis petite dans toutes mes activités, mes projets, mes folies ! C’est en grande partie grâce à vous que je suis rendue où je suis aujourd’hui. C’est tellement réconfortant de savoir que vous êtes là, derrière moi, peu importe ce qui arrivera. Merci maman pour ta douceur et ton écoute. Merci papa pour tes encouragements et de m’avoir répété 100 fois que si c’était facile, tout le monde le ferait !
Finalement, ce grand périple n’aurait pas été le même si je n’avais pas eu à mes côtés mon amoureux, mon concubin, mon chiquito, Pierre-André ! Tu m’as donné de ton temps, de ta patience, de ta compréhension dans les bons et les moins bons moments. Mes sautes d’humeur ont été monnaie courante pendant ces quelques années, mais tu m’as soutenu et réconforté avec main de maître (et avec quelques sacs de bonbons). Tu m’as offert un équilibre dans toutes les épreuves à surmonter, ça n’aurait tout simplement pas été possible sans toi ! Je ne te remercierai jamais assez.
xi
RÉSUMÉ
Depuis plusieurs décennies, l’exploitation forestière a entraîné d’importantes modifications dans la composition et la structure des forêts du Bas-Saint-Laurent, transformant le paysage en une mosaïque de peuplements réguliers/équiennes. En 2008, une expérience d’éclaircies commerciales, consistant au dégagement de compétiteurs autour d’arbres-élites (AÉ) a été initiée comme première étape de la conversion structurale de ces peuplements réguliers/équiennes vers des peuplements irréguliers/inéquiennes. Ce type d’éclaircie, qui a pour objectif d’accentuer la complexité structurale des peuplements, a récemment été proposé afin de répondre aux exigences de la Loi québécoise sur l’aménagement durable du territoire forestier. Deux types d’éclaircie par AÉ (dégagement de 50 AÉ/ha et 100 AÉ/ha) ainsi qu’une éclaircie par le bas et des blocs témoins ont été implantés dans des plantations d’épinette blanche (Picea glauca) et dans des peuplements issus de régénération naturelle dominés par le sapin baumier (Abies balsamea). En 2014, les placettes-échantillons ont été mesurées pour quantifier l’accroissement ligneux et la diversité structurale. Aucune différence en accroissement en surface terrière n’a été observée entre les traitements. À l’échelle de l’arbre, les AÉ dégagés par l’éclaircie ont montré un accroissement en diamètre à hauteur de poitrine (DHP) significativement plus élevé que les AÉ potentiels dans les placettes-échantillons témoins. Les AÉ ont également eu un accroissement en DHP plus élevé que leurs voisins les plus proches, en plus de faire face à moins de compétition que les AÉ potentiels dans les blocs éclaircis par le bas et les blocs témoins. La complexité des parcelles n’a cependant pas augmenté de façon significative après les éclaircies, le nombre d’AÉ dégagé n’étant probablement pas assez élevé pour changer la structure du peuplement avec une seule éclaircie. Ces résultats indiquent que le temps entre le traitement et l’inventaire forestier (5 ans après traitement) n’est pas suffisant pour que les arbres dépassent leur temps de réaction et atteignent leur pic de croissance. Des interventions subséquentes seront nécessaires pour atteindre les objectifs de diminution d’écart entre la forêt naturelle et la forêt aménagée.
Mots-clés : aménagement écosystémique, complexité spatiale, conversion structurale, éclaircie commerciale par dégagement d’arbres-élites, éclaircie commerciale par le bas
xiii
ABSTRACT
For decades, logging has led to significant changes in composition and structure of the forests of Eastern Canada. In 2008, a commercial thinning trial consisting in the removal of competitors around elite trees (ET) was initiated as the first step of a structural conversion treatment to transform regular/even-aged stands to irregular/uneven-aged stands. Two intensities of thinning by ET release (50 ET/ha and 100 ET/ha) as well as a thinning from below and control blocks were tested in white spruce (Picea glauca) plantations and precommercially thinned balsam fir (Abies balsamea) dominated natural regeneration stands. In 2014, we measured these experimental plots for growth increment and stand structural diversity. At the stand level, no differences were observed amongst the treatments for average cumulative basal area increment since thinning. At the tree level, trees thinned by ET release showed a significantly higher diameter at breast height (DBH) increment than those in the control plots. The released ET also had higher DBH increments than their closest neighbors. The released ET had less competition than the potential ET in both the control and thinned from below plots. The spatial complexity of the plots did not however significantly increase after ET release, the number of ET released is probably not high enough to change the stand structure after only one thinning treatment. These results indicate that 5 years after treatment is not sufficient for trees to reach their peak growth. Further interventions are thus needed to reach the ecosystem-based forest management objectives.
Key words: commercial thinning by elite tree release, ecosystem-based forest management, structural conversion, spatial complexity, stand structure, thinning from below
xv
TABLE DES MATIÈRES
REMERCIEMENTS ... VII RÉSUMÉ ... XI ABSTRACT ...XIII TABLE DES MATIÈRES ... XV LISTE DES TABLEAUX ... XVII LISTE DES FIGURES ... XIX LISTE DES ABRÉVIATIONS, DES SIGLES ET DES ACRONYMES ... XXI
CHAPITRE 1 : INTRODUCTION GÉNÉRALE ... 1
MISE EN CONTEXTE ... 1
Revue de littérature ... 2
Objectifs et hypothèses ... 8
CHAPITRE 2: INCREASING THE STRUCTURAL COMPLEXITY OF CONIFEROUS STANDS WITHOUT REDUCING THEIR PRODUCTIVITY: A CASE STUDY IN EASTERN CANADA ... 10
ABSTRACT ... 10
INTRODUCTION ... 11
MATERIALS AND METHODS ... 14
STUDY AREA ... 14 EXPERIMENTAL DESIGN ... 14 DATA COLLECTION ... 16 STATISTICAL ANALYSIS ... 20 RESULTS ... 24 DISCUSSION ... 34 TREE LEVEL ... 34 STAND LEVEL ... 35 STRUCTURE ... 37
CONCLUSION ... 41
APPENDIX ... 42
CHAPITRE 3 : CONCLUSION GÉNÉRALE ET IMPLICATIONS DE L’ÉTUDE ... 43
xvii
LISTE DES TABLEAUX
TABLE 1 :AVERAGE STAND CHARACTERISTICS (STANDARD DEVIATION IN PARENTHESES). ... 17 TABLE 2 :F-VALUES (P-VALUES IN PARENTHESES) FOR THE ANALYSIS OF VARIANCE, AT STAND LEVEL (EQ.2A), ON AVERAGE INCREASE
IN BA(M2/HA/YEAR) BETWEEN THE TIME OF THINNING AND FIVE YEARS LATER (2008-2013) FOR CONTROL, THINNED FROM BELOW, THINNED BY ET RELEASE (50 ET/HA AND 100 ET/HA) PERMANENT PLOTS IN WHITE SPRUCE PLANTATIONS AND NATURALLY REGENERATED SOFTWOOD STANDS WITH BA(M2/HA) BEFORE THINNING AS COVARIABLE (BOLD: SIGNIFICANT
[P < 0.05]). ... 24 TABLE 3 :F-VALUES (P-VALUES IN PARENTHESES) FOR THE ANALYSIS OF VARIANCE, AT TREE LEVEL (EQ.2B), ON DBH INCREMENT,
ACCORDING TO THE SILVICULTURAL TREATMENTS AND TREE STATUS (ET OR COMPETITORS)(BOLD: SIGNIFICANT [P < 0.05]). ... 26 TABLE 4 :F-VALUES (P-VALUES IN PARENTHESES) FOR THE ANALYSIS OF VARIANCE, AT TREE LEVEL, ON HEGYI COMPETITION INDEX
(H)(EQ.1; EQ.2A)(BOLD: SIGNIFICANT [P < 0.05]). ... 28 TABLE 5 :T-VALUES (P-VALUES IN PARENTHESES) FOR THE LINEAR REGRESSION MODELS (EQ.3) BETWEEN DBH INCREMENT AND
DISTANCE TO THE CLOSEST SKID TRAIL FOR THE WHITE SPRUCE PLANTATIONS (LECHASSEUR AND HUMQUI SITES), WITH ONE REGRESSION PER THINNING METHOD (BOLD: SIGNIFICANT [P < 0.05]). ... 30 TABLE 6 :F-VALUES (P-VALUES IN PARENTHESES) FOR THE ANALYSIS OF VARIANCE, AT STAND LEVEL (EQ.2A), ON THE CLARK-EVANS
AGGREGATION INDEX (R) IN 2014(BOLD: SIGNIFICANT [P < 0.05]). ... 31 TABLE 7 :F-VALUES (P VALUES IN PARENTHESES) FOR THE ANALYSIS OF VARIANCE (EQ.4) ON THE SHAPE (SP) AND SCALE (SC) PARAMETERS OF THE TWO-PARAMETER WEIBULL PROBABILITY DENSITY FUNCTION BEFORE THINNING, AFTER THINNING
(2008) AND FIVE YEARS AFTER THINNING (2013) FOR CONTROL, THINNED FROM BELOW AND THINNED BY ET RELEASE
xix
LISTE DES FIGURES
FIGURE 1 :STUDY AREA (A) IN BAS-SAINT-LAURENT,QUÉBEC,(B) EXPERIMENTAL UNITS WITHIN A BLOCK WHERE THE SILVICULTURAL TREATMENTS WERE APPLIED AND (C) AN EXPERIMENTAL UNIT DIVIDED IN 3 SUBUNITS (GAP OF 0,01 HA,0,05 HA AND NO
GAP). ... 18
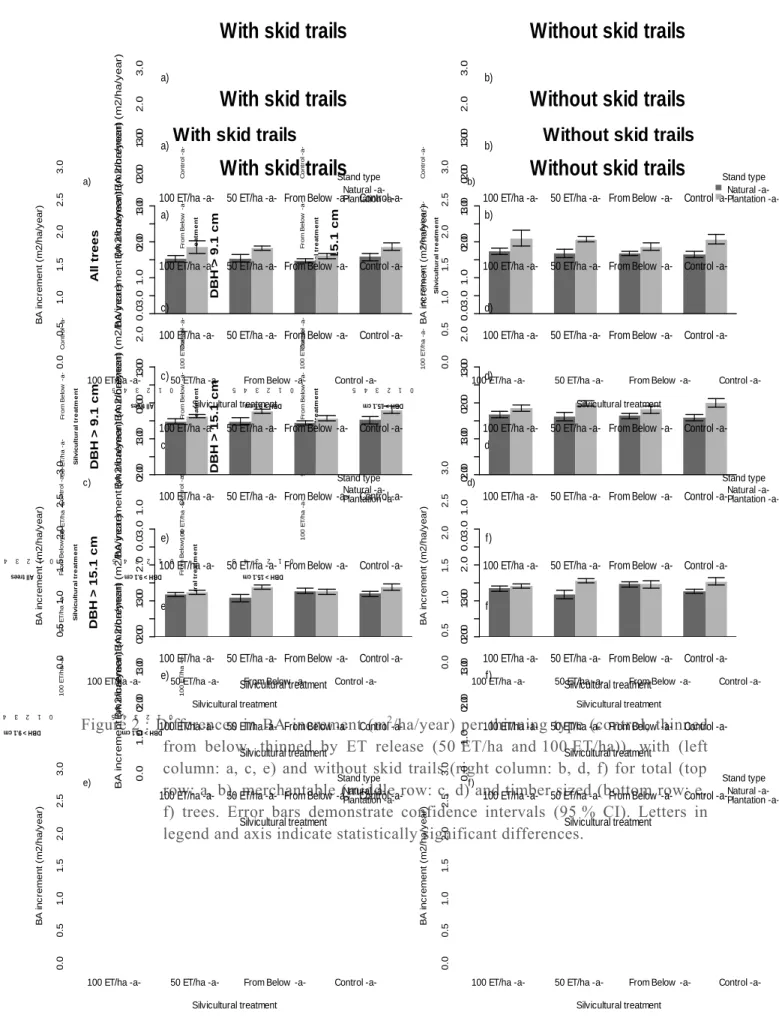
FIGURE 2 :DIFFERENCES IN BA INCREMENT (M2/HA/YEAR) PER THINNING TYPE (CONTROL, THINNED FROM BELOW, THINNED BY ET RELEASE (50 ET/HA AND 100 ET/HA)), WITH (LEFT COLUMN: A, C, E) AND WITHOUT SKID TRAILS (RIGHT COLUMN: B, D, F)
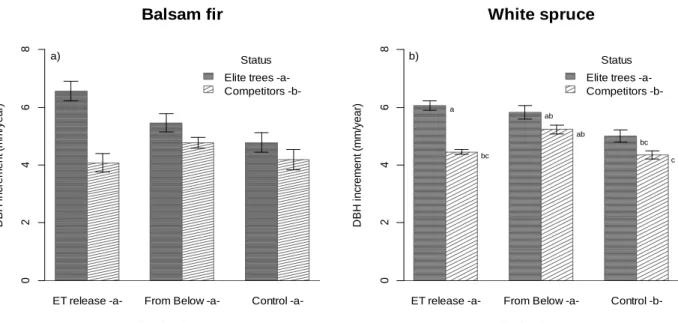
FOR TOTAL (TOP ROW: A, B), MERCHANTABLE (MIDDLE ROW: C, D) AND TIMBER SIZED (BOTTOM ROW: E, F) TREES.ERROR BARS DEMONSTRATE CONFIDENCE INTERVALS (95 %CI).LETTERS IN LEGEND AND AXIS INDICATE STATISTICALLY SIGNIFICANT DIFFERENCES. ... 25 FIGURE 3 :DBH INCREMENT (MM/YEAR), BETWEEN 2008 AND 2013, FOR BALSAM FIR (A) AND WHITE SPRUCE (B) BY THINNING
INTENSITY (CONTROL, THINNED FROM BELOW, THINNED BY ET RELEASE (50 ET/HA AND 100 ET/HA)) AND TREE TYPE (ET OR COMPETITOR OF ET).ERROR BARS DEMONSTRATE CONFIDENCE INTERVALS (95 %CI).LETTERS IN LEGEND, AXIS OR IN THE PLOT INDICATE STATISTICALLY SIGNIFICANT DIFFERENCES. ... 27 FIGURE 4 :HEGYI COMPETITION INDEX (H) FOR ET BY THINNING METHOD (CONTROL, THINNED FROM BELOW, THINNED BY ET RELEASE (50 ET/HA AND 100 ET/HA)) AND STAND TYPE.ERROR BARS DEMONSTRATE CONFIDENCE INTERVALS (95 %CI). LETTERS IN LEGEND AND IN AXIS INDICATE STATISTICALLY SIGNIFICANT DIFFERENCES. ... 28
FIGURE 5 :RELATIONSHIP BETWEEN DBH INCREMENT AND DISTANCE TO THE CLOSEST SKID TRAIL BY THINNING METHOD FOR THE WHITE SPRUCE PLANTATIONS (LECHASSEUR AND HUMQUI SITES)(BOLD: SIGNIFICANT [P < 0.05]). ... 29
FIGURE 6 :CLARK-EVANS AGGREGATION INDEX (R) IN 2014 PER THINNING INTENSITY (CONTROL, THINNED FROM BELOW, THINNED BY ET RELEASE (50 ET/HA AND 100 ET/HA)) FOR THE WHITE SPRUCE PLANTATIONS (LECHASSEUR AND HUMQUI SITES).
ERROR BARS DEMONSTRATE CONFIDENCE INTERVALS (95 % CI).LETTERS IN AXIS INDICATE STATISTICALLY SIGNIFICANT DIFFERENCES. ... 31
FIGURE 7 :WEIBULL SCALE (SC) AND SHAPE (SP) PARAMETERS PER THINNING METHOD (CONTROL, THINNED FROM BELOW AND THINNED BY ET RELEASE (100 T/HA AND 50 ET/HA)) AND STAND TYPE (PLANTATION, NATURAL REGENERATION) PRIOR TO THINNING, AFTER THINNING AND FIVE YEARS AFTER THINNING (2013).ERROR BARS DEMONSTRATE CONFIDENCE INTERVALS
xxi
LISTE DES ABRÉVIATIONS, DES SIGLES ET DES ACRONYMES
AÉ Arbres élites
AFÉ Aménagements forestiers écosystémiques BA Basal area
DBH Diameter at breast height
ddf Denumenator degrees of freedom DHP Diamètre à hauteur de poitrine DHS Diameter at stump height ET Elite tree
H Hegyi competition index ndf Numerator degrees of freedom R Clark-Evans aggregation index
SC Scale parameter of the two-parameter Weibull density probability function SH Stump height
CHAPITRE 1 : INTRODUCTION GÉNÉRALE Mise en contexte
Dans l’est du Canada, l’exploitation forestière du 20e siècle a entrainé d’importantes modifications dans la composition et la structure des forêts, transformant ainsi le paysage forestier en une mosaïque de peuplements réguliers/équiennes. Cette exploitation a rapidement contribué à créer un écart entre les forêts préindustrielles (naturelles), qui étaient principalement irrégulières/inéquiennes, et les forêts aménagées. Ces changements ont de nombreux impacts sur la biodiversité et la productivité des écosystèmes forestiers (Boucher et al., 2009). Afin de répondre aux exigences de la Loi québécoise sur l’aménagement durable du territoire forestier, les aménagements forestiers écosystémiques (AFÉ) visent à maintenir ou restaurer la biodiversité forestière en réduisant les différences observées entre les forêts naturelles et aménagées (MFFP, 2013).
Maintenant que plusieurs dizaines de milliers d’hectares de jeunes forêts sont prêtes à recevoir une première éclaircie commerciale au Bas-Saint-Laurent et dans plusieurs autres régions du Canada, une question se pose : quels sont les traitements sylvicoles les plus appropriés pour diminuer l’écart entre les forêts préindustrielles et les forêts aménagées en augmentant leur complexité structurale, mais sans réduire leur productivité ? C’est dans cette optique qu’en 2008 la Chaire de recherche sur la forêt habitée de l’Université du Québec à Rimouski en collaboration avec la conférence régionale des élus du Bas-Saint-Laurent (CRÉ-BSL), a initié une expérience d’éclaircies commerciales comme première étape de la conversion structurale de jeunes peuplements réguliers/équiennes (d’origine naturelle et de plantation) vers une structure irrégulière/inéquienne. Cette étude vise ainsi à comparer le rendement et la structure de peuplements éclaircis par le bas au rendement et à la structure de ceux éclaircis par dégagement d’arbres élites (AÉ) à l’échelle de l’arbre et du peuplement. Cette comparaison permettra de connaître les effets de l’utilisation de l’éclaircie commerciale par dégagement d’arbres-élites sur le potentiel de croissance des peuplements résiduels, en plus de savoir si ce traitement permet d’accentuer leur complexité structurale.
Revue de littérature
La dynamique des forêts naturelles et aménagées
Dans les écosystèmes forestiers préindustriels, c’étaient les perturbations naturelles (épidémies, feux, chablis, etc. de sévérité variable) qui amorçaient le processus de la succession écologique en créant des ouvertures partielles dans la canopée (Harvey et al., 2002; Messier et al., 1999; Bergès et al., 2002), avec comme mécanisme principal la différence interspécifique de tolérance à l’ombre (Raven et al., 2007). Par conséquent, lorsqu’un chablis ou une épidémie d’insectes créaient des ouvertures partielles dans la canopée, le couvert forestier dominant était recolonisé par des espèces tolérantes à l’ombre qui formaient la régénération préétablie en sous-étage (Messier et al., 1999). Lorsqu’une perturbation détruisait entièrement le peuplement, c’étaient les espèces intolérantes à l’ombre qui colonisaient et croissaient plus rapidement que les espèces tolérantes, pour former le couvert de transition (Kobe and Coates, 1997; Reich et al., 1998; Messier et al., 1999; Martin et al., 2008). Ces dynamiques, en se perpétuant dans le temps, étaient à l’origine de la structure interne hétérogène et irrégulière de la majorité des peuplements, particulièrement dans les forêts tempérées et boréales (Schütz, 1997; Bergeron and Harvey, 1997; Bergeron et al., 2006; Franklin et al., 2007; Ruel et al., 2007).
Dans les forêts aménagées, les interventions sylvicoles constituent actuellement la source principale de perturbation pour le milieu, en accélérant, ralentissant ou réinitialisant la dynamique naturelle des peuplements forestiers (Bergès et al., 2002; Hansen et al., 1991; McCarthy and Burgman, 1995; Niemelä, 1999). Au fil du temps, l’exploitation intensive des forêts a altéré la dynamique naturelle en réduisant l’âge moyen des forêts, diminuant l’abondance de certaines formes de bois mort, favorisant les espèces pionnières et homogénéisant la structure interne des peuplements forestiers (Östlund et al., 1997; Boucher et al., 2006, 2009; Dupuis, 2009).
La forêt aménagée, régime de futaie régulière/équienne
Le régime sylvicole de la futaie régulière/équienne et les peuplements monospécifiques qui y sont associés, peuvent être mis en cause en ce qui a trait à la
3
raréfaction d’un certain nombre d’espèces (Bergès et al., 2002). De plus, l’aménagement forestier a habituellement comme effet de supprimer ou de limiter fortement certains stades de succession, comme les arbres matures après une coupe de régénération, en plus de certains éléments qui structurent l’écosystème, comme le bois mort au sol et les chicots sur pied (Bergès et al., 2002; Hansen et al., 1991). En limitant ces différents éléments de l’écosystème, les espèces qui en dépendent doivent trouver des habitats de substitution (Bergès et al., 2002). Dans le régime de futaie régulière, le traitement qui est depuis longtemps préconisé dans les plantations d’âge intermédiaire au Québec est l’éclaircie commerciale par le bas. Son application consiste à retirer environ une tige sur trois (~35 % de la surface terrière du peuplement) (petites tiges, tiges malades ou déformées) pour favoriser la croissance des meilleures tiges en redistribuant le potentiel de croissance sur les arbres résiduels (Cameron, 2002; Gagné, L., 2009; Lundqvist et al., 2007). Cette étape de l’éclaircie est peu rentable dû à la faible qualité des tiges prélevées (Cameron, 2002; Lundqvist et al., 2007). De plus, en prélevant principalement les petites tiges, on enlève au peuplement une composante structurale importante, puisque ces arbres pourraient être des candidats-chicots de qualité (Schütz, 1997; Gagné, L., 2009). Cette pratique est appropriée dans le contexte de l’aménagement en forêt régulière/équienne, mais elle semble peu compatible avec l’objectif de réduction des écarts entre les forêts aménagées et naturelles (Barrette et al., 2014). Il devient donc primordial d’intégrer de nouvelles pratiques sylvicoles afin de répondre aux exigences des AFÉ.
L’aménagement forestier écosystémique
En visant sur l’aptitude à maintenir la diversité biologique et la viabilité des écosystèmes forestiers, les AFÉ sont au cœur du nouveau régime forestier du Québec. Plus spécifiquement, ils visent à maintenir ou restaurer la biodiversité forestière en réduisant les écarts observés entre la forêt naturelle et la forêt aménagée (MFFP, 2013). En se rapprochant des conditions retrouvées en forêts naturelles, ce concept mise à assurer la survie de la plupart des espèces en leur offrant les conditions auxquelles elles sont adaptées(MFFP, 2013). Les AFÉ ont tout de même des objectifs de récolte et de production de bois, mais les traitements
sylvicoles utilisés doivent permettre une certaine diversité et l’irrégularité retrouvée en forêt naturelle (MFFP, 2013). En maintenant les principaux attributs écologiques des forêts préindustrielles, les AFÉ permettent une exploitation durable, ainsi que des avantages sociaux et économiques reliés à l’utilisation des forêts (MFFP, 2013).
L’utilisation de modalités d’aménagements forestiers qui ont des effets qui se rapprochent de ceux de la dynamique des perturbations naturelles est une stratégie de gestion plus apte à maintenir l’intégrité écologique des écosystèmes forestiers. Ainsi, puisque les forêts naturelles étaient composées d’arbres de différentes tailles et à différents stades de vie (forêts irrégulières/inéquiennes), il devient justifié de considérer des interventions sylvicoles qui permettront de conserver ces attributs (Bergeron and Harvey, 1997; Quine et al., 1999; Harvey et al., 2002; Schütz, 2002; Bergeron et al., 2006; Franklin et al., 2007; Ruel et al., 2007; Waldron, 2013). Dans les régions où les perturbations secondaires (épidémies, chablis et feux de sévérité variable) étaient autrefois dominantes dans le régime des perturbations, ce virage sylvicole est d’autant plus légitime. Cela représente un changement important, notamment dans le contexte des pratiques d’éclaircies commerciales qui ont principalement favorisé le développement de peuplements réguliers/équiennes au Québec.
Le régime de futaie irrégulière/inéquienne
Le régime de la futaie irrégulière/inéquienne favorise simultanément la récolte, l’éducation et la régénération du peuplement (Schütz, 1997). Un renouvellement partiel et continu du couvert permet au peuplement de constituer une communauté où des individus à différents stades luttent avec succès pour l’accès à la lumière (Schütz, 1997). Ces communautés, constituées d’un mélange d’arbres de tous les âges, sont structurées par les arbres les plus anciens sous lesquelles se développent les plus jeunes, ce qui se rapproche davantage de la structure des forêts soumises à un régime de perturbations secondaires (Schütz, 1997). Cette structure permet un renouvellement continuel des stades de développement des espèces arborescentes au sein d’un milieu hétérogène (Schütz, 1997). Les forêts irrégulières/inéquiennes sont généralement composées d’une proportion élevée en essences longévives et tolérantes ou semi-tolérantes à l’ombre, ce qui sont deux
5
caractéristiques fondamentales de ces peuplements (Messier et al., 1999; Schütz, 2002). Pour qu’un peuplement soit considéré comme irrégulier/inéquienne, il doit nécessairement être composé d’au moins trois classes d’âge différentes (Schütz, 1997). Le système sylvicole qui est adapté à de telles forêts va favoriser la sélection d’arbres en fonction de la qualité des tiges individuelles à dégager (Schütz, 2002), ce qui fait que seulement un nombre restreint d’individus ayant atteint leur maturité sont récoltés périodiquement. Ainsi, les tiges dégagées permettent aux arbres plus performants, en termes d’accroissement, de se développer en maintenant une structure irrégulière/inéquienne dans le temps (Schütz, 2001). Pratiquée sur un vaste territoire, une telle approche pourrait permettre un approvisionnement plus régulier en bois, tout en complexifiant la structure interne des peuplements (Schütz, 1997). À terme, l’utilisation de ce régime sylvicole pourrait contribuer à restaurer les forêts aménagées en complexifiant leur structure et en réintroduisant de la biodiversité afin de réduire leur écart avec les forêts naturelles.
Le régime sylvicole de la futaie irrégulière/inéquienne est présentement très peu utilisé au Québec (Schütz, 1997; Gagné, L., 2009). En effet, puisque les effets à long terme sur la productivité forestière de telles pratiques ne sont pas connus, plusieurs acteurs du milieu forestier sont réticents face à ce changement de pratiques sylvicoles en forêt résineuse, puisqu’ils pensent que cela pourrait conduire à l’écrémage du peuplement et à la diminution de la productivité (CCSMAF, 2003; Laflèche et al., 2013). Pourtant, en théorie, les forêts irrégulières/inéquiennes peuvent offrir un rendement intéressant, en plus d’offrir une certaine constance dans l’approvisionnement en bois (Schütz, 1997). L’utilisation d’un régime de futaie irrégulière est ainsi très intéressante pour la région du Bas-Saint-Laurent, en plus d’être potentiellement efficace pour complexifier la structure interne des peuplements (Buongiorno, 2001; Hanewinkel, 2002; Hanewinkel and Pretzsch, 2000). Cependant, dans plusieurs régions, l’exploitation passée des forêts a fortement modifié la structure interne des forêts en les transformant progressivement en peuplements réguliers/équiennes résiduels, de sorte que le déploiement d’un régime de futaie irrégulière/inéquienne implique la conversion structurale de ces peuplements.
La conversion structurale d’un peuplement
La transformation d’une forêt régulière vers une structure irrégulière complète est un processus complexe qui peut s’étaler sur plusieurs décennies (Schütz, 2001). Ce processus de conversion nécessite une série d’interventions sylvicoles qui accélèrent la transformation en anticipant les différentes étapes de développement de la forêt (Schütz, 1997, 2001, 2002; O’Hara, 2002; Franklin et al., 2007). Le stade de jeunes forêts serait le plus propice pour amorcer la conversion, notamment si le peuplement est composé d’essences longévives, comme l’épinette blanche (Picea glauca) ou le thuya occidental (Thuja occidentalis) (Schütz, 1997). Pour amorcer la conversion, quatre étapes distinctes sont utilisées : la différentiation du peuplement, la promotion de la régénération, le développement structural et la consolidation de la structure inéquienne (Schütz, 1997; O’Hara, 2001; Schütz, 2001; Gagné, L., 2009). La hiérarchisation entre les classes sociales est amorcée à l’étape de la différentiation du peuplement. On y décèle des signes évidents de compétition entre les tiges (p.ex. couronnes qui se chevauchent) (Schütz, 1997, 2001). Cette étape permet de s’assurer que le peuplement est stable et prêt à recevoir une éclaircie (Schütz, 1997, 2001). La deuxième étape consiste à établir une régénération en essences longévives, à l’aide d’éclaircies ou de création de trouées, pour favoriser la croissance en diamètre du peuplement résiduel et de donner aux semis de meilleures conditions (Schütz, 1997, 2001). Cela permet d’établir la structure de base du peuplement pour la conversion vers une structure hétérogène, tant au point de vue de la grosseur et de la hauteur des tiges, que spatialement (Schütz, 1997, 2001). L’étape du développement structural débute lorsque la première cohorte de régénération est bien établie. Cette phase consiste à favoriser le recrutement de semis sur une base continue pour créer une troisième classe d’âge. On s’assure ainsi d’une bonne répartition des éléments de structures dans le peuplement (Schütz, 1997, 2001). Suite à l’établissement de la troisième classe d’âge dans le peuplement, la dernière étape s’assure que la structure inéquienne perdure dans le temps, en utilisant des aménagements adéquats (Schütz, 1997, 2001).
7
L’éclaircie commerciale par dégagement d’arbres-élites
Pour amorcer la conversion structurale au Bas-Saint-Laurent, il a été proposé d’utiliser l’éclaircie commerciale par dégagement d’AÉ. Ce type d’éclaircie est un traitement d’éducation de peuplement qui vise à dégager un nombre prédéterminé de tiges d’avenir à haut potentiel de croissance (i.e. arbres-élites) de leurs compétiteurs directs (Schütz, 1997; Grenon et al., 2007). Ces arbres sont généralement sélectionnés pour leur longévité, et puis à l’aide de critères physiques : apparence globale, forme régulière du houppier, absence de défauts et de vices apparents, branches de faible diamètre (Bastien, 2005). Les essences longévives, comme les cèdres et les épinettes, sont priorisées. Ces tiges sont dégagés de la compétition sur un rayon de 2 à 3 mètres ce qui leur assure de meilleures conditions de croissance, ce qui se manifestera par une tige de qualité supérieure (bois sain, sans coloration, tronc cylindrique) (Baar et al., 2004). À terme (i.e. lorsque la conversion structurale est complétée), cela fournirait du bois de meilleure qualité et des billes de plus grosses dimensions au moment de la récolte (Cameron, 2002 ; Baar et al., 2004 ; Lundqvist et al., 2007).
Des arbres-élites peuvent être désignés au sein de tous les types de peuplement, réguliers/équiennes ou irréguliers/inéquiennes, autant dans des groupes d’arbres issus de régénération naturelle que dans les plantations (Baar et al., 2004). Le nombre d’arbres-élites dégagés et leur répartition spatiale dans le peuplement ne doivent pas être laissés au hasard (Baar et al., 2004 ; De Potter et al., 2012). Une distance trop courte entre deux arbres-élites peut provoquer une compétition entre deux arbres sélectionnés, ce qui n’est pas désirable (Baar et al., 2004 ; De Potter et al., 2012). L’espace dégagé idéal pour préserver une vitesse de croissance optimale est de maintenir le houppier des arbres sélectionnés dans une situation de croissance libre (De Potter et al., 2012). Ainsi, lorsque l’arbre est dégagé, l’espace rendu libre est très rapidement recolonisé par l’élongation de ses branches latérales (De Potter et al., 2012). Les arbres-élites jouent un rôle structurant au sein d’un peuplement en devenant l’ossature du peuplement irrégulier/inéquienne (Schütz, 1997; Bastien, 2005; Gagné, L., 2009; De Potter et al., 2012).
Les éclaircies commerciales font habituellement partie d’un régime sylvicole régulier/équienne avec comme finalité la coupe totale du peuplement. En utilisant un régime de futaie irrégulière/inéquienne, c’est exactement ce que l’on souhaite changer. Lorsque la conversion sera bien engagée, il n’y aura pas de coupe finale, mais un recrutement continu d’arbres-élites, dans une structure irrégulière verticale et horizontale complétée (Schütz, 1997, 2001; O’Hara, 2001; Gagné, L., 2009). Le régime de futaie irrégulière/inéquienne implique qu’un nombre restreint d’individus peut produire du bois de qualité supérieure à chaque évènement de récolte et ainsi la majorité des revenus totaux, si l’éducation du peuplement commence dès le jeune âge (Fortin, 2007).
Objectifs et hypothèses
À l’aide d’un dispositif expérimental d’éclaircies commerciales établi en 2008, les objectifs de notre étude sont de comparer les effets des éclaircies commerciales (dégagement d’AÉ, éclaircie par le bas et placette témoin) sur (1) la croissance du peuplement, (2) la croissance des arbres individuels et (3) la complexité du peuplement. Étant donné que l’éclaircie commerciale par dégagement d’AÉ garantit de meilleures conditions de croissance pour les arbres dégagés, on s’attend à ce que la productivité du peuplement augmente. En effet, les arbres individuels devraient répondre de manière positive au dégagement, ce qui devrait se répercuter par un effet positif sur la productivité du peuplement. Ainsi, pour notre premier objectif, nous avons émis l’hypothèse que l’augmentation de la surface terrière sera plus élevée dans les parcelles éclaircies par dégagement d’AÉ que dans les parcelles éclaircies par le bas et que dans les parcelles témoins. Pour l’objectif 2, nous avons émis l’hypothèse que la croissance des AÉ individuels1 serait plus élevée dans les parcelles éclaircies par dégagement d’AÉ que dans les parcelles éclaircies par le bas et dans les parcelles témoins, puisque leur pression de compétition serait plus basse. L’éclaircie commerciale par dégagement d’AÉ, en créant des ouvertures partielles dans la canopée autour des arbres dégagés, devrait également favoriser la complexification des peuplements
1Les AÉ ont été identifiés dans tous les traitements, mais ils ont été dégagés de leurs compétiteurs immédiats
9
et l’hétérogénéité de leur structure interne. Ainsi, pour notre dernier objectif, nous avons émis l’hypothèse que la complexité structurale des parcelles éclaircies par dégagement d’AÉ sera plus grande que dans les parcelles éclaircies par le bas et que dans les parcelles témoins.
Pour vérifier ces hypothèses, les mesures sur des carottes d’accroissement ont été utilisées pour établir que l’augmentation de la surface terrière n’était pas significativement différente entre les traitements sylvicoles 5 ans après éclaircie. Les mêmes mesures ont été utilisées pour tester l’accroissement en diamètre à hauteur de poitrine (DHP) des AÉ, ce qui a démontré que la croissance était significativement plus élevée pour les arbres éclaircis par dégagement d’AÉ que pour les arbres éclaircis par le bas et les témoins. Les AÉ démontraient moins de compétition, quantifiés par l’indice de compétition Hegyi, que les arbres qui avaient le potentiel d’un AÉ et que les témoins. Enfin, la complexité spatiale des parcelles, quantifiée par la distribution à deux paramètres de Weibull et l’indice d’agrégation Clark-Evans, n’a pas augmenté de manière significative après le dégagement d’AÉ. Le nombre d’AÉ libéré n’est pas suffisamment élevé pour changer la structure du peuplement avec une seule éclaircie.
CHAPITRE 2: INCREASING THE STRUCTURAL COMPLEXITY OF CONIFEROUS STANDS WITHOUT REDUCING THEIR PRODUCTIVITY: A
CASE STUDY IN EASTERN CANADA ABSTRACT
For decades, logging has led to significant changes in composition and structure of the forests of Eastern Canada. In 2008, a commercial thinning trial consisting in the removal of competitors around elite trees (ET) was initiated as the first step of a structural conversion treatment to transform regular/even-aged stands to irregular/uneven-aged stands. Two intensities of thinning by ET release (50 ET/ha and 100 ET/ha) as well as a thinning from below and control blocks were tested in white spruce (Picea glauca) plantations and precommercially thinned balsam fir (Abies balsamea) dominated natural regeneration stands. In 2014, we measured these experimental plots for growth increment and stand structural diversity. At the stand level, no differences were observed amongst the treatments for average cumulative basal area increment since thinning. At the tree level, trees thinned by ET release showed a significantly higher diameter at breast height (DBH) increment than those in the control plots. The released ET also had higher DBH increments than their closest neighbors. The released ET had less competition than the potential ET in both the control and thinned from below plots. The spatial complexity of the plots did not however significantly increase after ET release, the number of ET released is probably not high enough to change the stand structure after only one thinning treatment. These results indicate that 5 years after treatment is not sufficient for trees to reach their peak growth. Further interventions are thus needed to reach the ecosystem-based forest management objectives.
Key words: commercial thinning by elite tree release, ecosystem-based forest management, structural conversion, spatial complexity, stand structure, thinning from below
11
INTRODUCTION
Logging in the 20th century has transformed the forest landscape in eastern Canada into a mosaic of regular/even-aged stands, creating a large gap between pre-industrial (natural) forests, which were predominantly irregular/uneven-aged, and managed forests (Boucher et al., 2009). In order to meet the goals of ecosystem-based forest management strategy on the national forests we must reduce the differences observed between the natural and managed forests.
Pre-industrial forest ecosystems dynamics were mainly controlled by natural disturbances (i.e, insect epidemics, fires, windfalls, etc.) that created partial openings in the canopy (Harvey et al., 2002; Messier et al., 1999; Bergès et al., 2002) and led to the heterogeneous and irregular internal structure of the majority of forest stands (Schütz, 1997; Bergeron and Harvey, 1997; Bergeron et al., 2006; Franklin et al., 2007; Ruel et al., 2007). These disturbances caused the accelerated growth of advanced regeneration of shade tolerant seedlings and saplings (Messier et al., 1999). The perpetuation of this dynamic was at the origin of the irregular/uneven-aged stands that dominated the eastern Canadian forest at the pre-industrial time.
Nowadays, in managed forests, silvicultural interventions are the most important disturbances (Bergès et al., 2002). Logging has resulted in the reduction of the average age of the stands of the forest and decreased certain forms of dead wood, as well as promoting pioneer species, while homogenizing the internal structure of the stands (Östlund et al., 1997; Boucher et al., 2006, 2009; Dupuis, 2009). Alterations in the internal structure of residual stands following traditional forest management has led to the suppression or limitation of several stages as well as structuring elements of the ecosystem, such as large mature trees and coarse woody debris and snags (Hansen et al., 1991; Bergès et al., 2002). Managed forests thus differ greatly from natural ones (Harvey et al., 2002). The difference between pre-industrial and managed forests is not only in terms of dynamics, but also in terms of structure (Hale et al., 1999; Boncina, 2000; Franklin et al., 2007).
Silvicultural interventions that could better imitate natural forest dynamics might help restore some attributes of unmanaged forests (Bergeron and Harvey, 1997; Quine et al., 1999; Bergès et al., 2002; Schütz, 2002). This should thus maintain forest resilience, since natural ecosystems can preserve its essential characteristics (structure, composition, function) after disturbances (Thompson et al., 2009). In several region of eastern Canada, the present-day forest landscape includes of a large proportion of plantations which are now ready for their first commercial thinning. In order to meet the requirements of the Sustainable Forest Act adopted in 2013 by the province of Quebec, the management strategies used in intensively managed stands must also be inspired by ecosystem-based forest management practices (Barrette et al., 2014). Thereby, a portion of these plantations must now be converted toward an irregular structure in order to reduce the structural differences between managed and natural forests. Commercial thinnings are usually part of a regular/even-aged forest regime with a final clear cut. Within a conversion framework, a portion of the even-aged stands of a given management unit will be shifted towards an irregular/uneven-aged forest management path.
Conversion to irregular or uneven-aged structures can take decades and requires a series of silvicultural interventions (Schütz, 1997, 2001, 2002; O’Hara, 2002; Franklin et al., 2007). According to Schütz (1997), young forests would be the most suitable to initiate the structural conversion, especially if the stands are composed of long-lived species, such as white spruce (Picea glauca (Moench) Voss) and white-cedar (Thuja occidentalis). To initiate the conversion, four distinct steps are used: (1) the differentiation of the stands (establishing the hierarchy of social classes and competition); (2) the promotion of regeneration of long-lived species (creation of thinning, gaps); (3) the structural development (establishment of the 1st cohort of regeneration) and (4) the consolidation of the uneven-aged structure (silvicultural interventions to maintain the uneven structure) (Schütz, 1997, 2001).
Commercial thinning by elite-tree (ET) release has been suggested to initiate the structural conversion. This approach aims to release a predetermined number of high growth potential stems (long-lived species, vigorous growth, regular form, absence of apparent defects) from their direct competitors (Bastien, 2005; Grenon et al., 2007), providing
13
enhanced growth conditions to ETs (more light, less competition) and high quality stem (healthy wood, without coloration, cylindrical trunk) at harvest time (Cameron, 2002; Baar et al., 2004; Lundqvist et al., 2007). The released trees play an important structuring role, as they are to become the framework of the irregular stand (Bastien, 2005; De Potter et al., 2012). Thinning by ET release must be viewed as the first step towards structural conversion, and that no final cut is planned. Thereby, continuously recruited ET will result with time in an irregular stand structure (Schütz, 1997, 2001; O’Hara, 2001; Gagné, L., 2009). Irregular/uneven-aged forest management implies that a limited number of trees could produce high quality timber at each harvesting entry and contribute the most to the total financial return of each entry (Lambert et al., 2007).
In eastern Canada, the short-term and long-term effects of these new practices on forest productivity are however unknown, and thus several forest stakeholders are reluctant to this shift in silvicultural practices (CCSMAF, 2003; Laflèche et al., 2013). The objectives of this study is to shed light on this concern by investigating a commercial thinning trial established in 2008 as the first step of a structural conversion treatment. The adoption of such a treatment in operational use may be favored if elite-tree release has zero cost compared to thinning from below in terms of forest productivity, and whether the ecosystem-based forest management interventions reach the desired objective: reintroduce diversity in the stand. The specific objectives of our study were to compare the effects of commercial thinnings treatments (ET release, release from below and control sites) on (1) stand growth, (2) tree increment and (3) stand complexity. Since released ET benefits from better growth conditions, it is expected that the productivity of the stand will increase. Indeed, individual trees and the corresponding stands should respond positively to the release. Thus, for our first objective we hypothesized that stand basal area increment will be higher in the plots thinned by ET release than in the plots thinned from below and the control plots. For objective 2, we hypothesized that in the plots thinned by ET release, elite-tree growth will be higher than those in the plots thinned from below and in control plots. Commercial thinning by ET release, by creating partial openings around the released trees, should also favor heterogeneity of stands internal structure. Thus, we hypothesized that stand complexity of
the plots thinned by ET release will be higher than for the plots thinned from below and the control plots.
To meet these objectives, measurements from increment cores were used to establish that stand basal increment was not significantly different between the silvicultural treatments. The same measurements were used to test ET diameter at breast height (DBH) increment, which was higher following release than in the thinned from below and control plots because the released trees had less competition, quantified by Hegyi competition index, than the potential ET in both the control and thinned from below plots. Finally, spatial complexity of the plots, quantified by the two-parameter Weibull density probability function and the Clark-Evans aggregation index, did not significantly increase after ET release, the number of ET released is not high enough to change stand structure with only one thinning.
MATERIALS AND METHODS Study Area
The research area is located 300 km to the north-east of Quebec City (fig.1a), in the Gaspé Belt Division of the Appalachian geological province (MRN, 2012), characterised primarily by surficial deposits of glacial origin (Gouvernement du Québec, 1992) at an elevation ranging from 300 m to 430 m (Gagné et al., 2016). The site was part of the eastern balsam fir (Abies balsamea (L.) Mill.)-yellow birch (Betula alleghaniensis Britton) bioclimatic subdomain of the northern temperate zone (Filiatrault, 2005). The climate is characterized by a mean annual temperature of 2.0°C, average annual total precipitation of 1032 mm, 1324 growing degree-days (> 5.0 °C) per year and a frost-free period of about 92 days (Amqui Station, Environnement Canada, 2015).
Experimental design
The experimental set-up was established in 2008 to initiate the conversion of regular/even-aged stands to irregular/uneven-aged stands. The partly nested design consisted in regeneration type (natural vs plantation) as the block and thinning type as the experimental units within each block. Two of the four blocks were established in white spruce plantations
15
and two in naturally regenerated softwood stands dominated by balsam fir (fig.1a; information on each block can be found in table 1). In each block, 16 or 20 thinning experimental units (99 m x 76 m, 7 500 m2, 4 or 5 replicates) were treated: control units with only the skid trails being harvested, thinning from below and thinning by elite tree (ET) release (50 ET/ha and 100 ET/ha) (fig.1b). The harvested trees were manually felled and the logs carried out with a forwarder.
The ET treatments consisted in releasing 50 or 100 ET per hectare from all competitors within a 3-meters radius (Schütz, 1997). A tree was considered a competitor when its branches touched the ET and was at least half its height. Based on Schütz (1997), a tree was considered as ET when it: (i) was either a balsam fir or preferably a white spruce tree, (ii) was dominant or codominant, (iii) was vigorous, with no signs of defoliation, (iv) had branches diameter < 2 cm on the first 2 meters of the bottom log, (v) had a crown with a regular form and no apparent defects, and (vi) had live crown ratio of 40 to 60 % (Gagné et al., 2016).
Thinning from below consisted in uniformly removing small, diseased or deformed stems. Tree selection was based on the harvesting criteria used by the Quebec’s department of forests that is based on the presence/absence of defects and diseases (Boulet et al., 2007). The harvested trees in the thinning from below generally had a DBH (measured at 1.3 above the ground to the closest 0.1 cm) smaller than 12 cm and had at least one 2.44 m (8’) log with a top end diameter of at least 9.1 cm.
The experimental units were subdivided into three experimental subunits of ~2,500 m2 in which gaps of varying size were created: control with no gap, 0.01 ha circular gap and 0.05 ha circular gap (fig.1c). Within each block, thinning type was assigned randomly to each experimental unit, and gap size randomly to each subunit. Experimental units were 33 m wide, with 4 m skid trails (~10 % of experimental unit area) used to separate each unit.
Data collection
Permanent sample plots were established six years after the thinning in the experimental subunits without gaps. The rectangular plots were setup from the center of one skid trail to the center of the following skid trail, with appr. 33 m between the skid trails and 15 m along the trail, yielding plots ranging in area from 379 to 633 m2 (fig.1c). A total of 72 permanent sample plots were thus established (4 blocks (e.g. 2 natural regeneration, 2 plantations) x 4 silvicultural treatments x 4 replicates per treatments in the Blais and Frenette sites and 5 replicates in the Humqui and Lechasseur sites (table 1).
The DBH of every living tree with a DBH greater than 5.0 cm was measured with a diameter tape. All trees were assigned a number, and the corresponding species noted. Sketches of the tree locations in all the plots within the white spruce plantations (i.e. 40 plots in both the Lechasseur and Humqui sites) were also done. No tree mortality was observed within each permanent sample plot.
17
Table 1 : Average stand characteristics (standard deviation in parentheses).
Block Stand type Variable Control Thinning
from below 50 ET/ha 100 ET/ha
Blais Natural
Age 35*
Ecological type MS1
Dominant species balsam fir 90 % - white spruce 10 %
Number of plots 4 4 4 4
DBH (mm) 2008 128.03 (45.17) 135.41 (51.35) 119.66 (44.82) 124.81 (48.67) DBH (mm) 2013 146.96 (50.76) 161.11 (58.15) 140.46 (51.95) 147.79 (57.04) BA (m2/ha) before thinning 29.31 (4.85) 26.56 (6.78) 24.06 (4.75) 23.24 (6.68)
BA (m2/ha) harvested in 2008 0.00 (0.00) 7.48 (2.34) 1.60 (0.40) 2.64 (2.05) BA (m2/ha) 2008 29.31 (4.85) 21.17 (5.42) 24.12 (5.02) 23.39 (5.60) BA (m2/ha) 2013 38.50 (5.94) 29.65 (6.58) 33.14 (6.88) 32.72 (7.05) Frenette Natural Age 42* Ecological type MS2
Dominant species balsam fir 85 % - white spruce 15 %
Number of plots 4 4 4 4
DBH (mm) 2008 137.58 (50.21) 141.38 (48.22) 123.66 (43.30) 135.37 (41.04) DBH (mm) 2013 151.38 (53.59) 159.83 (53.33) 138.16 (47.11) 151.33 (44.87) BA (m2/ha) before thinning 32.99 (5.63) 33.55 (1.75) 32.60 (6.04) 33.02 (2.86)
BA (m2/ha) harvested in 2008 0.00 (0.00) 7.37 (1.99) 2.73 (1.93) 4.07 (1.50) BA (m2/ha) 2008 37.15 (6.52) 30.49 (2.61) 33.33 (7.41) 33.10 (4.21) BA (m2/ha) 2013 44.60 (6.48) 38.78 (2.66) 41.24 (8.19) 41.20 (4.38) Humqui Plantation Age 30* Ecological type MS1
Dominant species white spruce
Number of plots 5 5 5 5
DBH (mm) 2008 118.61 (39.81) 118.62 (42.44) 120.74 (39.03) 109.86 (40.87) DBH (mm) 2013 141.55 (46.05) 145.44 (48.57) 144.03 (45.99) 133.04 (46.44) BA (m2/ha) before thinning 26.61 (1.15) 23.86 (4.80) 24.83 (3.27) 21.12 (7.60)
BA (m2/ha) harvested in 2008 0.00 (0.00) 5.69 (3.15) 1.38 (0.84) 2.55 (1.39) BA (m2/ha) 2008 29.36 (1.75) 21.31 (5.98) 26.79 (3.45) 21.24 (7.44) BA (m2/ha) 2013 41.56 (2.45) 31.32 (8.01) 38.01 (4.03) 33.37 (4.61) Lechasseur Plantation Age 32* Ecological type MS2
Dominant species white spruce
Number of plots 5 5 5 5
DBH (mm) 2008 136.48 (45.39) 145.76 (47.10) 129.26 (44.23) 138.12 (44.97) DBH (mm) 2013 157.43 (50.65) 173.22 (53.62) 149.31 (49.72) 161.03 (52.23) BA (m2/ha) before thinning 26.14 (3.80) 23.99 (2.20) 26.47 (2.88) 26.68 (3.07)
BA (m2/ha) 2008 29.04 (3.78) 21.72 (2.48) 28.18 (2.62) 25.55 (3.57)
BA (m2/ha) 2013 38.21 (4.89) 30.36 (2.66) 37.13 (2.99) 34.50 (4.83)
* In 2014
Figure 1 : Study area (a) in Bas-Saint-Laurent, Québec, (b) experimental units within a block where the silvicultural treatments were applied and (c) an experimental unit divided in 3 subunits (gap of 0,01 ha, 0,05 ha and no gap).
The permanent sample plots within the white spruce plantations were also scanned with a FARO Focus 3D terrestrial laser scanner (TLS) from 7 to 9 points. The scans from a same plot were aligned using Faro Scene 5.0 (FARO technologies, 2016) to produce a 3D point cloud for each plot. A 10 cm slice centered at 1.3 m above the digital terrain model was then extracted with Computree (Othmani et al., 2011). As in Bérubé-Deschênes et al. (2017), this slice was used to determine the XY coordinates of every tree. The position of the trees was compared to the sketches drawn in the field to ensure the correct numbering of the trees within the stands and to apply corrections if needed (Bérubé-Deschênes et al., 2017). Unidentified trees were marked manually with ImageJ (Schneider et al., 2012) and R
19
statistical software (R Core Team, 2015). The tree maps were then used to compute the distance of each tree to the skid trails and the Clark-Evans aggregation index (Clark and Evans, 1954) with the Kaplan-Meier type edge correction (Kaplan and Meier, 1958).
A double sampling scheme was used in order to study the effect of thinning on (i) stand level variables and on (ii) elite tree growth. Increment cores were extracted at a height of 1.3 m from each commercial species tree (i.e. balsam fir, white spruce, black spruce (Picea mariana (Mill.) B.S.P.), white birch (Betula papyrifera Marsh.), red maple (Acer rubrum L.), and quaking aspen (Populus tremuloides Michx.)) that was measured in the plots. Furthermore, six elite trees (in the plots with 50 and 100 ET/ha) or potential ET (in the control plots and thinned from below plots) per experimental subunit with no gaps, outside the permanent sample plots, were randomly selected by identifying the elite tree closest to six randomly generated points in ArcGIS (ESRI, 2012). Potential elite-trees were chosen with the same criteria as for the selection of ET in 2008 and their position was independent of the stems cut in 2008 (e.g. trees harvested in the plots thinned from below in 2008). The ET or potential ET outside the plots and their closest competitors (i.e. trees with crowns touching the selected elite tree) were also cored. Distance and azimuth between competitors and ET or potential ET were measured, and Hegyi’s competition index calculated (Biging and Dobbertin, 1992) using the four closest competitors (eq.1):
𝐻 = ∑𝑖≠𝑗 𝐷𝑗
𝐷𝑖(𝐷𝑖𝑠𝑡𝑖𝑗+1) [1]
where 𝐷𝑖 and 𝐷𝑗 are the DBH of the ET and competitor, respectively, and 𝐷𝑖𝑠𝑡𝑖𝑗 the distance
between the competitor j and ET i.
The 8,057 increment cores taken at breast height were obtained by orienting the borer towards the center of the plot (for trees within the permanent plots) or towards the ET (for the ET competitors outside the plot). The cores were sanded with 80 and 120 grit paper. DBH at the time of thinning (i.e. 2008) and five years after (i.e. 2013) were then obtained using an electronic caliper, and then applying the measured 2008 to pith ratio (or 2013 to pith ratio) to the DBH measured with the tape.
Thinning intensity was estimated by measuring the stumps within the plots. The stump height (SH, in cm to the closest 0.1 cm) and diameter at stump height (DSH, in cm to the closest 0.1 cm) were obtained using a measuring and diameter tape, respectively. The location of the stumps (i.e. within the permanent plot or in the skid trail within the plot) was also noted. Trunk diameter at 5, 10, 15 and 20 cm from the ground and DBH were measured on five standing trees, in the control subunits, for each species present. Stump diameter to DBH models were calibrated by species by site (8 models): DBH = b0 + b1*DSH + b2*SH
+ b3*SH2 + b4*SH*DSH (mean R2 = 0.97) (appendix I).
The distance between the plot edges and the side of the skid trail, defined as the edge of the skid trail towards the plot, was measured along the two plot sides that were within the skid trail. This information, combined with the DSH to DBH model that was applied to the stump measurements, was used to estimate the basal area removed within each permanent sample plot, with and without the skid trails.
Finally, the inventory data combined with the stump height measurements and the increment cores were used to obtain the stand basal area prior to treatment, immediately after treatment and 5 years after treatment. The shape (SP) and scale (SC) parameters of the Weibull probability density function (Weibull, 1951; Bailey and Dell, 1973) prior to, after thinning and 5 years after were also computed in order to quantify stand structure.
Statistical analysis
The effects of stand type and thinning treatment on basal area and tree growth were analysed using a mixed-effects model in order to account for the split-plot design. The model also included a covariable to consider the differences in initial stand density or tree size. Block effects were used in the stand level models (eq.2a) whereas block and plot random effects were included for the tree level analysis (eq.2b).
21
𝑌𝑖𝑗𝑘 = 𝜇 + 𝛽1∙ 𝐷𝐵𝐻𝑖𝑗𝑘 + 𝑇𝑅𝑖𝑗 + 𝑆𝑇𝐴𝑇𝑖𝑗𝑘+ 𝑇𝑅𝑖𝑗 ∙ 𝑆𝑇𝐴𝑇𝑖𝑗𝑘+ 𝑣𝑖 + 𝑢𝑖𝑗+ 𝜀𝑖𝑗𝑘
[2b] Where
- 𝑌𝑖𝑗 is one of the stand level variables for plot j nested within block i:
- iGtot: 5-year average basal area (BA) increment of all the trees
- iGmer: 5-year average BA increment of the commercial sized trees (i.e. trees with a DBH ≥ 9.1 cm)
- iGtim: 5-year average BA increment of timber sized trees (i.e. trees with a DBH ≥ 15.1 cm) in m2/ha/year
- R: Clark-Evans aggregation index)
- 𝑌𝑖𝑗𝑘 is one of the tree level variables for ET or competitor tree k in plot j nested in
block i:
- iDBH : DBH increment (in mm/year) - H: Hegyi competition index of the ET) - 𝜇 the overall mean
- 𝛽1 fixed-effect partial slope of the covariable, estimated by the model
- 𝐵𝐴𝑖𝑗 the basal area of the plot prior to commercial thinning
- 𝐷𝐵𝐻𝑖𝑗𝑘 the tree DBH at time of thinning
- 𝑇𝑌𝑖 the stand type (i.e. plantation or naturally regenerated stand)
- 𝑇𝑅𝑖𝑗 the thinning type (i.e. control, from below, 50 released ET/ha, 100 released
ET/ha)
- 𝑆𝑇𝐴𝑇𝑖𝑗𝑘 the status of the tree: elite tree or competitor of the elite tree
- 𝑢𝑖𝑗 the plot random effect, where 𝑢𝑖𝑗~𝑁(0, 𝜎𝑖𝑗2)
- 𝜀𝑖𝑗 and 𝜀𝑖𝑗𝑘 are the unexplained random errors, where 𝜀𝑖𝑗~𝑁(0, 𝜎2) and
𝜀𝑖𝑗𝑘~𝑁(0, 𝜎2)
The basal area increment analysis was carried out with and without considering the skid trail area within the plots. The Clark-Evans aggregation index was only available for the white spruce plantation sites (i.e. Lechasseur and Humqui), and thus the terms TY in eq.2a with stand type were not included in the analysis.
The tree level analysis was done by separating white spruce and balsam fir ET and competitors of the ET. Even though white spruce was found in both plantations and naturally regenerated softwood stands, the stand type variable was left out of the final model (eq.2b) because there was no difference between the stand types as well as no interactions, and the AIC was lower for the model with no interactions. In the white spruce plantations, no balsam fir trees were selected as ET and thus the stand type variable in eq.2b was dropped. The status of the tree (i.e. ET or competitor) was not included when the Hegyi competition indices were compared, as the competitors of the competitor trees were not measured. Since the trees in both intensities (50 and 100 ET/ha) of the thinning by ET release treatment were released in the same way (i.e. 3 m radius), the analysis done at tree level considered these two treatments as one.
The effect of the distance to the skid trail (DISTijk) on tree growth was modelled using
a linear regression with all the trees from the plots (eq.3). The model was calibrated for trees in the white spruce plantations only because tree maps were only available for the plots in these blocks. Moreover, the model was calibrated to each thinning type individually.
𝑖𝐷𝐵𝐻𝑖𝑗𝑘 = 𝛽0+ 𝛽1∙ 𝐷𝐵𝐻𝑖𝑗𝑘 + 𝛽2∙ 𝐷𝐼𝑆𝑇𝑖𝑗𝑘+ 𝛽3∙ 𝐷𝐵𝐻𝑖𝑗𝑘 ∙ 𝐷𝐼𝑆𝑇𝑖𝑗𝑘+ 𝑣𝑖 + 𝑢𝑖𝑗 +
𝜀𝑖𝑗𝑘 [3]
Finally, the changes in diameter distribution were studied using the two-parameter Weibull density function for each permanent plots. The shape parameter controls the form of the distribution, from small values being heavily right-skewed distributions, to large values
23
being heavily left-skewed distributions and the scale parameter controls the width of the distribution (Menon, 1963; Bailey and Dell, 1973). The effects of stand type, thinning treatment and the year of inventories (YEij ; before thinning (2008), after thinning (2008) and
five years after thinning (2013)) on shape and scale parameters (Yij) were analysed using a
mixed-effects model by including the blocks as random effects (Eq. 4).
𝑌𝑖𝑗 = 𝜇 + 𝛽1∙ 𝐵𝐴𝑖𝑗+ 𝑇𝑌𝑖 + 𝑇𝑅𝑖𝑗 + 𝑌𝐸𝑖𝑗+ 𝑇𝑌𝑖 ∙ 𝑇𝑅𝑖𝑗 + 𝑇𝑌𝑖 ∙ 𝑌𝐸𝑖𝑗 + 𝑇𝑅𝑖𝑗 ∙ 𝑌𝐸𝑖𝑗 +
RESULTS
At stand level, no statistical differences were observed between the silvicultural treatments or between the stand types for total, merchantable and timber sized BA increment (table 2). Although there was no significant differences, the trend shows similarities in BA increment between the thinned by ET release (50 ET, 100 ET) stands and the control stands (fig.2a-b). When only merchantable and timber sized trees were considered, the BA increment of the 100 ET/ha treatment follows the same trend as the thinned from below stands (fig.2.c-f). The analysis with and without skid trails did not show any differences (fig.2). The BA increments seemed to be a little higher in plantations than in the naturally regenerated stands, even if there were no statistical differences (fig.2).
Table 2 : F-values (p-values in parentheses) for the analysis of variance, at stand level (eq.2a), on
average increase in BA (m2/ha/year) between the time of thinning and five years later (2008-2013)
for control, thinned from below, thinned by ET release (50 ET/ha and 100 ET/ha) permanent plots
in white spruce plantations and naturally regenerated softwood stands with BA (m2/ha) before
thinning as covariable (bold: significant [P < 0.05]).
Source of variation ndf ddf All trees, with skid trails All trees, without skid trails DBH ≥ 9.1 cm, with skid trails DBH ≥ 9.1 cm, without skid trails DBH ≥ 15.1 cm with skid trails DBH ≥ 15.1 cm without skid trails BA (m2/ha) before thinning (covariable) 1 61 (0.40) 0.72 (0.28) 1.21 31.50 (<0.0001) 37.77 (<0.0001) 51.02 (<0.0001) 59.91 (<0.0001) Silvicultural treatment 3 61 (0.90) 0.19 (0.94) 0.14 (0.55) 0.71 (0.48) 0.83 (0.74) 0.42 (0.50) 0.79 Stand type 1 2 (0.36) 1.37 (0.34) 1.54 (0.53) 0.57 (0.47) 0.78 (0.60) 0.38 (0.52) 0.60 Silvicultural treatment X Stand type 3 61 0.38 (0.77) (0.74) 0.42 (0.38) 1.04 (0.28) 1.30 (0.32) 1.21 (0.28) 1.32


![Figure 5 : Relationship between DBH increment and distance to the closest skid trail by thinning method for the white spruce plantations (Lechasseur and Humqui sites) (bold: significant [P < 0.05])](https://thumb-eu.123doks.com/thumbv2/123doknet/7465887.222404/51.918.132.822.416.932/figure-relationship-increment-distance-thinning-plantations-lechasseur-significant.webp)


