GROWTH IN EXECUTIVE FUNCTIONING 1
Matte-Gagné, C., Bernier, A., Sirois, M.-S., Lalonde, G., & Hertz, S. (2018). Attachment security and developmental patterns of growth in executive functioning during early elementary school. Child Development, 89, e167–e182.
Abstract
Despite the extensive research demonstrating the importance of child executive functioning (EF) for school adjustment, little longitudinal work has formally examined developmental change in EF during the early school years. Based on a sample of 106 mother-child dyads, the current longitudinal study investigated patterns of growth in child performance on three executive tasks between kindergarten and Grade 3, and the predictive role of earlier mother-child attachment security in these patterns. The results suggest that early elementary school is a period of
significant developmental improvement in child EF, although child performance on different EF tasks follows distinct trajectories across time. The study also provides evidence for a sustained relation between children’s early attachment security and their ongoing acquisition of executive skills.
Keywords: attachment security, executive functioning, patterns of growth, elementary school
Attachment Security and Developmental Patterns of Growth in Executive Functioning during Early Elementary School
Entry into elementary school is a critical developmental period characterized by many contextual and social changes (Cowan & Heming, 2005; Sameroff & Haith, 1996), and some children are better equipped than others to handle the challenges associated with this transition. A growing body of research supports the critical role of child executive functioning (EF) in school readiness (Bierman, Nix, Greenberg, Blair, & Domitrovich, 2008; Blair & Raver, 2015; Ursache, Blair, & Raver, 2012). EF is a set of top-down neurocognitive processes involved in
self-regulation that can be broadly conceived as serving the conscious, goal-directed control of thought, action and emotion (Zelazo & Carlson, 2012). This set of cognitive self-regulatory skills is foundational for children’s successful functioning in classroom and school contexts, in that it underlies many aspects of cognition and behavior that are crucial for academic success (Blair & Raver, 2015). Despite the extensive research demonstrating the importance of child EF for school adjustment, and the widespread assumption that executive skills grow throughout school age (De Luca & Leventer, 2008), surprisingly little longitudinal work has formally examined
developmental patterns of change in EF during the early school years. This dearth of research dramatically limits our understanding of the normative development of EF skills and precludes the identification of the factors that may promote or hinder this development at a time when EF skills are of critical importance for children’s daily functioning. This study tackled this gap by modeling intra-individual developmental patterns of growth in child performance on three tasks measuring different EF skills between kindergarten and Grade 3, and examining the capacity of early attachment security, one of the most promising social influences on child EF, to predict individual differences in these growth patterns.
Patterns of Growth in Child EF
Early elementary school is largely believed to be a period of marked developmental improvements in EF skills. Indeed, literature reviews largely support this view (Best & Miller, 2010; De Luca & Leventer, 2008) by summarizing the results of numerous cross-sectional studies that demonstrate relatively large age-related differences in EF during this developmental period. However, cross-sectional designs do not allow for examination of true developmental patterns of change (Clark et al., 2013), and little longitudinal work has formally examined patterns of change in child EF (Garon, Bryson, & Smith, 2008). Moreover, the majority of longitudinal studies have examined change in EF across time through mean-level consistency and continuity in rank order (i.e., inter-individual stability). While conceptualizing and analyzing change with these
approaches is important, it does not provide information about intra-individual developmental patterns of change (i.e., within-person changes across time). Considering the importance of child EF for school success and adaptation, more multi-wave longitudinal studies examining intra-individual developmental change in EF in the early school years are needed.
Moreover, there is still debate in the literature concerning the fractionated or unified structure of child EF (Garon, Smith, & Bryson, 2014). Because proponents of a fractionated structure approach argue that developmental trajectories of different EF skills may be distinctly dissimilar (Garon et al., 2008), it has been proposed that examining developmental patterns of growth in children’s performance on separate EF tasks may critically contribute to advancing the debate on the fundamental nature of EF (Clark et al., 2013). A recent longitudinal study using a cohort-sequential design to examine performance on several EF tasks from early elementary school to adolescence reported task-specific differences in age-related changes during this time period using a series of multivariate analysis of variance (Lee, Bull, & Ho, 2013). While these results suggest that distinct patterns of growth in child performance might be expected for
different EF tasks during elementary school, intra-individual developmental patterns of change were not examined using contemporaneous growth modeling approaches.
Recent statistical advances have made the examination of intra-individual developmental patterns of growth feasible. These methods can now be used to enhance our understanding of the developmental course of different EF skills during early elementary school. Using such a
contemporaneous growth modeling approach, the present study focusing on the early school years examines intra-individual patterns of change in child performance on three tasks that were developed to measure basic EF skills: inhibitory control, working memory, and set-shifting (Miyake et al., 2000). Inhibitory control refers to the voluntary inhibition of an automatic
prepotent response (Best & Miller, 2010). Working memory concerns the ability to hold in mind and mentally manipulate information over short periods of time (Miyake et al., 2000). Set-shifting concerns the ability to flexibly switch between sets of behaviors, tasks, or rules (Best & Miller, 2010). Set-shifting and inhibition support the behavioral skills necessary for
self-regulated learning, such as following classroom rules, sitting still, resisting distraction, and switching attention (Blair, 2002), while working memory plays an important role in the development of mathematical abilities and reading comprehension, among others (Alloway & Alloway, 2010). In light of the critical importance of these executive skills for children’s successful functioning in classroom and school contexts, it appears vital to get a better understanding of their respective growth patterns across the early school years.
Recently, longitudinal studies (albeit generally conducted with preschoolers) have begun to investigate developmental patterns of change in different EF skills across time with
contemporaneous growth modeling approaches (Bindman, Hindman, Bowles, & Morrison, 2013; Camerota, Willoughby, Cox, Greenberg, & Family Life Project Investigators, 2015; Clark et al., 2013; Hackman et al., 2014; Wiebe, Sheffield, & Espy, 2012; Willoughby, Wirth, & Blair, 2012).
To our knowledge, however, only two studies have used growth modeling approaches to examine developmental change in child EF during the early school years (Hackman, Gallop, Evans, & Farah, 2015; Roskam, Stievenart, Meunier, & Noël, 2014). These studies reported, respectively, significant improvement in child performance on tasks tapping working memory (Hackman et al., 2015) and inhibitory control (Roskam et al., 2014). Whereas a deceleration in the rate of growth was found for working memory across early elementary school (Hackman et al., 2015), non-linear patterns of change in inhibitory control were not examined (Roskam et al., 2014). Moreover, patterns of growth in set-shifting were not examined. The goal of the present study was to move beyond previous findings by examining different shapes of growth in inhibitory control, working memory, and set-shifting skills as measured by different EF tasks.
In light of the importance of EF skills for school adjustment, it appears also vital to identify the origins of individual differences in intra-individual developmental patterns of change in child EF during elementary school. Among potential influences, the quality of early attachment relationships with primary caregivers has been emerging as a promising predictor of child EF, but it has yet to be investigated in relation with growth patterns of child EF at any age.
EF and Parent-Child Attachment Relationships
Longitudinal studies spanning over more than 20 years of development (see Grossmann, Grossmann, & Waters, 2005), as well as meta-analytic reviews (e.g., Fearon,
Bakermans-Kranenburg, Van IJzendoorn, Lapsley, & Roisman, 2010) have shown that the security of parent-child attachment relationships is a reliable predictor of parent-children’s developmental pathways. Given the consensus that EF is susceptible to environmental influences (Fay‐Stammbach, Hawes, & Meredith, 2014), it should then also be susceptible to the influence of parent-child attachment relationships. Indirect support for this hypothesis stems from studies that have found the quality of parenting behaviors to relate to child EF (see Fay‐Stammbach et al., 2014 for a review) and to
patterns of growth in child EF (Bindman et al., 2013; Camerota et al., 2015; Hackman et al., 2015; Roskam et al., 2014). One may expect links between EF and parent-child attachment to be at least as strong, given that child attachment is conceptualized, in some ways, as being a result of parental behavior as observed in the child’s own behavior, providing a window into the portion of caregiving relationships to which the child has been sensitive (Bernier, Carlson, Deschênes, & Matte‐Gagné, 2012). Accordingly, securely attached children are expected to outperform their insecurely attached counterparts on EF tasks. This hypothesis is supported by studies showing that children who were more securely attached to their mothers in toddlerhood showed better performance on EF tasks at age 3 (Bernier et al., 2012) and 5 (Bernier, Beauchamp, Carlson, & Lalonde, 2015). However, to date, studies have only used correlational and regression analyses to examine these associations. Thus, it remains unknown whether early attachment security sets children on a trajectory of EF development that results in persistent disparities over time, if the disparities observed early on narrow, perhaps as a result of schooling compensating for early experience, or if they widen, due to accumulating effects of the benefits of secure attachment. According to Fraley, Roisman, and Haltigan (2013), data collected across multiple waves are necessary to tease apart transient and enduring effects of early experience, because two-wave analyses do not reveal the patterns of associations that unfold over time. To gain a true
understanding of the associations of early attachment security with EF development during early school years, we need multi-wave longitudinal data, allowing for the examination of attachment security as a predictor of patterns of growth in child EF.
The Present Study
The current longitudinal study set out to investigate linear and non-linear intra-individual developmental patterns of change in child performance on tasks that involve different EF skills between kindergarten and Grade 3, as well as the predictive role of earlier mother-child
attachment security in these patterns of growth. Developmental improvement in child EF was expected. However, given the scarcity of previous studies, specific hypotheses about the shape of these improvements could not be formulated. Furthermore, toddlers more securely attached to their mothers were expected to show consistently superior EF performance across time.
Method
Participants
The sample consisted of 106 mother-child dyads (46 boys and 60 girls) living in a large Canadian metropolitan area. Families were recruited from birth lists randomly generated and provided to the research team by the Ministry of Health and Social Services. Families received a letter describing the project and were then contacted by phone; 39% of contacted families agreed to participate. Criteria for participation were full-term pregnancy (i.e., at least 37 weeks of gestation) and the absence of any physical or mental disability known to the parents at the outset of the study (7 months). Socio-demographic and obstetric information, such as maternal
education, family income, and child birthweight, were gathered upon recruitment (7 months) with a self-report questionnaire completed by the mothers. Mothers had 16 years of education on average (varying from 8 to 23), with 60% of mothers holding a college degree (while 63.3% of parents living in the same province hold a college degree; www.stat.gouv.qc.ca). Family income was based on categorical scores distributed as follows: 1 (N = 2) < 20K$; 2 (N = 12) = 20-39K$; 3 (N = 9) = 40-59K$; 4 (N = 25) = 60-79K$; 5 (N = 16) = 80-99K$; 6 (N = 38) = 99K$ and over (4 did not report). Mean family income for the sample was 4.4 (SD = 1.5), near the mean family income in Canada, which was $74,600 for the years of data collection.
The 106 families with EF data at 5 years (thus constituting the sample on which EF patterns of growth were estimated) were part of a larger sample of 152 families who had attachment data at 15 months and/or 2 years. Of those 106 families, 11 subsequently left the
study between kindergarten and Grade 1, 3 between Grades 1 and 2, and 2 between Grades 2 and 3. Due to the method used to handle the missing data, described below, all 106 families were used in analyses, and thus constitute the current study’s sample. Attrition analyses revealed that families who left the study were not different from others on demographic or main variables.
Procedure
The families took part in two toddlerhood visits and four early school-age visits. Children were assessed at 15 months (T1; M = 15, SD = 0.83, Range = 13-18) and 2 years of age (T2; M = 26 months, SD = 1.20, Range = 22-28), as well as in kindergarten (T3; M = 72 months, SD = 2.55, Range = 67-78), Grade 1 (T4; M = 85 months, SD = 3.31, Range = 80-92), Grade 2 (T5; M = 94 months, SD = 3.73, Range = 87-102) and Grade 3 (T6; M = 105 months, SD = 3.39, Range = 98-112). All visits were conducted in the families’ homes, and lasted 70 to 90 minutes. The two toddlerhood visits, aimed at assessing mother-child attachment security, were modeled after the work of Pederson and Moran (1995). These visits were purposely designed to create a situation where maternal attention was being solicited by both the research tasks and the toddler’s
demands. This was intended to reproduce the need for multi-tasking that is inherent to caring for a toddler in daily life. Both visits included child-centered tasks, a brief interview with the mother, a videotaped mother-child interactive sequence, and questionnaires that mothers had to complete while the toddler was not looked after by the research assistant. Observations performed
throughout the visits were rated using the Attachment Behavior Q-Sort (AQS). The other home visits (T3 to T6), mainly consisted in the administration of the EF tasks described below.
Measures
Mother-child attachment security. Child attachment was assessed at both 15 months
and 2 years using the AQS (Waters, 1995), which was completed immediately after the home visits. The AQS is comprised of 90 items describing potential child behaviors. Items are sorted
by an observer into nine piles, reflecting the degree to which the items resemble the child under observation. The observer’s sort is then correlated with a criterion sort provided by the authors of the instrument, representing the prototypically securely attached child. Attachment scores can thus vary from -1 = most insecure to 1 = prototypically secure. Prototypical security represents a fluid balance between exploration of the environment and appropriate reliance on the caregiver for support when needed. At T1, inter-rater reliability was conducted for 22% of the dyads and was found to be satisfactory (Intraclass Correlation [ICC] = .71). At T2, it was conducted for 19% of the dyads and was also satisfactory (ICC = .70). Meta-analytic data (Van IJzendoorn, Vereijken, Bakermans-Kranenburg, & Riksen-Walraven, 2004) suggest that the observer-AQS shows excellent construct validity, with scores converging with maternal sensitivity, attachment assessed with the Strange Situation, and child adaptation. The AQS also shows moderate
temporal stability (meta-analytic r = .28; Van IJzendoorn et al., 2004). In the current study, the correlation between scores at 15 months and 2 years was r = .22, p < .05. The moderate stability across time suggests that combining the two assessments might reduce measurement and
situational error and yield a more accurate picture of children’s average level of attachment security across toddlerhood. Thus, the two AQS scores were averaged into a global score that represents overall mother-child attachment security during toddlerhood. The mean and standard deviation for attachment security at 15 months (M = 0.49, SD = 0.26) and 2 years (M = 0.50, SD = 0.24) were almost identical. Consequently, in 13 cases where the AQS score was missing at either 15 months or 2 years, the available score was used in analyses.
Child executive functioning. Children’s EF was assessed yearly during early elementary
school with three behavioral tasks capturing three core aspects of early childhood EF: inhibitory control, working memory, and set-shifting (Garon et al., 2008; Zelazo et al., 2013).
Flanker. This computerized measure of inhibitory control in the context of visual
selective attention was adapted from the Attention Network Task (Rueda et al., 2004) by Zelazo and colleagues (2013) and administered at T3, T4 and T5 in the current study. A monitor
depicted fish in a line, and either they were all facing in the same direction (congruent trials) or the middle fish was facing in the opposite direction (incongruent trials). Following a brief
practice period, children were instructed to use one of two arrow keys on the keyboard to indicate which direction the middle fish was pointing (left or right; 25 trials). If they succeeded on at least 5 out of the 9 incongruent trials in this block (all children in this sample did), they proceeded to a final block in which the fish were replaced with smaller arrows (thus making it more challenging) for 25 more trials. Accuracy (percent correct of total trials) was used in data analyses. The
Flanker task shows excellent test-retest reliability (ICC = .95) and convergent validity with the Block Design subtest of the WPPSI–III (Carlson & Harrod, 2013; Zelazo et al., 2013). This task was not administered at the last assessment of the current study, given that the developmental trend from T3 to T5 suggested that many children’s performance would probably be at ceiling at T6 (Table 1; see below for formal analysis of the possible ceiling effects at T3 through T5).
Backward word/digit span (Carlson, Moses, & Breton, 2002). Backward digit span was administered at T4 to T6. In order to take into account children’s numerical skills that are still developing, which might inadvertently impact their task performance (Carlson et al., 2002), Backward word span was administered at T3. Following Davis and Pratt (1996), children were asked to repeat a list of single-digit numbers (digit span) or single-syllable, familiar, yet non-semantically related words (word span) in the reverse order. Children were given a digit or 2-word practice trial, corrected if wrong, and then proceeded to the test trials. List size increased (2, 3, 4, 5 and 6 digits or words) with each level succeeded (success corresponds to getting one of the three trials of a given level correct) and the task ended when the child erred three consecutive
times at a given level. The number of succeeded test trials, ranging from 0 to 15, was used in data analyses. Backward span tasks are common measures of working memory that are widely used and have good test-retest reliability (ICCs between .64 and .67; Müller, Kerns, & Konkin, 2012). The Backward word span and Backward digit span tasks have been found to correlate highly with each other (rs > .70) and with other measures of working memory (Alloway, Gathercole, & Pickering, 2006; Carlson et al., 2002; Müller et al., 2012).
Dimensional Change Card Sort (DCCS; Zelazo, 2006). This task was selected as the measure of set-shifting. The experimenter showed children a card depicting a red truck, and a card depicting a blue star, and explained that they would play a sorting game with two boxes, which were labeled with a blue truck and a red star (thus in contrast with the test cards). In the first round, children were instructed to classify the cards handed to them by shape (6 trials). In the second round, they were instructed to switch rules and sort the cards by color (6 trials). In the third round (the actual test phase), children had to sort by either shape or color, based on whether or not there was a border around the card – they had to sort by color when handed a card with a border, and by shape if handed a card with no border. At T3, we used the paper version of the DCCS, with six trials in this last round. At T4 to T6, the equivalent computerized version was used, which entails 30 trials in the last round. Percentage of accurate responses (relative to total trials) was used in data analyses. The DCCS has excellent test-retest reliability (ICC = .92) and convergent validity with the Block Design subtest of the WPPSI–III (Zelazo et al., 2013).
Analytic Strategy
To describe and predict intra-individual patterns of change in child EF across time, growth curves were fitted in Mplus 7.4 using a multilevel modeling (MLM) framework also known as Hierarchical Linear Modeling (HLM). MLM was chosen here (instead of a structural equation modeling framework) because it can easily handle the difficulties generated by specific
conditions encountered in the present study, such as small samples (groups as small as 30–50 are sufficient with up to five predictors), partially missing data, unequally spaced time points, and data collected across a range of ages within any one occasion (Burchinal, Nelson, & Poe, 2006; Singer & Willett, 2003). Multilevel growth modeling treats repeated observations as nested within individuals and models change over time on two levels: a Level-1 component representing individual (within-person) change over time and a Level-2 component representing the extent to which change differs across individuals (between-persons; Singer & Willett, 2003). To eliminate the need to delete individuals with missing data, and consequently increase statistical power, full information maximum likelihood (FIML) estimation was used.
To ascertain the best-fitting models of growth in child EF, two unconditional models were first specified for each EF indicator: 1) Model A (i.e., fixed linear model), which included the fixed effect of child exact age in months, coded such that the intercept represented average EF performance at the first assessment and the slope represented the average monthly decrease or increase in EF performance, and 2) Model B (i.e., random linear model), which included the random effect of time (i.e., between-person variability in individual intercepts and slopes). Using child exact age in months at each assessment point enabled us to flexibly handle individually varying time scores and to estimate change in child EF across a broad range of ages (from 67 to 112 months of age). Next, a fixed quadratic term was added (Model C: fixed quadratic model) to explore whether there was a significant decrease or increase in the slope across time (i.e.,
indicating a decreasing or increasing curvilinear trajectory). A quadratic model can be estimated with as few as three time points (Hoffman, 2015). However, the variance of the quadratic term needs to be fixed to zero (fixed quadratic model). Thus, the quadratic slope was not allowed to vary. Random effects and quadratic terms were retained if the pertinent p-value for the estimates
were < .05 or if the model’s log likelihood (LL) differed significantly with the addition of the random or quadratic slope terms, based on a chi-square difference test.
Once the trajectory of each EF task performance over time was established, we fit a series of nested multilevel models in which we tested the effect of each predictor (potential covariates and child attachment security) on the intercept and slope. Continuous predictors were centered on their mean for ease of interpretation. Therefore, the intercept represents the estimated initial status for an individual with an average value for that predictor. In order to draw conservative and specific predictions, potential covariates which are often found to be associated with child
attachment or EF (maternal education, child gender, and child birthweight), were first added to the growth models (Models D). In order to estimate the most parsimonious models, only the variables that were significant or that improved the fit of the prediction model (Singer &
Willett, 2003) were retained. The composite score of child attachment security was entered next as predictor of children’s EF intercept and slope (Models E).
Results
Descriptive Overview
The mean score for attachment security was .50 (SD =.20). Table 1 presents the means, ranges, correlations across time points, and inter-correlations among the EF tasks. The low to moderate coefficients of stability for EF tasks indicated changes in inter-individual differences across time. These changes suggest the presence of between-person differences in
intra-individual patterns of growth in child EF across time, which will be examined next with
multilevel growth modeling. Higher accuracy on the DCCS task was also found to be associated with higher accuracy on the Flanker task at every time point, whereas performance on the Backward span task did not correlate with performance on the other tasks between T4 and T6. Preliminary screening of the data also revealed the presence of ceiling effects on the Flanker.
Ceiling effects occur when more than 20% of individuals obtain the maximum score for an outcome (Wang, Zhang, MacArdle, & Salthouse, 2009), and thus the true extent of their abilities cannot be determined (i.e., because the test has insufficient range, some observed scores
constitute underestimations). In kindergarten, 27% of the participants performed at ceiling level on the Flanker task. Ceiling effects can induce bias in the results, which may lead to incorrect model selection and biased parameter estimation (Wang et al., 2009). The Tobit growth curve model has been demonstrated to perform very well in dealing with ceiling effects compared to the standard growth curve model (Wang et al., 2009). Therefore, as a sensitivity check, the Flanker data were analyzed using standard growth models as well as censored growth models and the results obtained with these two statistical approaches were compared.
Describing Child EF Growth Curves
On the Flanker task, the best-fitting unconditional model was a random linear model (see Model B in Table 2), indicating a consistent increase in accuracy across time. On average, child accuracy increased by 0.35% (γ10) per month (4.20% per year), starting at 87.65% (γ00) on
average in kindergarten. The significant negative covariance between the slope and the intercept indicated that children with better initial performance displayed slower growth (𝜎01= -13.80). However, there was significant between-person variability around the initial status ( = 388.12) and the rate of change (𝜎12= .49). The ICC (.33) indicated that the average stability across time was moderate. The impact of ceiling effects was assessed by comparing the results obtained with standard and Tobit growth models. The estimated parameters did not differ substantially across the two methods. Thus, only the results of the standard growth models are presented in Table 2.
The best-fitting unconditional model for Backward word/digit span was a fixed quadratic model, where growth decelerated over time (see Model C in Table 2). Thus, performance on
Backward followed an increasing curvilinear trajectory. On average, child accuracy increased by 0.15 (γ10) per month (1.80 per year), starting at 3.47 (γ00) on average in kindergarten. However,
there was significant between-person variability around the initial status ( = .84), and there was significant decrease in the rate of change with each 1-month increment in age: children’s monthly growth in performance decelerated by .004 (𝛾20 = 0.002) per month, corresponding to a
0.60 decrease in the annual rate of change. The ICC indicated that the relative stability of performance on the Backward task across time was low (ICC =.18).
The best fitting model for the DCCS was a random linear model (see Model B in Table 2). The average child experienced an increase of 0.58% (γ10) in performance per month (7% per
year), starting at 70.96% (γ00)in kindergarten. The significant negative covariance between the
slope and the intercept indicated that children with better initial performance on the DCCS task displayed slower growth (𝜎01= -24.95). However, there was significant between-person
variability around the initial status ( = 712.61) and the rate of change (𝜎12= .88). The ICC indicated that there was no stability in child performance across assessment waves (ICC =.02).
Predicting Child EF Growth Curves
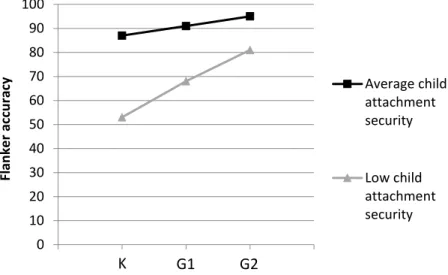
Table 3 shows the conditional models predicting each EF task trajectory. The results indicated a significant relation between child attachment security and the initial status of Flanker accuracy, where every one-standard-deviation increase in attachment security was associated with a 27.57% (p < .01) increase in Flanker initial accuracy. Child attachment security did not interact with time; thus, child Flanker task accuracy remained consistently higher across time for children with higher levels of attachment security. In order to better describe this consistency, we ran additional analyses in which time was recoded so that the intercept was placed in Grades 1 and 2. Results indicated that every one-standard-deviation increase in attachment security was
associated with a 17.34% (p < .001) increase in Flanker performance in Grade 1, and 11.83% (p < .001) in Grade 2. Thus, higher child attachment security was associated with higher
performance on the Flanker task at every age. The potential impact of ceiling effects on the relation between attachment and Flanker performance was however assessed by comparing the results obtained with standard growth models and Tobit growth models. In the Tobit models, the coefficient of the relation between attachment and performance on the Flanker was found to be 36.41% (p < .01) in kindergarten, 22.33% (p < .001) in Grade 1, and 15.17% (p < .01) in Grade 2 (see Figure 1). Thus, the relation between attachment and performance on the Flanker was underestimated in the normal growth curve model. Examination of the data revealed that the performance of children with high attachment security scores (one standard deviation above the mean) reached ceiling level, which could have led to underestimation of their real potential and of the relation between attachment and Flanker performance. Note, however, that only 9% of children obtained an attachment score one standard deviation above the mean. Given also their ceiling performance on the Flanker, their trajectory was not illustrated in the figures.
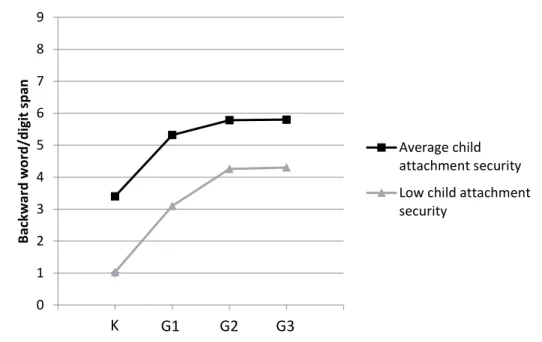
Child attachment security was also associated with the initial status of Backward word/digit span. Every one-standard-deviation increase in child attachment security was
associated with a 2.37-point (p < .001) increase in Backward word/digit span performance initial status. Child attachment security did not interact significantly with time; thus, child performance remained consistently higher across time for children with higher levels of early attachment security. The relation between attachment security (computed by moving the intercept as
described above) and the performance on Backward word/digit span was 2.07 (p < .001) in Grade 1, 1.69 (p < .001) in Grade 2, and 1.37 (p < .001) in Grade 3 (see Figure 2).
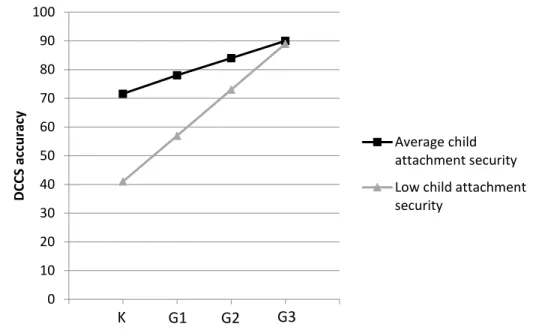
The relation between attachment security and the initial status of DCCS was also significant. Every one-standard-deviation increase in attachment security was associated with a
30.55 % (p < .05) increase in DCCS performance in kindergarten. Although non-significant, the negative relation between attachment and the rate of change in DCCS performance approached significance (𝛾14 = -1.06, p = .05). This suggests that the relation between attachment and child
performance might attenuate over time. In order to examine this attenuation, we ran analyses in which the intercept was placed in Grades 1, 2, and 3. Results indicated that the relation between attachment security and DCCS performance was still significant in Grade 1 (B = 21.45, p < .05), marginally significant in Grade 2 (B = 9.82, p = .08) and non-significant in Grade 3 (B = 0.30, ns). Thus, higher child attachment security was associated with higher performance on the DCCS at younger ages, but this association became non-significant across time (see Figure 3).
Discussion
EF skills are likely to set young children on a developmental pathway that may impact their school trajectory for years to come (Moffitt et al., 2011). Thus, it is vital to understand developmental trajectories of child EF and the environmental factors that may promote those trajectories during early elementary school. The aim of this study was to describe developmental patterns of growth in EF across early elementary school and to examine the capacity of mother-child attachment security, assessed almost five years prior to school entry, to predict individual differences in these growth patterns. Findings suggested that 1) early elementary school is a period of significant developmental improvement in child EF, 2) child performance on different EF tasks shows distinct patterns of growth across time, and 3) early attachment security is generally associated with higher performance on EF tasks throughout early elementary school.
Development of Child EF during Early Elementary School
Individual differences in EF skills are related to several aspects of human development at different ages (Diamond, 2013). Accurate understanding of normal EF development constitutes an important target for developmental research, as it can help prevent later developmental
problems in allowing earlier identification of deviations from normative development, thus improving diagnostic capabilities (Anderson, 2002). Consistent with previous studies that have examined change in EF during the early school years (Best & Miller, 2010; Hackman et al., 2015; Lee et al., 2013; Roskam et al., 2014), the results of the present study revealed an overall increase in child EF performance between kindergarten and Grade 3. Thus, early elementary school appears to be a period of developmental improvement in EF that may provide a
particularly appropriate window for intervention. However, consistent with the low to moderate stability of child EF performance across time found in this and previous studies (Karalunas, Bierman, & Huang-Pollock, 2016), findings also indicated significant inter-individual differences in patterns of growth in child EF. Rapid pace of maturation may result in variability in inter-individual differences across time if the rate of development is not consistent across inter-individuals. This is congruent with our results indicating that child EF performance increase on average across time (significant rate of change) although children do not tend to maintain their position relative to other children across time (low correlations) because of different developmental pace, as indicated by significant between-person variability around the rate of change.
Patterns of Growth in Child EF
One unique advantage of the present study was the ability to examine developmental patterns of growth in child performance on three tasks that measure different executive skills: inhibitory control, working memory, and set-shifting. Findings indicated distinct patterns of growth in children’s performance on tasks measuring different EF skills. More specifically, we found that child performance on the Flanker and DCCS followed an increasing linear trajectory, as indicated by a constant rate of change. In contrast, child performance on the Backward word/digit span task followed an increasing curvilinear trajectory, indicated by a significant decrease in the rate of growth. A significant decrease in the rate of growth in child performance
on a different task also measuring working memory skills has been found previously between kindergarten and Grade 3 (Hackman et al., 2015). These results suggest rapid developmental improvement in working memory capacity during the very first years of elementary school (perhaps due to schooling itself) that decelerates over time, before levelling off around Grade 3. According to previous studies, working memory is the first EF skill to develop (Garon et al., 2008). Thus, the curvilinear trajectory might reflect the fact that children develop much of this ability during the very first years of elementary school and reach a plateau in middle childhood. However, adults’ performance on Backward span tasks suggests that working memory continues to develop well beyond early school years. Meta-analytic data show that on average, adults reach the fifth level on the Backward span tasks (Bopp & Verhaeghen, 2006). In the current study, children in Grade 3 reached the third level. Thus, working memory will continue to develop well beyond the time period covered by this study, before reaching adult levels.
For both the Flanker and DCCS tasks, growth in child performance followed a linear trajectory. Thus, in contrast to the working memory skills measured by the Backward span task, the inhibition and set-shifting skills measured by the Flanker and the DCCS tasks grow at a constant rate during early school years. The similar shape of growth on the Flanker and DCCS might suggest that the skills measured by these tasks are inter-dependent. Consistent with this assumption, higher accuracy on the Flanker was linked to higher accuracy on the DCCS at every time point. However, DCCS accuracy was approximately 17% below Flanker accuracy in kindergarten, and remained consistently lower across time. These differences suggest that children develop the capacity to inhibit prepotent responses (such as on the Flanker) earlier than the capacity to flexibly switch between sets of behaviors (such as on the DCCS). This is
consistent with the results of a recent study that found that improvements in inhibitory control were more rapid than those in set-shifting during preschool years (Clark et al., 2013).
Set-shifting, assessed here with the DCCS, is considered the most complex EF skill. According to Garon et al. (2008), this skill is built on other EF skills. In fact, inhibition plays an important role in DCCS performance given that switching sorting criteria in order to perform well on the DCCS requires inhibition of the tendency to continue to attend to the initially relevant attribute
(Diamond, Carlson, & Beck, 2005). In this respect, the ability to perform tasks involving set-shifting such as the DCCS is expected to develop later than the ability to perform tasks involving basic inhibitory control such as the Flanker. This is consistent with the disparities observed here between the growth curves of children’s performance on the Flanker and DCCS tasks.
The results, however, showed that most children reached ceiling around ages 6-7 for the Flanker. In order to avoid biased parameter estimation that can result from ceiling effects, Tobit growth curves were used in combination with normal growth curves (Wang et al., 2009).The results of unconditional models were similar across both statistical approaches. Even if most children reached ceiling level across time on the Flanker task, the non-significant quadratic terms (found in both the normal and Tobit growth curve models) indicate constant growth in the
underlying executive skills measured by the Flanker during early school years. Hence, whereas the ceiling effects suggest that the specific skills necessary to succeed on the Flanker are completely developed by the end of the early school years, the constant rate of change suggests that inhibition capacities themselves will continue to develop well beyond this time period. Given that the shape of growth in inhibition during school years has never been examined before using growth modeling, we cannot rely on previous research to draw stronger or more nuanced
conclusions. However, the ceiling effects clearly highlight the need to transition to more developmentally sensitive EF batteries that can be used across a broad age range, such as the recently developed National Institutes of Health Toolbox Cognition Battery (Zelazo et al., 2013).
In sum, the results of the present study support the idea of distinct patterns of growth in children’s performance on tasks measuring different EF skills. This is consistent with the results of a recent study that found task-specific differences in age-related changes in EF between early elementary school and adolescence (Lee et al., 2013). Combined with factor-analytic work with children suggesting that EF can be divided into partially independent components (Miyake et al., 2000), these results are consistent with the idea that EF consists of a diverse set of loosely related skills. However, it is important to mention that firm conclusions about the development of
specific EF skills per se cannot be drawn using a single task to measure each skill. While it is important to examine changes in performance on different EF tasks across time (Clark et al., 2013; Garon et al., 2008), no task is a pure measure of its intended construct (task impurity). Different tasks postulated to measure the same EF skill can involve different underlying
cognitive processes of different levels of complexity, and task difficulty is often confounded with the specific executive skill measured (Miyake et al., 2000). Thus, because only one task was used here to assess each putative EF skill, it cannot be ascertained to what extent the observed patterns reflect growth in child performance on the specific tasks used or more general developmental progression in the EF skills that underlie performance on these tasks. More complex tasks with different cognitive requirements that are postulated to measure the same EF skills might show different associations and patterns of growth across time. Thus, other tasks measuring inhibition, working memory, and set-shifting skills need to be used in future research in order to draw more solid conclusions about the patterns of growth in specific EF skills across the early school years.
Attachment Security as a Predictor
In line with emerging evidence suggesting that the affective quality of parent-child
relationships may relate to individual differences in young children’s EF (Kraybill & Bell, 2013), the results showed that between-person variability in growth patterns of children’s EF was
reliably associated with the quality of their earlier attachment relationships. First, children who were more securely attached to their mother on average between 15 months and 2 years showed superior performance on the Flanker, Backward, and DCCS tasks in kindergarten. The significant relations between attachment and child initial performance on three tasks measuring different EF skills appear to suggest that secure attachment relationships may promote young children’s global executive competence (and/or the skills or structures that subsume all EF skills), rather than have specific effects on particular EFs. It is believed that secure attachment relationships provide children with repeated experiences of successful dyadic regulation with the support of a competent caregiver (Sroufe, 1996). With time, securely attached children are expected to gradually internalize the regulatory strategies learned with the caregiver and eventually use them independently (Calkins, 2004), such as during EF tasks that require independent self-regulation. Hence, secure attachment relationships may provide children with emotional and cognitive skills supporting their developing self-regulatory capacities and thus their executive development.
Furthermore, in the case of the Flanker and Backward tasks, the link between attachment and child performance persisted and remained significant throughout the subsequent time points. Despite the ceiling effects of the Flanker, this conclusion was corroborated by the Tobit models. In contrast, the link between child attachment security and DCCS performance waned gradually (as observed by moving the intercept), such that less securely attached children appeared to catch up with their more securely attached counterparts, performing equally well in Grade 3. These diverging findings may have to do with the relative complexity of the underlying EF skills. The DCCS is fairly demanding on executive capacity, and may therefore reasonably be presumed to be under the influence of a complex set of factors, of which early attachment may become an increasingly modest portion as children grow up. Hence, the narrowing disparities between more and less securely attached children across early elementary school on this demanding task might
be the result of other biological and social influences, as well as schooling itself, compensating for earlier parent-child relationship experiences. However, as the negative link between
attachment and the DCCS slope was only marginally significant, a degree of uncertainty remains about the overall attenuation of the effect of attachment. Given that this study is the first to examine the enduring associations between early attachment security and patterns of child EF development, the current results need to be replicated before one can draw solid conclusions about the persistence of the effect of attachment on different EF skills.
Previous studies on this sample when children were toddlers and preschoolers revealed that early mother–child attachment security was related to age-specific individual differences in subsequent child EF (references masked for blind review). Although we could not statistically combine these EF data with the current ones because the EF tasks used were different, connecting the current results with the previous ones suggests that the association between early attachment security and child EF emerges early on and tends to persist into middle childhood (albeit with a declining trend on the DCCS). Moreover, effect sizes were quite substantial on all three tasks: with every one-standard-deviation increase in attachment security, children’s kindergarten performance increased by over 30% on the DCCS and Flanker, and by more than two succeeded trials on the Backward task. As a result, children with high levels of attachment security (one standard deviation above the mean) entered kindergarten with the equivalent of a 2- to 3-year executive advantage over their peers. Given the well-documented importance of executive skills for school adaptation and academic achievement including at school entry (Bierman et al., 2008; Blair & Raver, 2015), securely attached children appear likely to enter school embarked on a promising trajectory that could have long-lasting implications for their school success.
Although the multi-wave longitudinal design, the observational measures, and the advanced statistical approach used in this study are important strengths, there were also some limitations. First, the homogeneous and low-risk nature of the sample limits the generalizability of the results. Moreover, the sample was relatively small; however, the growth modeling
approach used here was chosen based on its demonstrated capacity to yield unbiased and accurate estimates with small samples. According to simulation studies, only sample sizes of 50 or less can result in biased estimates in multilevel modeling (Maas & Hox, 2005). A different issue is that the DCCS and Backward tasks were administered in a slightly different format at age 5 (kindergarten) compared to latter time points. While this was desirable, given that EF tasks need to be adapted to remain age-appropriate (see e.g., the NIH Toolbox, Zelazo et al., 2013), the possibility that a change in measures may have led to changes in results cannot be discarded. However, the results were very much the same when considering only the three time points involving the exact same measurement format – as illustrated, for instance, by the analyses in which the intercept was set at the Grade 1 rather than kindergarten assessment, presented above.
Importantly, the current design was longitudinal yet correlational; therefore, the associations observed may not be indicative of causal relations between attachment and EF. Consistent with the moderate heritability that has been reported for certain EF skills (Polderman et al., 2007), one may argue that genetic characteristics could account for both child attachment and EF performance. Although the low heritability reported for attachment (Roisman & Fraley, 2008) does not support this hypothesis, only genetically sensitive designs could assess it
formally. Moreover, because the processes underlying these links were not investigated, we can only speculate regarding putative causal mechanisms. For instance, secure attachment
relationships are presumed to favor children’s EF by facilitating the development of the underlying neural systems (Glaser, 2000), and research indicates that higher-quality maternal
behavior in infancy predicts more rapid development of the frontal brain areas that subsume EF (Bernier, Calkins, & Bell, 2016). Thus, secure attachment may impact child EF by promoting the orderly development of its neural substrates. This hypothesis could, however, not be tested here.
Conclusion
Overall, the current findings add importantly to the theoretical case for the important role of early parent-child attachment relationships in children’s executive development, and further suggest that such a role may be relatively enduring (although not increasing). However, longer follow-ups are necessary to continue investigating whether differences in EF performance between more and less securely attached children eventually disappear, as would be predicted by revisionist scholars (e.g., Bruer, 2002; Lewis, 1997), or rather diminish but persist, as suggested by analyses of similar questions with large longitudinal datasets (Fraley et al., 2013). Answers to these fundamental questions may, in fact, differ across EF skills, as suggested by the fact that significant links between attachment and EF disappeared with time on only one of the three tasks used here. In any case, even vanishing initial effects can be consequential, notably because skill acquisition builds on already-existing skills, forming developmental cascades (Masten & Cicchetti, 2010). Considering also that early social and academic adjustment shows a tendency toward stability over several years (Jiang & Cillessen, 2005; Ladd & Troop-Gordon, 2003), the residue left by early caregiving experiences on children’s EF may snowball into profound and lasting effects on their schooling trajectories (McCartney & Rosenthal, 2000).
References
Alloway, T. P., & Alloway, R. G. (2010). Investigating the predictive roles of working memory and IQ in academic attainment. Journal of Experimental Child Psychology, 106, 20-29. doi:10.1016/j.jecp.2009.11.003
Alloway, T. P., Gathercole, S. E., & Pickering, S. J. (2006). Verbal and visuospatial short‐term and working memory in children: Are they separable? Child Development, 77, 1698-1716. doi:10.1111/j.1467-8624.2006.00968.x
Anderson, P. (2002). Assessment and development of executive function (EF) during childhood. Child Neuropsychology, 8, 71-82. doi:10.1076/chin.8.2.71.8724
Bernier, A., Beauchamp, M. H., Carlson, S. M., & Lalonde, G. (2015). A secure base from which to regulate: Attachment security in toddlerhood as a predictor of executive functioning at school entry. Developmental Psychology, 51, 1177-1189. doi:10.1037/dev0000032 Bernier, A., Calkins, S. D., & Bell, M. A. (2016). Longitudinal associations between the quality
of mother–infant interactions and brain development across infancy. Child Development. doi:10.1111/cdev.12518
Bernier, A., Carlson, S. M., Deschênes, M., & Matte‐Gagné, C. (2012). Social factors in the development of early executive functioning: A closer look at the caregiving environment. Developmental Science, 15, 12-24. doi:10.1111/j.1467-7687.2011.01093.x
Best, J. R., & Miller, P. H. (2010). A developmental perspective on executive function. Child Development, 81, 1641-1660. doi:10.1111/j.1467-8624.2010.01499.x
Bierman, K. L., Nix, R. L., Greenberg, M. T., Blair, C., & Domitrovich, C. E. (2008). Executive functions and school readiness intervention: Impact, moderation, and mediation in the Head Start REDI program. Development and Psychopathology, 20, 821-843.
Bindman, S. W., Hindman, A. H., Bowles, R. P., & Morrison, F. J. (2013). The contributions of parental management language to executive function in preschool children. Early
Childhood Research Quarterly, 28, 529-539. doi:10.1016/j.ecresq.2013.03.003 Blair, C. (2002). School readiness: Integrating cognition and emotion in a neurobiological
conceptualization of children's functioning at school entry. American Psychologist, 57(2), 111-127. doi:10.1037/0003-066X.57.2.111
Blair, C., & Raver, C. C. (2015). School readiness and self-regulation: A developmental psychobiological approach. Annual Review of Psychology, 66, 711-731.
doi:10.1146/annurev-psych-010814-015221
Bopp, K. L., & Verhaeghen, P. (2005). Aging and verbal memory span: A meta-analysis. The Journals of Gerontology: Series B, 60, 223-233. doi:10.1093/geronb/60.5.p223
Bruer, J. T. (2002). The myth of the first three years: A new understanding of early brain development and lifelong learning. New York, NY: Free Press.
Burchinal, M. R., Nelson, L., & Poe, M. (2006). IV. Growth curve analysis: An introduction to various methods for analyzing longitudinal data. Monographs of the Society for Research in Child Development, 71, 65-87. doi:10.1111/j.1540-5834.2006.00405.x
Calkins, S. D. (2004). Early attachment processes and the development of self-regulation. In R.F. Baumeister & K.D. Vohs (Eds.), Handbook of self-regulation: Research, theory and applications (pp. 324–339). New York, NY: Guilford Press.
Camerota, M., Willoughby, M. T., Cox, M., Greenberg, M. T., & Family Life Project
Investigators. (2015). Executive function in low birth weight preschoolers: The moderating effect of parenting. Journal of Abnormal Child Psychology, 43, 1551-1562.
Carlson, S. M., & Harrod, J. (2013). Validation of the executive function scale for early childhood. In J. Griffin (Chair), Developing the next generation of preschool outcome measures: The interagency school readiness measurement consortium. Poster symposium presented at the biennial meeting of the Society for Research in Child Development. Seattle, WA.
Carlson, S. M., Moses, L. J., & Breton, C. (2002). How specific is the relation between executive function and theory of mind? Contributions of inhibitory control and working memory. Infant and Child Development, 11, 73-92. doi:10.1002/icd.298
Clark, C. A., Sheffield, T. D., Chevalier, N., Nelson, J. M., Wiebe, S. A., & Espy, K. A. (2013). Charting early trajectories of executive control with the shape school. Developmental Psychology, 49, 1481-1493. doi:10.1037/a0030578
Cowan, P. A., & Heming, G. (2005). How children and parents fare during transition to school. In P. A. Cowan, C. P. Cowan, J. C. Ablow, V. K. Johnson, & J. R. Measelle (Eds.), The family context of parenting in children's adaptation to elementary school (pp.79-118). Mahwah, NJ: Lawrence Erlbaum Associates.
Davis, H. L., & Pratt, C. (1996). The development of children’s theory of mind: The working memory explanation. Australian Journal of Psychology, 47, 25-31.
doi:10.1080/00049539508258765
De Luca, C. R., & Leventer, R. J. (2008). Developmental trajectories of executive functions across the lifespan. In V. Anderson, R. Jacobs, & P. J. Anderson (Eds.), Executive functions and the frontal lobes: A lifespan perspective (pp. 23-53). New York, NY: Taylor & Francis. Diamond, A. (2013). Executive functions. Annual Review of Psychology, 64, 135–168.
Diamond, A., Carlson, S. M., & Beck, D. M. (2005). Preschool children's performance in task switching on the dimensional change card sort task: Separating the dimensions aids the ability to switch. Developmental Neuropsychology, 28, 689-729.
doi :10.1207/s15326942dn2802_7
Fay‐Stammbach, T., Hawes, D. J., & Meredith, P. (2014). Parenting influences on executive function in early childhood: A review. Child Development Perspectives, 8, 258-264. doi:10.1111/cdep.12095
Fearon, R. P., Bakermans‐Kranenburg, M. J., Van IJzendoorn, M. H., Lapsley, A. M., & Roisman, G. I. (2010). The significance of insecure attachment and disorganization in the development of children’s externalizing behavior: A meta‐analytic study. Child
Development, 81, 435-456. doi:10.1111/j.1467-8624.2009.01405.x
Fraley, R. C., Roisman, G. I., & Haltigan, J. D. (2013). The legacy of early experiences in development: Formalizing alternative models of how early experiences are carried forward over time. Developmental Psychology, 49, 109-126. doi:10.1037/a0027852
Garon, N., Bryson, S. E., & Smith, I. M. (2008). Executive function in preschoolers: A review using an integrative framework. Psychological Bulletin, 134, 31-60. doi:10.1037/0033-2909.134.1.31
Garon, N., Smith, I. M., & Bryson, S. E. (2014). A novel executive function battery for preschoolers: Sensitivity to age differences. Child Neuropsychology, 20, 713-736. doi:10.1080/09297049.2013.857650
Glaser, D. (2000). Child abuse and neglect and the brain—a review. Journal of Child Psychology and Psychiatry, 41, 97-116. doi:10.1111/1469-7610.00551
Grossmann, K., Grossmann, K., & Waters, E. (2005). Attachment from infancy to adulthood: The major longitudinal studies. New York, NY: Guilford Publications.
Hackman, D. A., Betancourt, L. M., Gallop, R., Romer, D., Brodsky, N. L., Hurt, H., & Farah, M. J. (2014). Mapping the trajectory of socioeconomic disparity in working memory: Parental and neighborhood factors. Child Development, 85, 1433-1445.
doi:10.1111/cdev.12242
Hackman, D. A., Gallop, R., Evans, G. W., & Farah, M. J. (2015). Socioeconomic status and executive function: Developmental trajectories and mediation. Developmental Science, 18, 686-702. doi:10.1111/desc.12246
Hoffman, L. (2015). Longitudinal analysis: Modeling within-person fluctuation and change. New York, NY: Routledge.
Jiang, X. L. & Cillessen, A.H.N. (2005). Stability of continuous measures of sociometric status: A meta-analysis. Developmental Review, 25, 1-25. doi:10.1016/j.dr.2004.08.008
Karalunas, S. L., Bierman, K. L., & Huang-Pollock, C. L. (2016). Test–retest reliability and measurement invariance of executive function tasks in young children with and without ADHD. Journal of Attention Disorders. Advance online publication.
doi:1087054715627488
Kraybill, J. H., & Bell, M. A. (2013). Infancy predictors of preschool and post‐kindergarten executive function. Developmental Psychobiology, 55, 530-538. doi:10.1002/dev.21057 Ladd, G.W., & Troop-Gordon, W. (2003). The role of chronic peer difficulties in the
development of children's psychological adjustment problems. Child Development, 74, 1344-1367. doi:10.1111/1467-8624.00611
Lee, K., Bull, R., & Ho, R. M. (2013). Developmental changes in executive functioning. Child Development, 84, 1933-1953. doi:10.1111/cdev.12096
Lewis, M. (1997). Altering fate: Why the past does not predict the future. New York, NY: Guilford Press.
Maas, C. J., & Hox, J. J. (2005). Sufficient sample sizes for multilevel modeling. Methodology, 1, 86-92. doi:10.1027/1614-2241.1.3.86
Masten, A. S., & Cicchetti, D. (2010). Developmental cascades. Development and Psychopathology, 22, 491-495. doi:10.1017/s0954579410000222
McCartney, K., & Rosenthal, R. (2000). Effect sizes, practical importance and social policy for children. Child Development, 71, 173–180. doi:10.1111/1467-8624.00131
Miyake, A., Friedman, N. P., Emerson, M. J., Witzki, A. H., Howerter, A., & Wager, T. D. (2000). The unity and diversity of executive functions and their contributions to complex “frontal lobe” tasks: A latent variable analysis. Cognitive Psychology, 41, 49-100.
doi:10.1006/cogp.1999.0734
Moffitt, T. E., Arseneault, L., Belsky, D., Dickson, N., Hancox, R. J., Harrington, H., ... & Sears, M. R. (2011). A gradient of childhood self-control predicts health, wealth, and public safety. Proceedings of the National Academy of Sciences, 108, 2693-2698.
doi:10.1073/pnas.1010076108
Müller, U., Kerns, K. A., & Konkin, K. (2012). Test–retest reliability and practice effects of executive function tasks in preschool children. The Clinical Neuropsychologist, 26, 271-287. doi:10.1080/13854046.2011.645558
Pederson, D. R., & Moran, G. (1995). A categorical description of infant‐mother relationships in the home and its relation to Q‐sort measures of infant‐mother interaction. Monographs of the Society for Research in Child Development, 60, 111-132. doi:10.2307/1166174 Polderman, T. J., Posthuma, D., De Sonneville, L. M., Stins, J. F., Verhulst, F. C., & Boomsma,
D. I. (2007). Genetic analyses of the stability of executive functioning during childhood. Biological Psychology, 76, 11-20. doi:10.1016/j.biopsycho.2007.05.002
Roisman, G. I., & Fraley, R. C. (2008). A behavior-genetic study of parenting quality, infant attachment security, and their covariation in a nationally representative sample.
Developmental Psychology, 44, 831-839. doi:10.1037/0012-1649.44.3.831
Roskam, I., Stievenart, M., Meunier, J. C., & Noël, M. P. (2014). The development of children’s inhibition: Does parenting matter? Journal of Experimental Child Psychology, 122, 166-182. doi:10.1016/j.jecp.2014.01.003
Rueda, M. R., Fan, J., McCandliss, B. D., Halparin, J. D., Gruber, D. B., Lercari, L. P., & Posner, M. I. (2004). Development of attentional networks in childhood. Neuropsychologia, 42, 1029-1040. doi:10.1016/j.neuropsychologia.2003.12.012
Sameroff, A. J., & Haith, M. (1996). The five to seven year shift: The age of reason and responsibility. New York, NY: Oxford University Press.
Singer, J. D., & Willett, J. B. (2003). Applied longitudinal data analysis: Modeling change and event occurrence. New York, NY: Oxford University Press.
Sroufe, A. (1996). Attachment: The dyadic regulation of emotion. In A. Sroufe (Ed.), The organization of emotional life in the early years (pp.172-191). New York, NY: Cambridge University Press.
Ursache, A., Blair, C., & Raver, C. C. (2012). The promotion of self‐regulation as a means of enhancing school readiness and early achievement in children at risk for school failure. Child Development Perspectives, 6, 122-128. doi:10.1111/j.1750-8606.2011.00209.x Van IJzendoorn, M. H., Vereijken, C. M., Bakermans-Kranenburg, M. J., & Riksen-Walraven, J.
M. (2004). Assessing attachment security with the Attachment Q-Sort: Meta-analytic evidence for the validity of the observer AQS. Child Development, 75, 1188-1213. doi:10.1111/j.1467-8624.2004.00733.x
Wang, L., Zhang, Z., McArdle, J. J., & Salthouse, T. A. (2009). Investigating ceiling effects in longitudinal data analysis. Multivariate Behavioral Research, 43(3), 476–496.
doi:10.1080/00273170802285941
Waters, E. (1995). Appendix A: The attachment Q‐set (version3.0). Monographs of the Society for Research in Child Development, 60, 234-246. doi:10.1111/j.1540-5834.1995.tb00214.x Wiebe, S. A., Sheffield, T. D., & Espy, K. A. (2012). Separating the fish from the sharks: A
longitudinal study of preschool response inhibition. Child Development, 83, 1245-1261. doi:10.1111/j.1467-8624.2012.01765.x
Willoughby, M. T., Wirth, R. J., & Blair, C. B. (2012). Executive function in early childhood: Longitudinal measurement invariance and developmental change. Psychological
Assessment, 24, 418-431. doi:10.1037/a0025779
Wolff, M. S., & van IJzendoorn, M. H. (1997). Sensitivity and attachment: A meta‐analysis on parental antecedents of infant attachment. Child Development, 68, 571-591.
doi:10.1111/j.1467-8624.1997.tb04218.x
Zelazo, P. D. (2006). The dimensional change card sort (DCCS): A method of assessing executive function in children. Nature Protocols, 1, 297-301. doi:10.1038/nprot.2006.46 Zelazo, P. D., Anderson, J. E., Richler, J., Wallner‐Allen, K., Beaumont, J. L., & Weintraub, S.
(2013). II. NIH toolbox cognition battery (CB): Measuring executive function and attention. Monographs of the Society for Research in Child Development, 78, 16-33. doi:10.1111/mono.12032
Zelazo, P. D., & Carlson, S. M. (2012). Hot and cool executive function in childhood and adolescence: Development and plasticity. Child Development Perspectives, 6, 354-360. doi:10.1111/j.1750-8606.2012.00246.x
Table 1
Descriptive Statistics, Correlations across Time Points, and Inter-Correlations among the Executive Function Tasks
t p < .10,* p < .05, ** p < .01, *** p < .001.
Age M Range Correlations across age
Inter-correlations among tasks G1 G2 G3 Backward DCCS Flanker Kindergarten 87% 22-100% .52*** .41*** -- .30* .25* Grade 1 (G1) 91% 63-100% -- .74** -- .15 .35** Grade 2 (G2) 95% 75-100% -- -- -- .00 .19* Backward Kindergarten 4.00 0-8 .25* .11 .28* -- .25** Grade 1 (G1) 4.51 3-9 -- .30** .27* -- .05 Grade 2 (G2) 5.16 3-10 -- -- .17 -- .03 Grade 3 (G3) 5.66 2-9 -- -- -- -- .02 DCCS Kindergarten 70% 0-100% .00 .05 .10 -- -- Grade 1 (G1) 76% 50-97% -- .38* .20 -- -- Grade 2 (G2) 83% 50-100% -- -- .09 -- -- Grade 3 (G3) 88% 37-100% -- -- -- -- --
GROWTH IN EXECUTIVE FUNCTIONING 36 Table 2
Unconditional Growth Models of Child EF during Early Elementary School
t p < .10,* p < .05, ** p < .01, *** p < .001. Note. Standard errors are within parentheses. K = kindergarten; ICC = Intraclass
Correlation; Par = parameters; LL = log likelihood; AIC = Akaike information criterion; BIC = Bayesian information criterion; Model A: fixed linear model; Model B: random linear model; Model C: fixed quadratic model.
Child Executive Functioning
Flanker (ICC = .33) Backward (ICC=.18) DCCS (ICC=.02)
Par Model A Model B Model C Model A Model B Model C Model A Model B Model C Fixed effects Initial status, π0i Intercept (K) 𝛾00 87.29*** (1.49) 87.65*** (2.081) 86.58*** (2.29) 4.00*** (0.15) 4.01*** (0.16) 3.47*** (0.20) 70.80*** (2.15) 70.96*** (2.91) 69.30*** (3.41) Rate of change, π1i Linear slope 𝛾10 0.36*** (0.08) 0.35*** (0.08) 0.57** (0.21) 0.06*** (0.01) 0.06*** (0.01) 0.15*** (0.02) 0.59*** (0.10) 0.575*** (0.113) 0.83** (0.29) Change in slope (quadratic) 𝛾20 -0.01 (0.01) -0.002*** (0.001) -0.01 (0.01) Variance components Within-person (residual) 𝜎𝐸2 114.09*** (14.94) 41.05*** (7.58) 39.73*** (8.000) 1.77*** (0.17) 1.72*** (0.20) 1.56*** (0.18) 423.54*** (42.82) 207.11*** (23.80) 201.85*** (23.96) In initial status 𝜎02 61.61*** (19.84) 388.18*** (67.54) 387.22*** (67.43) 0.48*** (0.16) 0.81* (0.41) 0.84* (0.39) 13.56 (30.33) 712.61*** (134.23) 414.20*** (133.53) In rate of change 𝜎12 0.49*** (0.14) 0.49*** (0.14) 0.00 (0.00) 0.00 (0.00) 0.88*** (0.23) 0.87*** (0.26) Slope intercept covariance 𝜎01 -13.80*** (2.90) -13.69*** (2.89) -0.01 (0.02) -0.01 (0.01) -24.97*** (5.23) -24.95*** (5.16) Goodness-of-fit LL -962.03 -907.93 -904.75 -560.26 -559.66 -548.31 -1341.79 -1305.02 -1301.96 AIC 1932.06 1827.86 1823.50 1128.52 1131.33 1110.62 2691.58 2622.04 2617.92 BIC 1946.03 1848.82 1847.95 1143.48 1153.76 1136.79 2706.41 2644.28 2643.86
GROWTH IN EXECUTIVE FUNCTIONING 37 Table 3
Predicting Patterns of Growth in Child EF during Early Elementary School
t p < .10,* p < .05, ** p < .01, *** p < .001. Note. Standard errors are within parentheses. LL =
log likelihood; AIC = Akaike information criterion; BIC = Bayesian information criterion; Model D: controlling for covariates; Model E: final model including attachment as a predictor.
Flanker Backward DCCS
Model D Model E Model D Model E Model D Model E Fixed effects Initial status πoi Intercept 𝛾00 79.40*** (6.87) 87.30*** (2.07) 3.22*** (0.54) 3.39*** (0.20) 62.52*** (9.96) 71.60*** (2.84) Maternal education 𝛾01 1.81t (0.96) 0.12 (0.07) 1.18 (1.36) Child gender (being a girl) 𝛾02 5.48 (4.24) 0.26 (0.32) 4.74 (6.11) Birthweight 𝛾03 0.00 (0.01) 0.00 (0.00) 0.00 (0.01) Attachment 𝛾04 27.57** (10.08) 2.37*** (0.76) 30.55* (14.09) Rate of change π1i Child age 𝛾10 0.50t (0.28) 0.36*** (0.08) 0.14*** (0.03) 0.16*** (0.02) 0.65t (0.38) 0.55*** (0.11) Maternal education 𝛾11 -0.06 (0.04) 0.00 (0.00) -0.03 (0.05) Child gender (being a girl) 𝛾12 -0.10 (0.17) 0.00 (0.01) -0.03 (0.23) Birthweight 𝛾13 0.00 (0.00) 0.00 (0.00) 0.00 (0.00) Attachment 𝛾14 -0.79 (0.39) -0.04 (0.03) -1.06t (0.55) Change in slope: quadratic term 𝛾20 -0.002*** (0.001) -0.003*** (0.001) Variance components Within-person: residual 𝜎𝐸2 41.17*** (7.75) 40.44*** (8.08) 1.56*** (0.18) 1.57*** (0.18) 206.99*** (25.05) 206.96*** (23.72) In initial status 𝜎02 353.18* (66.81) 373.66*** (68.74) 0.60 (0.39) 0.59t (0.36) 662.23*** (136.55) 621.54*** (122.22) In rate of change 𝜎12 0.48** (0.15) 0.48** (0.15) 0.00 (0.00) 0.00 (0.00) 0.81** (0.30) 0.77*** (0.21) Slope intercept covariance 𝜎01 -12.98*** (2.99) -13.36*** (3.06) -0.01 (0.01) -0.01 (0.01) -23.11*** (5.78) -21.83*** (4.75) Goodness-of-fit LL -848.18 -898.33 -511.22 -539.91 -1231.33 -1294.80 AIC 1720.37 1812.65 1048.44 1097.81 2486.67 2605.60 BIC 1761.57 1840.56 1096.38 1131.44 2530.50 2635.23