Science Arts & Métiers (SAM)
is an open access repository that collects the work of Arts et Métiers Institute of Technology researchers and makes it freely available over the web where possible.
This is an author-deposited version published in: https://sam.ensam.eu Handle ID: .http://hdl.handle.net/10985/7719
To cite this version :
Guochao GU, Raphaël PESCI, Eric BECKER, Laurent LANGLOIS, Régis BIGOT - Determination of quantity and localization of liquid in the semi-solid state using both 3D X-ray microtomography and 2D techniques for steel thixoforming - Solid State Phenomena - Semi-Solid Processing of Alloys and Composites XII - Vol. 192-193, p.191-196 - 2013
Any correspondence concerning this service should be sent to the repository Administrator : archiveouverte@ensam.eu
Determination of quantity and localization of liquid in the semi-solid
state using both 3D X-ray microtomography and 2D techniques for steel
thixoforming
Guochao GU
1, a, Raphaël PESCI
2,b, Eric BECKER
1,cLaurent LANGLOIS
1,d,
and Régis BIGOT
1,e1
Laboratoire Conception Fabrication Commande, EA 4495, Arts et Métiers ParisTech CER, Metz, France
2
Laboratoire d’Etude des Microstructures et de Mécanique des Matériaux, UMR CNRS 7239, Arts et Métiers ParisTech CER, METZ, France
a
guochao.gu@gmail.com, braphael.pesci@ensam.eu, ceric.becker@ensam.eu,
d
laurent.langlois@ensam.eu, eregis.bigot@ensam.eu
Keywords: Semi-solid, steel, thixoforging, X-ray microtomography, SEM-EDS
Abstract. The distribution of liquid at the semi solid state is one of the most important parameters for
steel thixoforging. It has a great influence on the viscosity of the material, on the flows and finally on the final shape and mechanical properties of the thixoforged parts.
Both ex situ and in situ 3D X-ray microtomography characterizations have been carried out to determine the quantity and localization of liquid at high temperature of M2 steel slugs. Microtomography was first performed ex situ at room temperature on samples heated and quenched from semi-solid state. The specimens were also scanned in situ directly at high temperature. The obtained results have been compared to 2D observations using EDS technique in SEM on heated and quenched specimens. They showed a good correlation making both approaches very efficient for the study of the liquid zones at the semi-solid state.
Introduction
Semi-solid forming is an innovative technology offering the opportunity to manufacture complex components with high mechanical properties in one step. Thixoforging which involves heating the feedstock into the semi-solid state with a low liquid fraction is of interest to scientists and industries. Therefore, fundamental knowledge on the microstructure evolution in the heating step is of great importance, including the spheroidization of solid grains, formation, location and volume fraction of liquid phase. These parameters are critical for effective process control, since they affect the microstructure development [1], rheological behavior [2] and therefore the material flow [3] during processing.
Classically, the characterization and quantification of these parameters are normally performed on a 2D polished and etched surface of solid material quenched from the semi-solid state. However, a random 2D section may lead to some error in shape factor, grain size distribution and liquid quantification, in particular- because the solid grains are not spherical but have a complex shape due to the agglomeration process in the semi-solid state. These parameters can only be precisely determined by 3D investigation after quenching, when the microstructure is preserved from the semi-solid state. The serial sectioning technique can be used for observing the 3D microstructures [4], but also non-destructive X-ray microtomography [5, 6]. Moreover, the microstructure evolution during heating can also be investigated insitu at high temperature with this technique [7]. However, such experiments are mainly performed on aluminum alloys.
In the present work, two different states of M2 steel are investigated: as-received and semi-solid state. The instrumental device and the experimental procedure are described. The microstructure evolution during heating to the semi-solid state is analyzed and discussed. By comparing the results obtained by various techniques, the former liquid zones are finally well identified and quantified.
Experimental Methods
The M2 high-speed tool steel (solidification range: 1200°C ~1420°C) was chosen because of its large freezing range and low solidus temperature which are suitable for thixoforming process. Especially, its high content of alloying elements permits a good absorption contrast between solid and liquid phases for X-ray microtomography. The chemical composition of M2 steel is given in Table 1.
Table. 1 Chemical composition of M2 steel
Weight % C Mn Mo Si Cr V W
M2 0.85 0.25 5.0 0.035 4.1 1.9 6.4
In order to study the microstructure evolution, the M2 slug was partially induction heated to semi-solid state by a direct remelting route. Due to the skin effect, the temperature field was not uniform in the slug, meaning some zones were in the semi-solid state at high temperature, while others remained totally solid, similar to the as-received state as shown in Fig. 1. During heating, the temperature was measured by a pyrometer. After heating for 120s, the temperature at the point C reached to 1250°C and the slug was directly quenched in the water in order to preserve the former structure at the semi-solid state. The cylindrical samples with a diameter of 1.2mm were electrodischarge-machined from the quenched slug in different directions for the X-ray microtomography experiments. Here, we mainly focus on one sample as shown in Fig. 1.
Fig. 1. Schematic view of temperature distribution during induction heating.
X-ray microtomography experiments were realized at room temperature at the ESRF, ID15A beamline, in Grenoble. Before testing, the sample was mounted on a translation-rotation stage which is used for aligning the sample with the X-ray beam. In the test, X-rays go through the sample which is continuously rotating 360° with a high constant energy (60keV). A fast DALSTAR Pantera 1M60 CCD is used to record the transmitted beam. The exposure time of this camera is 25ms. For one scan, 3600 projections with the effective pixel size of 1.2µm were obtained. After reconstruction, the 3D representation of the microstructure was processed and analyzed with ImageJ.
In order to identify the microstructure represented in 3D, 2D microstructure observations were also performed. The distribution of various chemical compositions was studied by Energy Dispersive Spectrometry (EDS). A Jeol 7001FLV Scanning Electron Microscope (SEM) was used to characterize the microstructure, such as the phases, grain size and shape. Here, the observed samples in 2D were etched by 2% Nital (2 ml HNO3 + 98ml ethanol).
Results and discussion
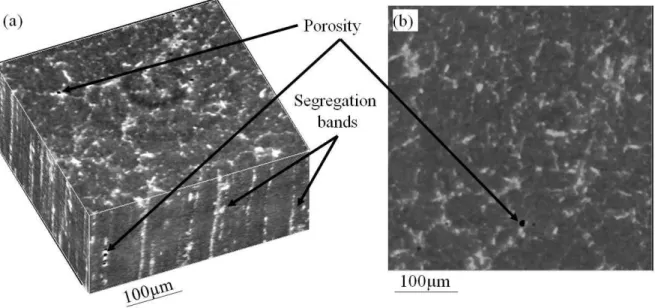
High energy X-ray microtomography experiments were first performed on the as-received M2 steel grade. Fig. 2 presents a 2D tomographic slice on transversal section and a 3D reconstructed stack of a sample at the as-received state. The black zones represent porosities. In Fig. 2(a), typical segregation bands are observed for this commercially rolled M2 grade. In order to characterize the white and grey zones, SEM and EDS experiments were performed.
Fig. 2. X-ray microtomographic results of as-received M2 steel in (a) 3D and (b) 2D.
Fig. 3 presents the SEM micrographs of as-received M2 steel on transversal and longitudinal directions. Two different types of carbides (MC and M6C) presented in the as-received material were confirmed by EDS, Fig.3: the whiter particles are M6C carbides which are rich in W and Mo, while the darker ones are MC carbides riching in V, W and Mo. These carbide particles are distributed in the martensite matrix and along grain boundaries. The microsegregation bands are observed in longitudinal surface (shown in Fig. 2(a) and Fig. 3(b)). The average equiaxed grain size is 10µm measured adopting the mean lineal intercept method as outlined in ASTM E112-96.
Fig. 3. SEM micrographs of as-received M2 steel on (a) transversal direction and (b) longitudinal direction with two kinds of carbides: M6C and MC.
Comparing the results obtained by these two techniques, the white zones in tomographic slices are confirmed to be carbides particles. However, due to the resolution (3µm) of X-ray microtomography, some small carbide particles (<1µm) are not distinguished or some isolated carbides particles with a distance less than 3µm are probably shown as one big large particle.
3D tomographic images and SEM micrographs of heated and quenched M2 steel at different heights are shown in Fig. 4. The tomographic images show the spatial distribution of the carbides in the material: the white corresponds to carbide particles, black to pores and dark gray to the matrix. These images can be directly compared since the same amount of material is concerned with the same magnification in each case. As shown in Fig. 1, the temperature field is not uniform in sample due to the penetration depth and conduction: the temperature increases with increasing height. Thereby, the microstructures at different height are different in grain size and morphology. At the bottom (Fig. 4(c)), due to the heat exchange between the material and ceramic, the material remains at the solid state showing a similar microstructure to the one at the as-received state as shown in Fig. 2: separated fine carbide particles are distributed in the matrix and along grain boundaries. With increasing height, the temperature increases. The original carbide particles are dissolved and the alloying elements start diffusing to the liquid zones where the solubility is higher. As well known, liquid preferably develops from the grain boundaries due to their high content of alloying elements. During quenching, new carbides are created from the liquid zones as illustrated in Fig. 4(b) (H ≥15mm in Fig. 1). The diffusion process is enhanced with increasing height; the original carbides are further dissolved. Finally, the original carbides are completely dissolved with the diffusion of the alloying elements to the liquid zones forming interconnected new carbides after quenching. One can also observe the entrapped liquid which corresponds to the fine carbide particles in the matrix.From the images, it can be found that there is a significant grain growth from 10µm to 45µm at high temperature as compared with the one at the as-received state. As well known, the grain growth is thermally activated: the grains grow with increasing temperature and holding time. However, the grain size at high temperature is still relatively small which can be explained by pinning effect [8]: a big amount of carbides (see Fig.3) contained in the M2 steel is responsible for inhibiting the grain growth during heating. Omar et al. [9] mentioned that the carbides restrict the grain growth during the ferrite-to austenite phase transformation of M2 which takes place around 800°C.
When comparing SEM micrographs and X-ray microtomographic images, they are in quite good agreement. The real volume fraction of liquid can be measured by image analysis with an image processing software ImageJ. Fig. 5 shows the evolution of the volume fraction of carbide as a function of height. As can be seen from the curve, over the height interval from 0mm to 12mm, the carbide fraction of material stabilizes at 11±1%. Then, from the height of 12mm to 17mm, the carbide fraction grows rapidly from 11±1% to 15±1%. Subsequent to the rapid growth, it increases slowly until reaching the value of 21±1%. The material from the bottom up to the height of 12 is assumed to be at the solid state, because the microstructure (showing small separated carbide particles are distributed in the matrix and along grain boundaries) and the volume fraction of carbides (11±1%) are similar to those at the as-received state. When the carbides are dissolved, the material contains liquid phase and austenite grains. The new carbides are formed instead of liquid zones during subsequent quenching process. In this case, the volume fraction of carbides (FC) is equal to the former liquid fraction (FL). Using SEM, it is found that at the height of 15mm, the original carbide particles are completely dissolved and new carbides are formed. Based on this, the carbide fraction over 13±1% is considered to be equal to the volume fraction of liquid.
Fig. 5. Volume fraction of liquid as a function of the height for Sample 1.
Conclusion
The microstructure evolution of the M2 steel during heating to the semi-solid state was examined with both 2D and 3D techniques. Different types of carbides (MC-type and M6C-type) at both as-received state and quenched from semi-solid state were identified by EDS. 3D X-ray microtomography illustrates the distribution of carbides: the as-received material showed microsegregation bands in longitudinal section and small carbides in transverse section, while after being induction-heated and water-quenched, new large interconnected carbides were formed, corresponding to the liquid zones at semi-solid state. The grains were growing, and the solid phase was surrounded with the liquid zones at high temperature. The real volume fraction of carbide was calculated on X-ray tomographic stacks. Furthermore, the good agreement between 2D SEM-EDS microstructures and 3D X-ray microtomography results proves that both kinds of techniques are just
as efficient in characterizing high-alloyed steels in the semi-solid state. The high energy X-ray microtomography was proven to be a powerful tool for this kind of study. In addition, owing to their high resolution and easy access, SEM and EDS techniques should also be applied for characterization.
Acknowledgement
The authors warmly thank Luc Morhain and Marc Wary (Arts et Métiers ParisTech CER Metz) for their technical support. The authors are also grateful to ESRF for providing beam time on the ID15 beam line and to all stuff members of the line for their help and discussion during the experiments.
References
[1] B. Amin-Ahmadi, H. Aashuri, Semisolid structure for M2 high speed steel prepared by cooling slope, J. Mater. Process. Technol. 210 (2010) 1632-1635.
[2] R. Bigot, V. Favier, C. Rouff, Characterisation of semi-solid material mechanical behavior by indentation test, J. Mater. Process. Technol. 160 (2005) 43-23.
[3] E. Becker, V. Favier, R. Bigot, P. Cezard, L. Langlois, Impact of experimental conditions on material response during forming of steel in semi-solid state, J. Mater. Process. Technol. 210 (2010) 1482-1492.
[4] D.J. Rowenhorst, A. Gupta, C.R. Feng, G. Spanos, 3D crystallographic and morphological analysis of coarse martensite: Combining EBSD and serial sectioning, Scripta Mater. 55 (2006) 11-16.
[5] L. Salvo, P. Coletens, E. Maire, S. Zabler, J.J. Blandin, J.Y. Buffière, W. Ludwig, E. Boller, D. Bellet, C. Josserond, X-ray micro-tomography an attractive characterization technique in material science, Nucl. Instrum. Methods Phys. Res., Sect. B: Beam Interactions with Materials and Atoms. 200 (2003) 273-286.
[6] G.C. Gu, R. Pesci, E. Becker, L, Langlois, R. Bigot, M. Scheel, Quantification and localization of the liquid zone of partially remelted M2 tool steel using X-ray microtomography and scanning electron microscopy, Acta Mate. 60 (2012) 948-957.
[7] R.N. Limodin, L. Salvo, M.Suéry, M. DiMichiel, In situ investigation by X-ray tomography of the overall and local microstructural changes occurring during partial remelting of AL-15.8wt.% Cu alloy, Acta Mater. 55 (2007) 3177-3199.
[8] G.A. Roberts, J.C. Hamaker, A.R. Johnson, Tool steels, third ed., Ohio, 1962.
[9] M.Z. Omar, H.V. Atkinson, A.A. Howe, E.J. Palmiere, P. Kapranos, M.J. Ghazali, Solid-liquid structural break-up in M2 tool steel for semi-solid metal processing, J. Mater. Sci. 44 (2009) 869-874.