HAL Id: dumas-01649831
https://dumas.ccsd.cnrs.fr/dumas-01649831
Submitted on 27 Nov 2017HAL is a multi-disciplinary open access archive for the deposit and dissemination of sci-entific research documents, whether they are pub-lished or not. The documents may come from teaching and research institutions in France or abroad, or from public or private research centers.
L’archive ouverte pluridisciplinaire HAL, est destinée au dépôt et à la diffusion de documents scientifiques de niveau recherche, publiés ou non, émanant des établissements d’enseignement et de recherche français ou étrangers, des laboratoires publics ou privés.
Optimal combination of conventional MRI and
DCE-MRI parameters to early predict pathologic
response to anthracycline-based neoadjuvant
chemotherapy for locally advanced high-grade soft-tissue
sarcomas
Amandine Crombé
To cite this version:
Amandine Crombé. Optimal combination of conventional MRI and DCE-MRI parameters to early predict pathologic response to anthracycline-based neoadjuvant chemotherapy for locally advanced high-grade soft-tissue sarcomas. Life Sciences [q-bio]. 2017. �dumas-01649831�
Université de Bordeaux
UFR DES SCIENCES MEDICALES
Année 2017 Thèse n° 3120 Thèse pour l’obtention du
DIPLOME D’ETAT DE DOCTEUR EN MEDECINE Présentée et soutenue publiquement le 20 septembre 2017 par
Amandine CROMBE Née le 11 Janvier 1985 à Paris 15ième
Optimal combination of conventional MRI and DCE-MRI parameters to early
predict pathologic response to anthracycline-based neoadjuvant chemotherapy
for locally advanced high-grade soft-tissue sarcomas
DIRECTRICE DE THESE Docteur Michèle KIND
MEMBRES DU JURY
Monsieur le Professeur Thomas TOURDIAS……….…….…... Président du jury Monsieur le Professeur Antoine ITALIANO* ……….………..………. Juge Monsieur le Docteur François LE LOARER……….………. Juge Monsieur le Docteur Eberhardt STOECKLE……….……….….…..…. Juge Monsieur le Docteur Nicolas ALBERTI……….…….……....…………..….…. Juge Madame le Docteur Michèle KIND………..……….……….. Juge Monsieur le Professeur Jean-Michel COINDRE………..Juge
*absent le jour de la soutenance
RAPPORTEUR
ABSTRACT
Purpose : To determine which conventional MRI and Dynamic-contrast-enhanced MRI (DCE-MRI) qualitative, semi-quantitative, quantitative features are significantly associated with histologic response to anthracycline-based neoadjuvant chemotherapy (a-NAC) in locally advanced high grade soft-tissue sarcoma (STS). To estimate inter- and intra-observer agreements of each criterion.
Methods: Retrospective, monocentric exploratory study. 46 adults with biopsy-proven high-grade STS of trunk walls and extremities, uniformly treated in a French sarcoma reference centre with 5-6 cycles of a-NAC. Radiological evaluation consisted in conventional pre-therapeutic (t0) MRI0 and
after 2-3 cycles of a-NAC (t1) MRI1+DCE-MRI1. After 5-6 cycles of a-NAC (t2), 32 patients also
had MRI2+DCE-MRI2 for pre-operative evaluation. All had available pathological analysis of
surgical specimen with treatment response estimation. Good or poor histologic response (GHR, PHR) was determined depending on % residual viable tumour cells (10% or >10%, respectively). MRI were randomly analysed, two times by two radiologists, blinded to histological results. Conventional MRI lecture assessed tumour maximal size, bi-dimensional diameters, volume, as well as T1 and T2 signals, architecture, margins, oedema, nerve, vessels and bone invasion in a dichotomised fashion.
DCE-MRI was analysed on whole tumour surface (ROIs) and on the first area displaying contrast
uptake (ROIN): qualitatively (%tumour volume enhanced during arterial phases, curvology),
semi-quantitatively (model-free: wash-in (WIn), iAUC90, Peak-enhancement (PE), and their ratio versus healthy muscle) and quantitatively (extended Tofts model: Ktrans and its ratio).
Se, Sp, PPV, OR were determined, as well as best cut-offs helped by receiver operating characteristics (ROC) curves analyses. Significant criteria to distinguish GHR and PHR at t1 were
used in a logistic binary regression to build a multivariate model to predict response. Inter- and intra-observer agreements were estimated.
At t2, correlation between %viable cells and numeric DCE-MRI2 indices were evaluated with uni-
and multivariate linear regression.
Results: 34 PHR and 12 GHR were included. Gender female was significantly associated with PHR (p=0.015). After 2-3 cycles of a-NAC, none of the change in measurements or on conventional MRI was significantly different between PHR and GHR. PE and WIn-ratio on ROIN were significantly
higher in PHR (p= 0.029 and 0.048, respectively). When gender, PE and WIn-ratios variables were considered together, they significantly predicted histologic response (p=0.004), but none individually reached significance. 94.1% PHR were well-classified. 45.5% GHR were ill-classified. AREA under ROC curve of the model was 0.846 IC95%=[0.677-0.994].
At t2: %change of longest dimension, bi-dimensional diameter, volume since t0 were significantly
higher in GHR (p=0.012, 0.010, 0.031, respectively). WIn-ratio, PE, iAUC90, Ktrans,,Ktrans-ratio in
ROIN (p= 0.012, 0.010, 0.031, 0.022, 0.023, 0.020, 0,009, 0,010, respectively) as well as Ktran,
Ktrans-ratio on ROIs were lower in GHR (p=0.043 and 0.021, respectively) . Multivariate linear
regression analysis showed that WIn-ratio-ROIn,2 and % change of the longest dimension were
significantly correlated with % viable cells on following surgery (r=0.370, p=0.022 and r=0.394, p=0.029, respectively). t2 analysis identified late responders profile in 4/5 ill-classified true GHR.
Conclusion: In combination with MR-morphometrics features, DCE-MRI improves response prediction to a-NAC, correlates with % residual viable tumour cells on post-a-NAC surgical specimen, highlights a ‘late-responders’ profile. Estimators of fibrosis and necrosis should be added to the model. Prospective multicentre studies are required for validation.
* KEYWORDS
Soft-tissue sarcomas; neoadjuvant chemotherapy; DCE-MRI; MRI; treatment response
KEYPOINTS
- DCE-MRI metrics may help to early predict histologic response to a-NAC but further prospective multicentre investigations are required.
- DCE-MRI metrics on pre-operative imaging correlated well with % of viable tumour cells on surgical specimen.
- Inter and intra-observers agreements of relevant DCE-MRI metrics were at least acceptable. - Multiparametric MRI follow-up enabled to detect ‘late responders’ profile in about 1/3 of good responders.
DISCIPLINE: Thèse de medicine. Diplôme d’étude specialisé en radiodiagnostic et imagerie médicale
REMERCIEMENTS
Je remercie l’ensemble des membres du jury - Pr Thomas Tourdias, Pr Antoine Italiano, Dr François Le Loarer, Dr Eberhardt Stoeckle, Dr Nicolas Alberti, Dr Michèle Kind - d’être ici présents, ainsi que madame le Pr Nathalie Lassau, rapporteur de ce travail. Je porte la plus haute estime à chacun d’entre vous, comme personne et comme médecin. J’espère que ce travail saura être digne de votre attention et éveiller votre curiosité.
Je remercie chaleureusement l’ensemble des médecins de chaque spécialité du groupe sarcome bordelais pour leur contribution, à titre de co-auteurs : en anatomopathologie (Dr François Le Loarer, Pr Jean-Michel Coindre), en oncologie médicale (Pr Antoine Italiano, Dr Sophie Cousin, Dr Maud Toulmonde), en chirurgie (Dr Eberhardt Stoeckle, Dr Audrey Michot), en radiothérapie (Pr Guy Kantor, Dr Paul Sargos) et bien entendu en radiologie (Dr Michèle Kind). Je suis honorée de partager les projets de ce groupe, de bénéficier de son ouverture et son dynamisme, et d’espérer pouvoir y contribuer par l’imagerie médicale.
Je remercie l’équipe de médecine nucléaire : Dr Anne-Laure Cazeau, Dr Yann Godbert, Dr Axelle Dutertre et Dr Romain Schollammer pour leur soutien, aides, orientations et remarques durant mon dernier stage d’interne en médecine nucléaire.
Je tiens à remercier l’ensemble des manipulateurs en radiologie, en médecine nucléaire, Thomas et Philippe pour l’informatique propre au département d’imagerie, et les techniciens du département d’anatomo-cytopathologie qui nous permettent d’obtenir les données indispensables à ces travaux de recherche en plus de l’activité clinique quotidienne et de ses aléas.
Ces remerciements n’étant pas seulement ceux d’un travail donné, mais aussi ceux d’une période d’étude bientôt révolue, je remercie les personnes, famille, amies/amis proches ou maintenant lointains, qui m’ont fait grandir humainement, culturellement, artistiquement et professionnellement ces six dernières années, ces catégories n’étant heureusement pas exclusives. La liste est longue et j’espère avoir su leur faire ressentir en temps voulu. Peut-être serais-je détrompée, mais, s’il est vrai que découvrir et apprendre reste possible à chaque âge, dans chaque domaine et particulièrement en médecine, la fin de l’internat entrouvre un passage vers un plus grand investissement dans l’apprentissage à autrui et dans l’élargissement des savoirs, passage dont j’espère être à la hauteur.
ABBREVIATIONS
18-FDG-PET/CT: 18F fluorodeoxyglucose positron emission tomography a-NAC: anthracycline based neo adjuvant chemotherapy
DCE-MRI: diffusion contrast enhanced MRI DWI: diffusion weighted imaging
FNCLCC: Féderation nationale des centres de lute contre le cancer GHR: Good Histological responder
iAUC90: area under the curve at 90s Ktrans: volume transfert constant Kep: transfer rate constant
MRI: magnetic resonance imaging OR: Odds Ratio
PE: Peak enhancement
PHR: poor histological responder ROC: receiver operator characteristics ROI: region of interest
SI: signal intensity STS: soft tissue sarcoma
Ve: extravascular interstitial volume Vol: volume
Vp: plasmatic volume WI: weighted imaging WIn: Wash in
INTRODUCTION
Soft tissue sarcomas (STS) are a heterogeneous group of mesenchymal tumours that can affect any anatomical site, especially extremities and trunk wall.
At a locally stage, the recommended treatment is a wide excision with negative margins (R0) carried out by a surgeon specifically trained in the treatment of STS. Despite optimum local treatment, 35% of patients will develop metastasis and die of their cancer. Two phase III studies have demonstrated potential benefits in overall survival in locally advanced high-grade STS patients treated with anthracycline-based neoadjuvant chemotherapy (NAC), redefining the standard of care of this disease (Issels et al., 2010; Saponara et al., 2017; Pasquali et al., 2017; Gronchi et al., 2017) Despite controversies and lack of validation studies, the efficacy of NAC can be estimated by the histologic response performed on the surgical specimen. It consists in the estimation of % identifiable viable tumour cells, % fibrosis or granulation tissue, % of necrosis on the whole tumour volume (Figure 1.A). Despite controversies and lack of validation studies, by analogy with osteosarcomas, the cut-off to distinguish poor from good histologic responses (PHR and GHR, respectively) is often defined at 10% (Bielack et al., 2002; Previsor et al., 1997, Lucas et al.; 2008; Walderman et al., 2011; Andreou et al. 2015). Recent communication has demonstrated the relevance in multivariate prognosis analysis to predict overall survival (Cousin et al., 2017).
Histologic response can only be performed at the end of NAC. Biopsy under treatment would only estimate the response on a small sample of a heterogeneous lesion, in an unethically invasive manner. Thus, there is a need for STS-specific non-invasive biomarkers in order to monitor the response on the entire tumour volume (Sullivan et al., 2015; FDA-NIH Biomarker working group, 2016).
The most widely used and validated method to assess response is based on variation of tumour maximal length, the basis of the Response Evaluation Criteria in Solid Tumours (RECIST 1.1), whose advantages are reproducibility and ease to measure (Eisenhauer et al., 2009), bi-dimensional (WHO) and volume being classically not used for STS, although their value has not been estimated. Yet, evaluations based on measures do not take into account vascular and architectural alterations that occur before size variation. The poor correlation between RECIST 1.1 and histological and clinical outcomes has been reported, notably in STS (Canter et al., 2010; Le Grange et al., 2014; Messiou et al., 2016) or in the setting of targeted therapies for gastrointestinal stromal tumours, for instance (Benjamin et al., 2007; CHOI et al., 2007). The RECIST working groups continuously investigating adaptation of RECIST, dealing with opposed issues such as innovation, generalization, specificity, feasibility or reproducibility, but none of the recent guidelines include adaptations for
Figure 1. Features of post-NAC post-operative pathological analysis (A) and conventional MRI correlates (B). Fibrosis (green arrow) is characterized by low SI on T1 and T2-wi with late, ill limited, moderately intense enhancement after CA injection. Necrosis (orange arrow) is characterized by fluid-like low SI on T1-wi, very high SI on T2-T1-wi, and no enhancement after CA injection. Viable tumour usually show intermediate
SI on T1-wi, T2-wi and got enhanced on static post-contrast sequences.
Magnetic resonance imaging (MRI) with contrast agent (CA) intravenous injection can virtually capture fibrosis and necrosis that occurred under NAC (Figure 1.B). However, the early identification of tissues that are getting fibrotic or necrotic remains challenging. These tissues can exhibit continuous alterations from normal tissue to definitive fibrosis or necrosis. In addition, MRI also enables the analysis of tumour margins, surrounding tissue and local bone, nerve and vessels invasions.
Previous studies have already demonstrated improved prediction of prognosis with modified CHOI compared with RECIST (Stacchiotti et al., 2009; Stacchiotti et al., 2012). Through a quantification of the enhancing part of the tumour, mCHOI aims at estimating the residual viable component and to identify responders without decrease in size. Nonetheless, by being acquired several minutes after Gadolinium chelates injection, mCHOI measurements confound enhancement of the residual
viable component resistant to NAC, of the fibrosis, and of components with underlying necrotic or fibrotic processes.
Dynamic-contrast-enhanced MRI (DCE-MRI) is a well-known MR technique that has been notably developed in oncology to non-invasively study blood supply and abnormal vascularization of tumours. Its applications include local staging, NAC response monitoring, and identification of residual or recurrent tumour after surgery (Jackson et al., 2007; Padhani et al., 2010).
According to the Quantitative Imaging Biomarkers Alliance (QIBA) DCE-MRI technical committee, DCE-MRI consists in serial acquisitions of a 3D gradient echo volumetric T1-wi sequence at a short temporal resolution (<10s) prior (for baseline) and after paramagnetic CA IV injection in order to follow its distribution through pathological tumour vessels and through tumour interstitial space.
Four levels of DCE-MRI analysis exist (Figure 2):
(i) Qualitative analysis that mainly relies on estimation of enhancement at the first arterial passages and qualification of the enhancement curve of a region or volume of interest (ROI and VOI, respectively) as a function of time,
(ii) Semi-quantitative or model-free analysis, which relies on numeric indices extracted directly from the time-versus-signal intensity (or time-versus-Gadolinium) curve (wash-in, wash-out, area under curve, time to peak of enhancement, Peak enhancement, curve wash-out, signal enhancement ratio),
(iii) Quantitative analysis based on permeability multi-compartment pharmacokinetic models. There are pre-requisite before performing this analysis. Indeed, signal intensity variation following CA IV injection is not linearly correlated with CA concentration. To address this issue, it has been proposed to complete a pre-contrast T1 map of the explored volume (Relaxometry or T1 mapping). To correctly convert SI during time, another requirement is classically to calculate a patient-specific arterial input function. The most commonly used and recommended model is the extended Tofts model , a two compartments model (intravascular..
Figure 2. Summary of DCE-MRI analyses
..space, IVS, and extravascular extracellular interstitial space, EES) both supposed to be at diffusion equilibrium (Tofts et al., 1999). The model generates two transfer constants: Ktrans (volume transfer
constant between IVS to EES) and Kep (efflux rate constant, between EES to IVS) and estimates
fraction volumes corresponding to EES (ve) and IVS (vp).
(iv) The most recent level is texture analysis, which herein would aim at quantifying the vascularization heterogeneity within tumour. The underlying idea of texture analysis is to study all the information that was lost by working on average values of a ROI. Semi-quantitative and quantitative DCE-MRI provide parametric maps for each indices on which can be performed first-order (based on histogram), second first-order (based on co-occurrence matrices, which can grab the heterogeneity in spatial organization of voxels) or higher order statistics. Among the multiple numeric indices derived from these complex analyses and helped by machine learning approach and classification tasks, some of them, or their combination, could be identified as surrogate biomarkers for prognosis, sensitivity to local (radiotherapy) or systemic (chemotherapy, immunotherapy, targeted therapy) treatments, and histologic response prediction, for instance (Limkin et al., 2017; Gillies et al., 2016; Kumar et al., 2012; Lamblin et al., 2012).
Identification of surrogate biomarkers among DCE-MRI parameters has been extensively studied, especially in solid tumour treated with anti-angiogenic drugs in pre-clinical and prospective trials for prognosis or response under treatment. Conclusions of clinical studies were halftone and did not validate surrogate biomarker, usable in clinical trials or daily practice (Hahn et al., 2008; Morgan et al., 2003; Bahri et al., 2008; Dingemans et al., 2011; Liu et al., 2005).
For mesenchymal tumours, bone sarcomas (osteosarcoma and Ewing sarcoma) were among the first ones to illustrate the potential of DCE-MRI as predictors of histologic response and survival, and to help plan surgery (Hanna et al., 1992; Reddick et al., 1995; Dyke et al., 2003; Egmont-Petersen et al., 2000; Uhl et al., 2006)
DCE-MRI for STS has demonstrated its added value in order to predict malignancy when its qualitative analysis was associated with static post-contrast MRI in a prospective study (Van Rijswijk, 2004), and in order to detect local recurrence (Del Grande, 2014). Nevertheless, this MR method has not been as used as in other solid tumours for treatment response evaluation, because of STS rarity, heterogeneity in term of histotypes, genetics and vascularization.
However, assessment of tumour response to neoadjuvant treatment for STS has demonstrated promising results despite small, retrospective or pre-clinical series with lack of homogeneity in patient population and in definition of tumour response. Actually, some considered a good response depending on % of necrosis other to 0 %, 5%, 50% viable tumour cells (Meyer et al., 2013; Huang et al., 2016; Soldatos et al., 2016, Monsky et al., 2012). Additionally, none of the neoadjuvant
were assessed, represented the currently recommended NAC, that is to say anthracycline-based chemotherapy.
Nonetheless, Soldatos et al. demonstrated in 23 patients the interest of qualitative assessment of arterial phase enhancement with a cut-off of 5% of early-enhanced tumour volume, without mentioning when pre-operative evaluation was performed and which NAC was used (Soldatos et al., 2016). Van Rijswijk depicted the pattern of enhancement as helpful to determine the fibrotic, necrotic or tumour nature of residual lesion after ILP (Van Rijswik et al., 2003). Recently, Huang et al. demonstrated that Ktrans was of better value to predict response than %change in longest diameter at 2 weeks. But the studied population was small (N=20), included different neoadjuvant treatments (chemoradiotherapy or sorafenib+chemoradiotherapy) and they did not compare their model of quantitative DCE-MRI with the extended Tofts model recommended by RSNA QIBA alliance (Huang et al., 2016).
In pre-clinical studies with experimental sarcoma mouse model, Alic et al. showed that Ktrans was
significantly reduced in ILP-treated mice, with a decrease of heterogeneity on cumulative histogram of Ktrans maps, in tumour itself and in tumour periphery (Alic et al., 2013).
Viglianti demonstrated predictive value on overall survival and metastasis free survival of semi-quantitative and semi-quantitative DCE-MRI performed prior and 24h after neoadjuvant hyperthermia/radiation therapy (Viglianti et al., 2009).
To conclude on what has been done until now about DCE-MRI and STS under neoadjuvant treatment, clinical and experimental sets of arguments guide towards potential improvement of response assessment compared with simple measures (such as RECIST1.1). However, several points require to be fixed prior to build prospective studies with decision-making based on DCE-MRI: (i) lack of treatment homogeneity, (ii) lack of definition of optimal moment of evaluation, (iii) lack of validation of most relevant DCE-MRI (iv) lack of association with other MRI modalities, at least morphometrics analysis (v) lack of uniformly accepted definition of histological response, (vi) lack of reproducibility analysis.
Consequently, in an attempt to retrospectively address these issues, the purpose of our study was to perform a large analysis of qualitative, semi-quantitative, quantitative DCE-MRI-derived criteria associated with morphometrics MRI features of tumour itself and tumour periphery, undergoing same recommended a-NAC, at early and similar moment from its beginning, by two independent radiologists. First aim was to determine which conventional MRI and DCE-MRI features on early evaluation could predict histologic response to a-NAC in locally advanced STS patients.
MATERIALS AND METHODS
Our institutional review board approved this retrospective monocentric study and informed consent was waived for each patient.
1. Study population and design (Figure 3)
In total, 46 patients were included in the study between May 2012 and December 2016. They all met the following criteria:
- Newly diagnosed STS of the trunk wall or extremities, with pathological confirmation of the diagnosis in a sarcoma reference centre
- Locally advanced, non-metastatic (assessed at least on chest computed tomography), high grade STS, according to FNCLCC (Guillou et al., 1997)
- Validation of a-NAC during the regional interdisciplinary panel of the sarcoma reference centre with a total of 5-6 cycles.
- Available pre-therapeutic MRI0
- MRI1 and DCE-MRI1 for early evaluation of a-NAC efficacy performed on the same MR-system
at 2 to 3 cycles with DCE-MRI and conventional sequences. - Curative surgery after achievement of the chemotherapy
- Pathologic response assessment on the whole surgical specimen with estimation of % necrosis, % of fibrosis, % of viable tumour cells.
Additionally, all the patients benefited from adjuvant radiotherapy and were followed-up at our institution.
For each patient, the following data were reported: age, gender, ASA score, performance status, tumour location (shoulder girdle, pelvic girdle, upper limb, lower limb, trunk wall), pain at diagnosis, modality of diagnosis (imaging-guided micro-biopsy, surgical biopsy, incomplete surgery performed out of a reference centre and without diagnosis), histotype, delay between MRI2
Figure 3. Study design
2. Pathologic examination
Hematoxylin and Eosin-stained slides of the initial diagnostic biopsy and of the surgical specimen were all reviewed by two expert pathologists from our sarcoma reference centre, following published EORTC guidelines (Wardelmann et al., 2016). The percentage of histologically intact viable tumour (% residual viable tumour cells), necrotic tissue (%necrosis) and granulation tissue (%fibrosis) were scored per slide, and the mean weighted percentage for each component was calculated. One can note that %necrosis + % fibrosis + %viable tumour cell = 100%. Patients were classified as GHR if 10% of residual tumour cells were seen, and as PHR if >10%, by analogy to the Salzer-Kuntschik grading system for osteosarcoma (Salzer-Kuntschik et al., 1983). Margins status was assessed as being: R0 (macroscopically complete with negative microscopic margins), R1 (macroscopically complete with positive microscopic margins), R2 (macroscopically incomplete), after consensus between surgeon and pathologists.
3. MRI protocol and post-processing
All patients had an initial pre-therapeutic MRI (t0: MRI0), following 2-3 cycles of a-NAC (t1:
81.5% (101/124) of the whole set of MRI was performed at our institution (23 initial MRI0, 46 early
MRI1 and 32 late MRI2) and 18.5% in external radiological centre (23/124, all being initial MRI0,
conventional without DCE-MRI sequence). These external MRI were included in our picture archiving and communication system (PACS IMPAX v6.5, Agfa, the Netherlands)
At our centre, MR imaging examination were performed on the same 1.5-T MR imaging system (AERA 1.5T Siemens Medical Solutions, Erlangen, Germany) with adapted coils depending on the tumour location. For trunk wall and girdles, a 18-channels phased-array body coil was used. For extremities, a knee 15 channels coil (knee or wrist tumour) or head 32 channels coil (ankle or foot tumour) were used.
3.1. Conventional MRI
At our centre, MRI were acquired during routine clinical practice. At least one T2-wi (turbo spin echo imaging (2D-TSE), repetition time (TR)=3020ms/echo time (TE)=136ms, thickness (th)=4mm), one T1-wi (2D-TSE, TR/TE=557/12ms, th=4mm), one orthogonal fluid-sensitive T2-wi with fat suppression (2D-TSE, TR/TE=4150/69ms, th=4mm) and one T1-wi after fat suppression and gadolinium chelates injection (3D-Dixon EDG TR/TE=6.8/2.3ms, flip angle= 10°, isotropic resolution 1mm, with multiplanar reformation), following DCE-MRI) had to be available. MRI performed in other centre had to include at least two orthogonal plans in order to measure the maximal length for RECIST 1.1, the two diameters for bi-dimensional and the volume assessments. 3.2. DCE MRI sequences acquisition and post-processing
Acquisition. Before the DCE-MRI acquisition, data for constructing a T1 map were acquired with a
spoiled 3D gradient echo T1-wi sequences (TR/TE=1.82/4.65, th=1mm, intersection gap: 10-20% (depending tumour size), FOV=240mm, matrix= with 2° and 15° flip angles)
The same volume acquisition was used for DCE-MRI sequence, which consisted in a 3D fast spoiled gradient echo sequence with following acquisition parameters: TR/TE = 4.3/1.7ms, flip angle =20°, FoV and Matrix adjusted for in plane resolution of 1,1x1,1mm, th=4mm. The volume acquisition was repeated every 8-9 seconds. At least two baseline volume acquisitions were performed prior to contrast agent injection, followed by 18 volumes after. The whole DCE-MRI lasted about 3mn30s.
0.1mM/kg of Gadoteric acid (Guerbet, France) or Gadobenate Dimeglumine (Bracco, Italy) were injected intravenously at a rate of 2mL/sec followed by a 20 mL flush of 0.9% f NaCl solution helped by a MR compatible automatic injector (Sonic Shot 7, Nemoto Kyorindo, Japan)
Post-processing. DCE-MRI were post-processed with dedicated OleaSphere software (Olea
Medical, version 3, La Ciotat, France) by the same radiologist (Rad1). T1-mapping was performed with Relaxometry module to generate R0- R1- T1- T0- maps that were used to optimize DCE-MRI
consecutive analysis. Depending on the contrast agent injection, signal intensity was converted in Gadolinium concentration (Gd).
Motion artefacts were corrected with a rigid-body coregistration method. The arterial input function was semi-automatically determined helped by cluster analysis technique with manual adjustment if required after control quality (Mouridsen et al., 2006). Permeability module was used to generate semi-quantitative (Wash-In, Peak-Enhancement, AUC at 90 s) and quantitative (Ktrans) parametric
maps.
Wash-In (WIn, mmol.L-1.s-1) corresponds to the velocity (or mean slope) of the increasing part of the curve, that is to say to the initial and mean gradient of the upsweep of the enhancement curve, calculated with linear least square method.
Peak-enhancement (PE, %) corresponds to the % of increase of the initial up-slope of the curve during the acquisition time.
iAUC90 is the area under the time-vs-[Gadolinium] curve following the 90s after detection of contrast agent detection. It represents a mix between blood volume and permeability.
We decided not to generate parameters related to return transfer of contrast agent from EES to IVS (Wash-out, Kep) because our acquisition was limited to 3mn30 in order to focus on the early phases
of the enhancement and because our protocol was integrated in the daily practice with time constraint and risk of motion artefact.
Control quality. Global quality of the arterial input function and parametric maps were estimated
according to a 3 points-scale (0: non-diagnosis DCE-MRI, 1: poor quality non-usable for quantification, 2: good). Miscalculations on Ktrans map, defined as discordance between tumour
enhancement on raw data and Ktrans map, were reported and excluded for quantitative analysis.
4. Reader procedure
Two radiologists (Ra1 and Ra2, with 2 and 25 years of experience in musculoskeletal soft-tissue tumours MRI, respectively), blinded to the imaging and histopathology reports, independently evaluated the MRI studies. Ra1 performed two lectures with a delay of 2 months between the 2 sessions. The order of MRI reading was randomly modified for the second session to limit memory bias. For imaging criteria based on qualitative assessment of conventional MRI, a final consensual reading between Ra1 and Ra2 was made in case of interpretation disagreement.
4.1.Conventional MRI analysis
Location. Tumour was qualified as deep, deep + superficial and superficial, depending on its
situation relative to the superficial aponeurosis.
Measurements. For each MRI (t0, t1, t2), radiologists determined the maximal length of the tumour
manually segmented all the tumours on T2-wi sequence, slice-by-slice, with the help of other sequences for more accurate delineation, in order to calculate tumour volume (Vol).
Tumour Architecture. Each radiologist estimated the percentage of necrosis, fibrosis and
haemorrhage on a three points scale (0: 10%, 1: 10-50%, 2: 50%). Necrosis was defined as component with very low signal intensity (SI) on T1-wi, fluid-like very high SI on T2-wi, with irregular borders and without enhancement after CA injection. Fibrosis was defined as component with very low SI on T1-wi and T2-wi, below muscle SI, with possible late enhancement. Haemorrhage was defined as a component with high SI on T1-wi, remaining high on T1-wi with fat suppression.
Tumour Periphery and local extension. Radiologists reported the presence or absence (1 or 0) of (1)
ill-defined margins (2) peripheral oedema on T2-wi with fat suppression, (3) enhancement of the oedema after CA injection and (4) vascular, nervous and/or bony invasion.
T2-ratio. Relative T2-ratio (= SItumor/SImuscle) is a numeric parameter that was introduced to assess
response in rectal cancer with decrease of this ratio being interpreted as a reflection of fibrosis (Kluza et al., 2013). T2-ratio = SItumor/SImuscle where a region of interest (ROI) is drawn on a
representative surface of the tumour to obtain SItumor, and a second ROI is carefully drawn on a
healthy muscle of other muscular lodge, avoiding intramuscular fatto obtain SImuscle.
Variations under treatment (01, 02). RECIST01, RECIST02, WHO01, WHO02, Vol01,
Vol02 were calculated for each patient. Apparition of sero-hematic levels within the tumour was
reported. Variations of tumour architecture and tumour periphery variables were qualified as 0: similar, 1: decreased, 2: increased.
Different types of changes could be assessed: mainly fibrotic, mainly necrotic, mixed fibro-necrotic and no evolution. Among those with fibrotic changes, we distinguished a pattern consisting in large fibrosis of the tumour, while a nodular tissue component was absolutely unaffected on conventional sequence (Figure 4) with a tendency to grow, suggesting resistance to a-NAC. We called this ‘compartmental fibrosis’ (to differentiate it from peripheral fibrosis, diffuse internal fibrosis, internal septa fibrosis, no fibrosis).
Finally, on T1-wi and T2-wi, radiologists were asked to estimate on a 3 point-scale the variation of heterogeneity (0: less heterogeneous, 1: similar, 2: more heterogeneous)
Figure 4. Pattern of fibrosis on conventional T2-wi. (A) Peripheral fibrosis : apparition of a thick coating with low SI on T2-wi (white arrow). (B) Diffuse entire fibrosis of a grade III leiomyosarcoma (confirmed
on pathological analysis where %fibrosis = 95%) (C) Compartmental fibrosis in a poor responders. The anterior component of this grade III UPS showed a decrease of SI on T2-wi compatible with fibrosis (white
arrow), while it initially demonstrated similar SI (dotted line) to the posterior, apparently-resistant- nodule. (D) Septa fibrosis : a mesh of severable septa of low T2-SI appeared within a necrotic compartment of a
grade III myxofibrosarcoma.
4.2.DCE-MRI analysis (Figure 5)
ROI positioning. The two radiologists had to manually place three ROI that were propagated on the
set of parametric maps (WIn, PE, iAUC90, Ktrans). Conventional MRI and DCE-MRI were all
available to help ROI placement. One ROI was placed on the maximal surface of the whole tumour (ROIS), one ROI of at least 1cm2 was placed on the first component of the tumour that displayed
CA uptake on raw DCE-MRI data (ROIN, supposed to represent its most aggressive component)
Figure 5. DCE-MRI data sets available in order to place the regions of interest (ROI) (A), including raw DCE-MRI (upper images) to identify which was the first area of the tumour to firstly show CA uptake. (B) Three ROI were manually drawn: one circular of at least 1cm2 on this area (ROIN, red), one on the maximal surface of the tumour (ROIS, yellow), and one on healthy muscle from another lodge. (C) shows the curves for each ROI with corresponding colours (black arrow: time to the peak enhancement, arrow head: t=90s for
AUC90)
Qualitative analysis. On raw DCE-MRI data, radiologists identified the sequences that were
acquired prior to venous filling, on which they estimated the percentage of arterial enhancement of the tumour (0: 10%, 1: >10%).
After ROI placement, they qualified the morphology of the time-vs-Gd curve for ROIS and ROIN
according to a two points-scale (1: slope and/or plateau 3 x slope and/or plateau of the healthy muscle ROI3, 0: below). In case of disagreement between the readers during the consensual reading,
the most unfavourable option (1) was taken.
Semi-quantitative and quantitative analyses. Indices value for each ROI was reported in order to
calculate the following parameters: Absolute value: X-ROIi,j
Where i s,n, corresponding to the two tumour ROIs, j 0,1,2, corresponding to the time of evaluation, and X Ktrans, WIn, PE, iAUC90. Thus, a total of 4 x 4 = 16 parameters were available for each MRI, as well as their change, exposed as:
%Change-X0j = 100 x (X-ROIi,j - X-ROIi,0) / X-ROIi,0
%Change-X-ratio0j = 100 x (X-ratio-ROIi,j - X-ratio-ROIi,0) / X-ratio-ROIi,0
5. Statistical analysis
-Normality was assessed for each continuous value by using Shapiro-Wilk test. Depending on the results, the student t-test or the Mann-Whitney U-test was performed to compare good and poor histologic responders.
-Categorical and ordinal parameters were compared using the Chi-2 or Fisher test
-For significant association between continuous parameters and histologic response, receiver-operating curves were built in order to quantify the performance of each individual parameter and to find the optimal cut-off points that satisfy the Youden index (i.e. point farthest from chance, to minimize rate of misclassification) (Perkins, 2006). Sensibility (Se), specificity (Sp), odd-ratios (OR) with 95% confidence interval (CI95%) for these cut-off points were calculated. Thus these
continuous variables were dichotomised (0: under the cut-off, 1: above).
- The relevant clinical variables, conventional MRI1 variables, DCE-MRI1 variables, all
dichotomised as dummy variable, were analysed in multivariate analysis by using a binary logistic regression, with entry method, to estimate multivariate OR with their IC. Collinearity diagnostic was previously tested. The adequation of the multivariate model was assessed with Hosmer-Lemeshow test and with R2-nagelkerke index. The ROC curve of the multivariate model at t1 was built and compared with ROC curves of % change of maximal size (RECIST 1.1) and each individual relevant DCE-MRI1 parameters.
-Correlation between the imaging parameters that were significantly associated with histologic response on late MRI2, and the percentage of viable tumour cells, were estimated using univariate
linear regression (with Spearman’s rank correlation or Pearson test depending on normality test result), followed by multivariate linear regression.
-The inter- and intra-observers reliabilities were assessed using interclass correlation coefficient (ICC) for continuous values (with two-way mixed and one-way random models respectively). The Cohen’s Kappa () test for pairwise agreement was used for dichotomous variable. Weighted kappa (w) statistics was used for ordinal variable (herein RECIST 1.1 and OMS at early (01) and late
The agreement for ICC was defined as good (>0.75), moderate (0.5-0.75) or poor (<0.5). The agreement for classical and w was defined as slight (0-0.20), fair (0.21-0.40), moderate
(0.41-0.60), substantial (0.61-0.80) and almost perfect (0.81-0.99) (Landis, 1977).
-All tests were two-tailed. Statistical analyses were done using GraphPad Prism (GraphPad Software, Inc., version 7, La Jolla, CA) and the SPSS statistical package (IBM, version 21.0, Chicago, IL) with Python plug-in. A p-value of less than 0.05 was deemed significant.
*
RESULTS
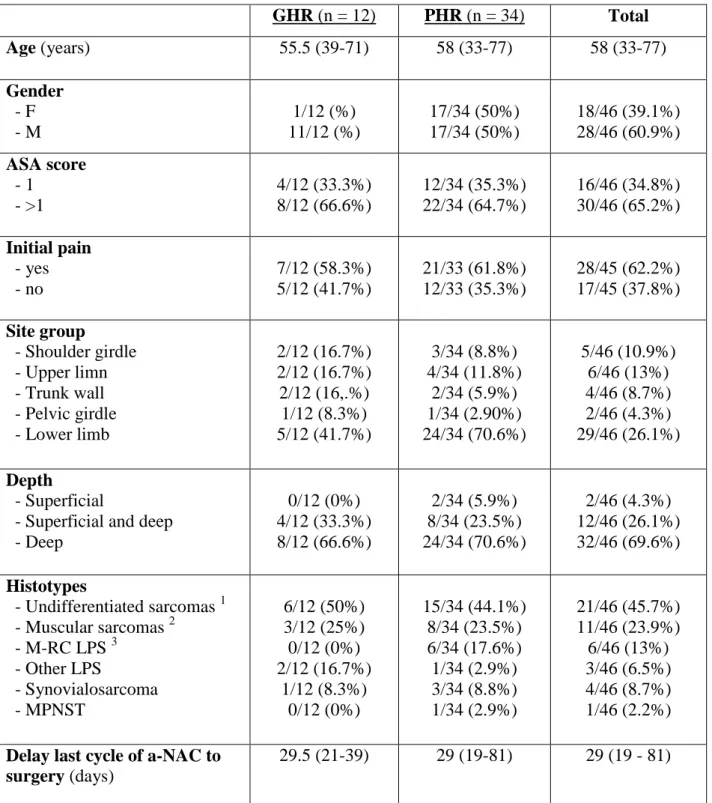
1. Clinical patient data (Table 1)
From May 2012 to December 2016, 46 patients (18 female) met inclusion criteria and completed conventional MRI0 and DCE-MRI1, 23/46 (50%) also having DCE-MRI0 and 32/46 (69.6%)
DCE-MRI2. Thus, among them, 23/46 (50%) had both DCE-MRI0 and DCE-MRI1 and 17/46 (37.0%) had
DCE-MRI0 and DCE-MRI2.
Median age was 58 years (range, 33 - 77)
Median time between baseline MRI0 and the first cycle of treatment administration was 28 days
(range, 0 - 94).
Median time between last cycle of a-NAC and surgery was 29 days (range, 19 - 81). Median time between MRI2 and surgery was 25 days (range, 1- 50).
34/46 (73.9%) were classified as PHR and 12/46 (26.1%) as GHR after pathological analysis on surgical specimen.
Table 2 summarizes the salient initial clinical and histological features.
Among the 18 included females, only 1/18 (5.5%) was GHR, while 17/28 (60.7%) males were GHR (p=0.015, ORunivariate = 11 (1.42 – 124.60))
Table 1 : Clinical Features of the study population GHR (n = 12) PHR (n = 34) Total Age (years) 55.5 (39-71) 58 (33-77) 58 (33-77) Gender - F - M 1/12 (%) 11/12 (%) 17/34 (50%) 17/34 (50%) 18/46 (39.1%) 28/46 (60.9%) ASA score - 1 - >1 4/12 (33.3%) 8/12 (66.6%) 12/34 (35.3%) 22/34 (64.7%) 16/46 (34.8%) 30/46 (65.2%) Initial pain - yes - no 7/12 (58.3%) 5/12 (41.7%) 21/33 (61.8%) 12/33 (35.3%) 28/45 (62.2%) 17/45 (37.8%) Site group - Shoulder girdle - Upper limn - Trunk wall - Pelvic girdle - Lower limb 2/12 (16.7%) 2/12 (16.7%) 2/12 (16,.%) 1/12 (8.3%) 5/12 (41.7%) 3/34 (8.8%) 4/34 (11.8%) 2/34 (5.9%) 1/34 (2.90%) 24/34 (70.6%) 5/46 (10.9%) 6/46 (13%) 4/46 (8.7%) 2/46 (4.3%) 29/46 (26.1%) Depth - Superficial
- Superficial and deep - Deep 0/12 (0%) 4/12 (33.3%) 8/12 (66.6%) 2/34 (5.9%) 8/34 (23.5%) 24/34 (70.6%) 2/46 (4.3%) 12/46 (26.1%) 32/46 (69.6%) Histotypes - Undifferentiated sarcomas 1 - Muscular sarcomas 2 - M-RC LPS 3 - Other LPS - Synovialosarcoma - MPNST 6/12 (50%) 3/12 (25%) 0/12 (0%) 2/12 (16.7%) 1/12 (8.3%) 0/12 (0%) 15/34 (44.1%) 8/34 (23.5%) 6/34 (17.6%) 1/34 (2.9%) 3/34 (8.8%) 1/34 (2.9%) 21/46 (45.7%) 11/46 (23.9%) 6/46 (13%) 3/46 (6.5%) 4/46 (8.7%) 1/46 (2.2%) Delay last cycle of a-NAC to
surgery (days)
29.5 (21-39) 29 (19-81) 29 (19 - 81)
1
undifferentiated epitheloid/spindle cell/pleomorphic sarcoma, undifferentiated sarcoma not otherwise specified ;
2
rhabdomyosarcoma, leimyosarcoma ; 3
dedifferentiated LPS, pleomorphic LPS
LPS : liposarcoma, M-RC LPS : myxoid-round cell LPS ; MPNST : malignant peripheral nerve sheath tumour
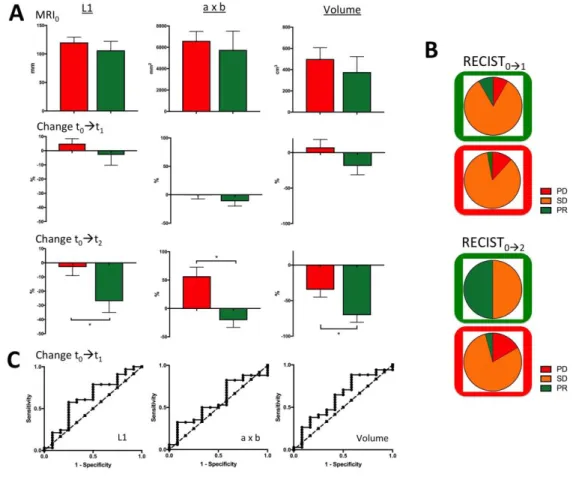
2. Measurements, RECIST1.1, OMS and volume (Table 2, Figure 6)
Initial metrics. There was no significant difference between GHR and PHR at baseline for maximal
length, ‘a x b’ and Volume.
t0 t1. Percentages of maximal length, ‘a x b’ and volume change (%Change-L101,
%Change-axb01, %Change-Vol01) did not exhibit significant difference either from MRI0 to MRI1.
Thus, according to RECIST1.1, 3/34 (8.8%) PHR were ill-classified as partial response, 3/34 (8.8%) PHR were well-classified as progressive disease, and 28/34 (82.4%) were classified as stable disease. According to OMS, 4/34 (11.8%) PHR were ill-classified as partial response, 6/34 (17.6%) were well classified as progressive disease, 24/34 (70.6%) PHR were classified as stable disease.
t0t2. At final MRI2 evaluation, %Change-L102, %Change-axb02 and %Change-Vol02 were all
significantly decrease in GHR compared with PHR (p=0.012, p=0.010, p=0.031, respectively)
Figure 6. Measurements. (A) longest diameter L1, bi-dimensional diameter ‘axb’ and volume) at t0, t1, t2 and change from t0 to t1 and t0 to t2. * p<0.05. (B) RECIST1.1 classification at early and late evaluation (PR=partial response, SD=stable disease, PR=progressive disease). Green and red frames correspond to true
GHR and true PHR respectively. (C) Area under the ROC curves for %change of longest diameter, bi-dimensional diameter and volume at early evaluation (t0 to t1) (not significant p>0.05)
3. Conventional MRI data (Table 3)
Initial features. No significant difference was found between GHR and PHR at baseline, whatever
the location, the architectural features, and the peripheral features.
t0 t1. From MRI0 to MRI1, there was a tendency towards a decrease of the initial peripheral
oedema, without reaching significance (p=0.054).
Distribution of %fibrosis was significantly different between PHR and GHR (p=0.008) with 1/34 (2.9%) PHR who had qualitatively more than 50% of its volume exhibiting a MRI signal compatible with fibrosis versus 4/12 GHR (33.3%). 11/34 PHR (32.4%) showed a compartmental fibrosis pattern, versus only 1/12 (8.3%) GHR. Despite no significance, this observation suggests that occurrence of a growing tissue nodule within a tumour tending to get fibrotic should suggest a poor response.
t0t2. From MRI0 to MRI2, there was a significant difference between PHR and GHR for the
fibrotic pattern (p=0.041).
T2-ratio, T2-SD-ratio at t0, t1 and t2, and their %change from t0 to t1 and t0 to t2 did not show
significant difference.
4. DCE-MRI data
A total of 101 DCE-MRI were acquired (23 DCE-MRI0, 46 DCE-MRI1 and 32 DCE-MRI2). 7 were
considered as non-diagnostic for any type of MRI analysis. Among the 94 remaining DCE-MRI, 12 displayed mismatches between raw data and Ktrans map, that is to say, highly and early
perfused tumour with Ktrans values equal 0. Thus, a total of 82 DCE-MRIs were used for Ktrans
-related analyses.
Qualitative analysis. Analysis of the curve morphology on ROIs or ROIn did not reveal significant
difference between GHR and PHR at t1. However, at t2, 15/24 (62.5%) PHR showed a type 3+4
curves for the ROIn on versus none of the GHR (0/8, 0%) (p=0.003).
Estimation of less than 10% of tumour volume with arterial phase enhancement did not differ between GHR and PHR at t1: 4/34 (11.8%) PHR and 3/12 (25%) GHR displayed this feature. At t2,
this became significantly different: (3/24 (12.5%) PHR versus 6/8 (75%) GHR, p=0.002).
Semi-quantitative and quantitative analyses. Table 4 and Figure 7 summarize the results for each
parameter for each time point. Overall, at t1, WIn-ratio-ROIn was significantly lower for GHR than
for PHR (4.78 1.19 versus 9.8 1.65, p=0.048), as well as PE-ROIn (93.43 25.62 versus 166.9
96.72, p=0.029). At t2, WIn-ratio-ROIn and PE-ROIn were still significantly lower for GHR
Table 3 : Conventional MRI features at first evaluation t1 PHR GHR p-value %Necrosis - 10% - 10-50% - 50% 18/34 9/34 7/34 5/12 3/12 4/12 0.659 %Fibrosis - 10% - 10-50% - 50% 17/34 16/34 1/34 6/12 2/12 4/12 0.008 ** %Haemorrhage - 10% - 10-50% - 50% 24/29 3/29 2/29 7/9 1/9 1/9 0.914 Variation of %Necrosis - Decreased + similar - Increased 1+21/33 11/33 1+3/12 8/12 0.086 Variation of %Fibrosis - Similar - Increased 11/33 22/33 4/12 8/12 >0.999 Variation of %Haemorrhage - Decreased - Similar - Increased 4/30 19/30 7/30 2/11 6/11 3/11 0.868 Sero-hematic levels - Yes - No 4/34 30/34 1/12 11/12 >0.999 T1-Heterogeneity variation - Decreased - Similar - Increased 1/22 12/22 9/22 1/8 4/8 2/8 0.622 T2-Heterogeneity variation - Decreased - Similar - Increased 3/32 7/32 22/32 0/11 4/11 7/11 0.420 Margin variation - Still well-limited
- Similar or worst delimitation - Better delineation 12/34 20/34 2/34 5/12 5/12 2/12 0.414 Oedema variation - Still no edema - Similar or increased - Decreased 5/18 11/18 2/18 2/8 4/8 2/8 0.661
Peripheral enhancement variation
- Still no enhancement - Similar or increased - decreased 9/34 20/34 5/34 3/12 7/12 2/12 0.985 Fibrotic pattern - Compartmental fibrosis
- Other (no fibrosis, septa, peripheral fibrosis, diffuse fibrosis)
11/34 23/34
1/12
and Ktrans-ROIs, Ktrans-ROIn, Ktrans-ratio-ROIs, Ktrans-ratio-ROIn (p=0.043, p=0.009, p=0.021 and
p=0.009, respectively)
Determination of optimal threshold for significant criteria at t1. For WIn-ratio-ROIn, ROC analysis
demonstrated an AUC=0.70 (0.53-0.87). Optimal threshold, was 3.48 mmol.L-1.s-1 (Youden index = 0.03) leading to Se=0.79, Sp=0.55, PPV=0.84, ORunivariate=5.40 (1.17, 23.72) to detect PHR.
For PE-ROIn, AUC was 0.71 (0.54-0.89). Optimal threshold was 143.5%. (Youden index = 0.49)
providing Se=068, Sp=0.83, PPV=0.92, ORunivariate=10.45 (1.99-51.22) to detect PHR.
Figure 7. Values (at t0 t1 and t2) Variation (from t0 to t1 and 1 to t2) of DCE-MRI semi-quantitative and quantitative indices. * p<0.050, ** p<0.010.
5. Inter and intra observer agreements of the relevant criteria at t1 and t2
Table 5 shows the agreements for each relevant criterion among measures, conventional MRI and DCE-MRI studies. None of the conventional MRI criteria showed both inter- and intra-reader at least substantial agreement. At t1 and t2, PE-ROIn,1 and WIn-ratio-ROIn,1 demonstrated moderate to
good inter- and intra-reader agreements. At t2, among the Ktrans-related parameters, only Ktrans
6. Combination of significant criteria at t1 to predict response
Due to their poor reproducibility’s, none of the conventional MRI criterion were introduced in the multivariate analysis. After dichotomisation of PE-ROIn,1 and WIn-ratio-ROIn,1 according to the
thresholds that were found on ROC analysis and verification of the absence of collinearity between them (r2=0.147), a logistic binary regression was conducted. The model included gender, PE-ROIn,1
and WIn-ratio-ROIn,1. When the 3 predictors were considered together, they significantly predicted
histologic response (p=0.004). The model enabled to explain 38.7% of the variation of the outcome (Nagelkerke-R2=0.387), fit well with the data (Hosmer-Lemeshow test, p=0.340), with a diagnostic accuracy of 84.4%. Indeed, only 2/34 (5.9%) PHR were ill classified as good responders. Thus, Se was 94.1%, Sp 54.5%, PPV 86.5% and AUC of ROC curve of the model was 0.836 IC95% (0.677 – 0.994) to detect PHR.
However 5/11 (45.5%) GHR were ill classified as poor responders. None of the 3 predictors alone significantly predicted the histologic response when all were introduced in the model. Table 6 shows the results of the binary logistic regression. Figure 8 shows ROC curve of the model. Finally, after each predictor being dichotomised, the equation of the model was:
log(p/(1-p)) = 0.811 x (WIn-ratio-ROIs,1) + 2.085 x (Gender) + 1.647 x (PE-ROIs,1) – 0.592
Figure 8. ROC curves at early evaluation of % change of the longest diameter, DCE-MRI predictors alone (WIn-ratio-ROIS,1, PE-ROIS,1) and of the multivariate model.
Table 6 : Synthesis of the Multivariate binary logistic regression results to predict pathologic response at early evaluation t1. (A) OR with their 95% IC and p-value, estimated after univariate and multivariate analyses. (B) Patient’s classification according to the model. Note that one of the initial 46 patients had too
poor quality DCE-MRI1 to compute the semi-quantitative and quantitative parametric maps and was removed from this analysis. (C) Area under curve of ROC curve of the model, %Change of maximal axis
(L1) from t0 to t1, PE-ROIs,1 and WIn-ratio-ROIs,1 with standard error, 95% IC and p-value
A.
OR - univariate analysis OR – multivariate analysis
Gender 11 (1.42 ; 124.60) p=0.015 * 8.04 (0.82 ; 79.09) p=0.074 PE-ROIs,1 10.45 (0.198 ; 51.22) p=0.006 ** 5.19 (0.76 ; 35.35) p=0.092 Win-ratio-ROIs,1 5.4 (1.17 ; 23.72) p=0.026 * 2.25 (0.38 ; 13.29) p=0.371 B. True-PHR True-GHR Model + 32 5 37 Model - 2 6 8 34 11 45 C.
AUC Standard error 95% IC
0%Change-L1 0.608 0.105 (0.403 ; 0.814)
Win-ratio-ROIs,1 0.701 0.090 (0.525 ; 0.876)
PE-ROIs,1 0.711 0.089 (0.536 ; 0.886)
7. Particularities of myxoid-round cells liposarcomas response with a-NAC
Our series included 6 myxoid-round cell liposarcomas (M/RC-LPS), which were all considered as PHR after pathological analysis of surgical specimen. In 4 of 6 cases, the pathologists specified that the round cell component had disappeared and that only remained the myxoid component raising the question of how to evaluate pathologic response in M/RC-LPS.
Retrospective analysis of the M/RC-LPS showed a particular imaging pattern of response. Maximal diameter, minimal diameter and volume were not modified between t0 and t1 (paired Wilcoxon,
p>0.05). Conventional MRI0 showed well-limited tumour, without peripheral oedema. At t1, 2/6
showed small haemorrhage on MRI1. Fibrosis <50% was reported in 4/6 patients with apparition of
either septa, diffuse or peripheral fibrosis. Fatty component also increased suggesting a RE-differentiation with a-NAC.
DCE-MRI1 thresholds were poorly efficient. PE-ROIn,1 was positive in one case. WIn-ratio-ROIn,1
was positive in 4 cases. Thus, one male patient had all the three model predictors negative leading to misdiagnosis. In this case, one must note that round cells component was absent on surgical specimen. Figure 9 shows a typical evolution of M-RC LPS treated with a-NAC.
8. Retrospective analysis of ill-classified responses to highlight clues to avoid misclassification (Figure 10).
In order to identify the limits of the multivariate model, we retrospectively analysed the images of the 5 ill-classified true GHR and the 2 ill-classified PHR.
Four of the 5 true GHR did not demonstrate any suggestive sign of a response to treatment at t1:
neither on conventional MRI1, nor on DCE-MRI1. However, these 4 true GHR displayed
morphological and perfusion alterations between t1 and t2 strongly evocative of a good response: 3/4
turned into entire fibro-necrotic tumours, without arterial phase enhancement, 1/4 remained morphologically poorly unchanged. However, this patient benefited from a DCE-MRI after 4 cycles of a-NAC showing less than 10% of arterial phase enhancement, WIn-ratio-ROIs and PE-ROIs
under cut-offs. These four cases suggest the possibility of ‘late responders to a-NAC’ (Figure 11.A). One of the 5 true GHR still demonstrated at t2 one component with perfusion abnormalities
(‘Aggressive’ time-vs-Gd curve, WIn-ratio-ROIs,2 = 5.3 mmol.L-1.s-1) (Figure 11.B).
Figure 9. RE-differentiation pattern of response of M/RC-LPS under a-NAC.
(A) shows conventional MRI at each evaluation point. Maximal diameter did not change. Tumour transverse axis tended to decrease. Note the apparition of additional fatty component within tumour periphery (high SI
on T1-wi, low SI on post-contrast fat suppressed T1-wi). (B) Selection of DCE-MRI raw images (prior to CA injection and at arterial, venous and late phases), shows patchy venous and late enhancements, with disappearing of some enhanced area on DCE-MRI2. (C) Curves at early and late evaluation: at t1, ROIN -corresponding curve (red) was classified type-1, that is to say ‘aggressive’ compared with muscle curve (blue). At t2, the curve was classified type-0. Altogether, DCE-MRI data were compatible with a late good
response, but tumour was pathologically classified as PHR because of >10% viable cells despite no round cells.
Figure 10. Two cases of ill classified true-good histologic responders for two different reasons. (A) Is this STS well-responding? Is this a late-late responder? Follow up demonstrates persistence of a tissue nodule with strong and early enhancement (red arrow head and red curve) while the posterior nodule showed
fibrotic process followed by retraction (green arrow head)
(B) Is this STS a late responder? At t1, rare fibrotic septa appeared. At t2, tumour only displayed fibrosis (green arrow head) and necrosis (white arrow head). Pathological analysis reported no residual tumour cells and only fibro-necrotic tissue (note that because of movement artefacts due to breathing, patient was removed
Figure 11. Identification of a-NAC resistant compartment.
(A) show as typical ‘compartmental fibrosis’ pattern of response where only a nodule still displayed early arterial enhancement after two courses of a-NAC. Conventional MRI and DCE-MRI at t0 did not identify a
priori abnormality in the future primary or secondary ‘resistant’ nodule.
(B) shows a another case of ‘compartmental fibrosis’ where the resistant nodule, at its lower part, clearly displayed different features from the rest of the tumour on conventional MRI0 and DCE-MRI0. (B.1) Curvology: Interestingly, this resistant nodule (blue dotted line) was initially slightly less perfused than the rest of the tumour on initial MRI (green dotted line). After 2 cycles of a-NAC (same colour, continuous line),
9. Multiparametric MRI analysis of a-NAC resistant compartment (Figure 11)
Conventional MRI analysis at t1 enabled to distinguish 12 patients with a heterogeneous response,
called ‘compartmental fibrosis’ because one component clearly exhibited a strong fibrotic response, while at least one another component was absolutely not affected by a-NAC (persistent nodule). One was a GHR and 11/12 were PHR.
Among the 12 cases of compartmental fibrosis at t1:
- 2/12 patients had MRI0 + DCE-MRI0 without any clues for a future persistent nodule (Figure
12.A).
- 9/12 patients only had MRI0 without any clues on conventional analysis for a future persistent
nodule.
- 1/12 patient had a tumour of which MRI0 + DCE-MI0 demonstrated a different nodule that would
grow under a-NAC while the rest of the tumour got fibrotic (Figure 12.B). Interestingly, this component was moderately vascularized compared with the others at t0.
10. Correlation between relevant DCE-MRI parameters at t2 and percentage of viable cell on surgical specimen (Figure 12, table 7)
We believed that one explanation of the failure of our model to correctly classify 45.5% of good responders was due to the lack of criterion to estimate good response, that is to say, to estimate %fibrosis and %necrosis. %Fibrosis estimated on MRI1 was not reproducible enough to be
acceptable in a model.
On another point of view, we hypothesized the ability of the multivariate model to correctly classify 94.1% of poor responders was likely due to the positive relationship between DCE-MRI numeric indices and residual viable cells.
To test this hypothesis, we performed univariate and multivariate linear regressions that took into account the significant criteria to distinguish PHR and GHR at t2, prior to surgery. In this part of
the study, we also made the assumption that modifications of tumour between t2 and surgery would
remain limited, thus conventional MRI2 and DCE-MRI2 would be direct reflection of the tumour.
The other aim of this part is to capture the information contained in continuous data (% of viable cell) and lost with dichotomisation (PHR or GHR with a cut-off of 10% of residual viable cells).
Table 8 and figure 13 summarizes the results of univariate and multivariate linear regression between %viable tumour cells on surgical specimen and quantitative possible numeric predictors, beforehand identified as significantly different between GHR and PHR at t2. Finally, multivariate
analysis demonstrated that WIn-ratio-ROIn,2 and %change of the longest dimension showed
respectively). Together with results at t1, this highlights the potential of WIn-ratio-ROIn as a
biomarker of pathological response.
Figure 12. Scatterplot of the continuous variables included in multivariate linear regression model at pre-operative t2. (Dotted green line: included variable but not significant when individually considered. Green
Table 7. Uni and Multivariate Linear Regression between relevant continuous variables and % at t2 Univariate Multivariate r p r p %Change-L1 02 (N=32) 0.410 0.020 * 0.370 0.022 * %Change-‘axb’ 02 (N=32) 0.447 0.010 * _ _ %Change-Volume 02 (N=32) 0.347 0.035 * _ _ WIn-ratio-ROIn,2 (N=32) 0.489 0.005 ** 0.394 0.029 * iAUC90-ratio-ROIn,2 (N=31) 0.570 <0.001 *** - - Ktrans-ratio-ROIn,2 (N=27) 0.562 0.002 ** 0.202 0.251 PE-ROIn,2 (N=32) 0.287 0.111 _ _
The predictors included in the multivariate anlaysis were : %change-L1 02, Win-ratio-ROIn,2 K trans-ratio-ROIn,2.
Their combination significantly predict % of viable tumour cells (ANOVA, F=6.249 ; p=0.002) Using these 3 predictors simultaneously, adjusted R2 was 0.337, meaning that 33.7% of variance of % viable tumour cell could be predicted by their combination
Qualitative criteria, even significantly different between GHR and PHR at t2, were removed from the analysis because of lack of reproducibility, as well as % Change-‘axb’ 02.
Gender and PE-ROIn,2 were not significantly correlated with %viable tumour cell and were consequently not included in the model.
iAUC90-ratio-ROIn,2 was also removed because of collinearity with other criteria (variance inflation factor = 3.625, tolerance = 0,276).
* : P<0.05 ; ** : p<0.01, *** :p<0.001. All cases with missing data were removed from the analysis.
11. Identification of different peripheral oedema: inflammatory response versus tumour oedema (Figure 13).
We hypothesized that different types of oedema could occur during the NAC. Indeed, at initial evaluation, peripheral oedema is often associated with enhancement after CA injection especially around the tumour, very likely to represent tumour cells spreading and infiltrating surrounding tissue. We called it ‘tumoral oedema’.
During the course of a-NAC, we observed a qualitatively different oedema pattern, with a more linear enhancement and a decrease of the extension of pure oedema. This process was seen around fibrotic processes. We called it ‘peri-granulation inflammation’ and we hypothesized that it consisted in inflammatory cells infiltrate.
The features ‘presence of an oedema’, ‘increase of fibrosis t0t1’ and ‘peripheral enhancement’ did
not demonstrate significant difference between GHR and PHR at early evaluation t1. In order to
inventory patients with ‘peri-granulation inflammation’, we combined these three features at t1 and
selected patient with oedema and peripheral enhancement actually occurring around fibrotic process. At t1, this combination of features was present in 6 patients, 5/6 GHR and 1/6 PHR.
Figure 13. Two different patterns of oedema on conventional MRI.
‘Tumoral oedema’ (in a PHR) refers to classically described oedema, with surrounding area of increased SI on T2-wi (black arrow) and focal enhancement of the oedema (orange arrow), suspected to reflect tumour
cells deposits in surrounding tissue and hypothesized to have poorer diagnosis.
‘Peri-granulation inflammation’ corresponds to less-extended oedema (white arrow on coronal fat suppressed T2-wi). Ill-defined enhancement of the oedema can be seen at the whole tumour surface, abutting
a ‘black rim’ of peripheral fibrosis. Pathological analysis on surgical specimen confirmed a good response with clean margins.
DISCUSSION
1. Patterns of response under a-NAC
Anthracycline-based NAC leads to a wide range of continuous morphologic and histologic alterations that can be observed and monitored with MRI.
Measures variations are the easiest features to obtain but demonstrate important limits. They occur after angiogenesis and architectural modifications. Size can increase secondary to necrosis, haemorrhage, tumour primary or secondary resistance. Size can decrease due to favourable event such as necrosis or retractile fibrosis, or because one compartment displays excellent response while another is clearly not affected by NAC.
Architectural features on DCE-MRI, despite subjectivity, highlight patterns of response: (i) mainly fibrotic, (ii) mainly necrotic, (iii) fibro-necrotic, and (iv) no apparent response. Interestingly sub-pattern of fibrosis could be discriminated: (i) diffuse, (ii) septa, (iii) peripheral and (iv) compartmental fibrosis. The ‘compartmental fibrosis’ sub-pattern stresses the hypothesis of primary or secondary a-NAC resistant component within a tumour that mainly favourably responds. However, there is a strong assumption that architectural ‘macroscopic’ MRI features follow modifications of tumour vascularization, assessed by DCE-MRI.
2. Improvement of early prediction with DCE-MRI
After 2 cycles of a-NAC, semi-quantitative DCE-MRI indices were able to significantly predict a poor histologic response with an excellent sensitivity (94.1%), while variations of longest diameter, bi-dimensional diameters, volume and conventional MRI qualitative analysis and T2-ratio were not significantly different between PHR and GHR, except for estimate of %fibrosis, of which inter and intra-observer reproducibilities were low.
At the end of a-NAC, all the measures, the pattern of fibrosis, several items of qualitative, semi-quantitative and semi-quantitative analyses of DCE-MRI predicted histologic response.
Overall, these results support the idea of a continuum of perfusion, architectural and dimensional alterations.
We believed that integrating the whole information from each modality of evaluation, instead of being exclusive, would improve response prediction.
However, the model (with or without taking into account gender) failed to identify 41.7% (5/12, one of them having poor quality DCE-MRI1 which was removed from the semi-quantitative and
quantitative analyses) true GHR at early evaluation. MRI follow-up of one of these 5 patients demonstrated a ‘compartmental fibrosis’: one compartment remaining unchanged, questioning in this sole case, the coherence between radiological and pathological results. The other cases