HAL Id: hal-01397883
https://hal.archives-ouvertes.fr/hal-01397883
Submitted on 15 Dec 2016
HAL is a multi-disciplinary open access
archive for the deposit and dissemination of
sci-entific research documents, whether they are
pub-lished or not. The documents may come from
teaching and research institutions in France or
abroad, or from public or private research centers.
L’archive ouverte pluridisciplinaire HAL, est
destinée au dépôt et à la diffusion de documents
scientifiques de niveau recherche, publiés ou non,
émanant des établissements d’enseignement et de
recherche français ou étrangers, des laboratoires
publics ou privés.
Spectra Descriptors
Petra Bosilj, Erchan Aptoula, Sébastien Lefèvre, Ewa Kijak
To cite this version:
Petra Bosilj, Erchan Aptoula, Sébastien Lefèvre, Ewa Kijak. Retrieval of Remote Sensing Images with
Pattern Spectra Descriptors. ISPRS International Journal of Geo-Information, MDPI, 2016, Special
Issue ”Mathematical Morphology in Geoinformatics”, �10.3390/ijgi5120228�. �hal-01397883�
Article
Retrieval of Remote Sensing Images with Pattern
Spectra Descriptors
Petra Bosilj1, Erchan Aptoula2,*, Sébastien Lefèvre1and Ewa Kijak3
1 Institut de Recherche en Informatique et Systèmes Aléatoires, Université Bretagne Sud, 56000 Vannes,
France; [email protected] (P.B.); [email protected] (S.L.)
2 Institute of Information Technologies, Gebze Technical University, 41400 Kocaeli, Turkey
3 Institut de Recherche en Informatique et Systèmes Aléatoires, Université Rennes 1, 35000 Rennes, France;
* Correspondence: [email protected]
Academic Editors: Beatriz Marcotegui and Wolfgang Kainz
Received: 5 June 2016; Accepted: 17 November 2016; Published: 2 December 2016
Abstract: The rapidly increasing volume of visual Earth Observation data calls for effective content based image retrieval solutions, specifically tailored for their high spatial resolution and heterogeneous content. In this paper, we address this issue with a novel local implementation of the well-known morphological descriptors called pattern spectra. They are computationally efficient histogram-like structures describing the global distribution of arbitrarily defined attributes of connected image components. Besides employing pattern spectra for the first time in this context, our main contribution lies in their dense calculation, at a local scale, thus enabling their combination with sophisticated visual vocabulary strategies. The Merced Landuse/Landcover dataset has been used for comparing the proposed strategy against alternative global and local content description methods, where the introduced approach is shown to yield promising performances.
Keywords:content based image retrieval; mathematical morphology; pattern spectra; remote sensing; scene description
1. Introduction
Visual Earth Observation technologies are of crucial importance to contemporary societies, as the scale of our effect on our surroundings is now greater than ever. Moreover, the rapid improvement of spatial and spectral resolutions of image acquisition devices has rendered satellite and aerial imagery an invaluable source of information with an ever-growing range of social, environmental and military applications. Consequently, this constant proliferation and increasing sophistication of remotely sensed images has created an urgent need for equally effective and efficient methods for their exploitation.
More specifically, the rapid accumulation of gigabytes worth of aerial and satellite data on a daily basis has rendered scalable, robust and automated tools, designed for their management, search, and retrieval, essential for their effective exploitation. This motivates us to focus on the retrieval of such aerial overhead images and propose a novel approach for their content based description and retrieval.
Content based image retrieval (CBIR) is typically achieved by means of computing descriptors [1–4],
either globally for the whole image [5,6] or on selected [1,7,8] or predetermined parts of the image [9,10].
In case the descriptors are computed locally on patches, which produces multiple descriptors per
image, they are first aggregated to produce a singular descriptor entry for each image [11,12]. Finally,
the image descriptors are further used in dedicated indexing schemes [9,13–15] to achieve the end goal
of successful retrieval.
Mathematical morphology has long enjoyed the attention of the remote sensing image analysis
community, especially in terms of pixel classification with morphological profiles [16] and more recently
attribute profiles [17–20], as it possesses unique tools capable of spatial-spectral content analysis. Its application to content based retrieval has, however, been surprisingly limited in this context with
using mostly texture descriptors [21,22], considering it possesses many more powerful alternatives.
One such alternative are the well-known pattern spectra [23], a multiscale tool operating globally
on connected image components, and producing the histogram-like distribution of one or more of their arbitrarily defined spatial and/or spectral attributes. Although pattern spectra are powerful content descriptors, up until recently one could only calculate them globally from a given image. This has changed through our extension to their underlying theory that has enabled their computation at a
local level [24]. Our preliminary works with local pattern spectra have focused on their successful
calculation from local salient regions [25,26].
Motivated by these results, in this paper, we present a novel content description strategy relying for the first time on the dense calculation of local pattern spectra from a regular grid, and further combine them with vectors of locally aggregated descriptors (VLAD). The resulting content description solution is tested against global pattern spectra, and alternative local strategies using the largest aerial CBIR dataset that is publicly available, namely the UC Merced Landuse/Landcover dataset, where it achieves promising performances.
The paper is organized as follows. Section2reviews previous work on the content based retrieval
of aerial and satellite imagery and elaborates on our contributions. Next, Section3recalls the definition
of pattern spectra, both as global and local descriptors, and also details the different attributes involved
in our study. We describe the evaluation protocol used in our experiments in Section4, while results
are discussed in Section5before we conclude and give future research directions.
2. Previous Work
Content based image retrieval has come a long way in the last 20 years. After the initial successful feasibility tests, a lot of effort has been dedicated on bridging the “semantic gap”, i.e., the gap between lower level content descriptors and the semantics of an image, and on the implementation of further retrieval modalities (e.g., action based retrieval from video, etc.). For an in-depth study of the issues
related to CBIR and a comprehensive review of the field, the reader is referred to [27].
The relatively recent advent of very large commercial databases of remotely sensed images has led the research community to adapt and further develop the existing CBIR solutions for this new context, characterized primarily by an overhead viewpoint, high spatial resolution and heterogeneous content. Consequently, a wide array of new strategies has emerged, of which an overview follows. 2.1. Related Work
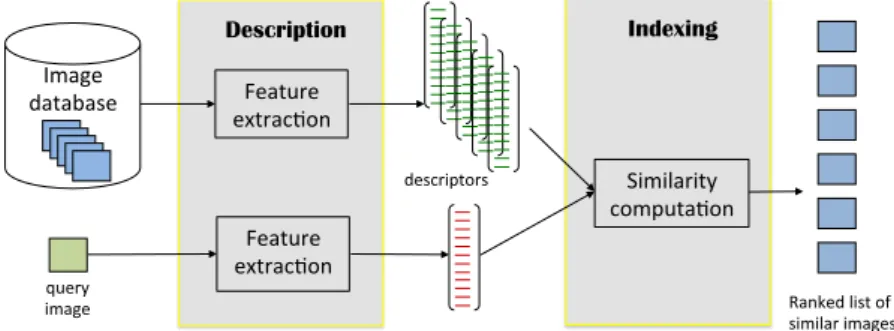
A standard CBIR system is composed by at least two components: its content description or feature extraction module, which reduces the visual data into compact representations, and the similarity measure which will be used on the extracted features in order to determine the images
similar to the query (cf. Figure1).
Image database query image descriptors Feature extrac5on Feature extrac5on Similarity computa5on Ranked list of similar images Description Indexing
As far as the content description of aerial and satellite images, with the end goal of retrieval, are concerned, one encounters a rich variety of feature extraction solutions. Early attempts have started
with the basic statistical properties of spectral image classes [28], and quickly advanced to adapting
already tested methods of color CBIR to this field, using shape [29] and especially known texture
descriptors such as Gabor filters [30], morphological covariance [21], Local Binary Patterns [31] and
grayscale co-occurrence matrices [32].
More recent approaches, however, in parallel to the developments in the computer vision field, have oriented themselves towards local description strategies and visual vocabularies. In this regard,
GIST [33], SIFT [9,34], and MSER [35] have been thoroughly studied and SIFT has been concluded to
be the best performing among them. Moreover, new and challenging datasets have been also proposed with the CBIR of geographical images in mind, with the Landcover/Landuse UC Merced dataset being the largest to date among them, possessing 21 classes and 2100 samples. As such, it has been rapidly adopted by the scientific community of both content based retrieval and scene classification for remote sensing [9,21,22,36–44].
As of late, further works published in this field have focused on combining both global and
local descriptors [45], while others have concentrated on exploiting user feedback through active
learning [46]. Finally, deep learning techniques have also been applied to the problem under
consideration, mostly in the form of convolutional neural networks [44].
2.2. Our Contributions
In this paper, we explore the potential of local pattern spectra, computed with a dense strategy, for the content description of aerial images, with CBIR being the end goal. We further combine them with the vector of locally aggregated descriptors (VLAD) to form a visual vocabulary.
In more detail, pattern spectra are one of the oldest and most powerful content descriptors that
are offered by mathematical morphology [23]. They were initially introduced for describing the size
distribution of objects within images through histogram-like representations. In time, they have been
extended [6,47] to describe not only the size, but the shape and texture distribution as well as the
distributions of any arbitrarily selected attribute among connected image components. Furthermore, their efficient implementation through tree based image representations has further rendered them effective, efficient and multiscale, general purpose, holistic (i.e., global) content description tools. Hence, our first contribution to the state-of-the-art, is applying pattern spectra for the first time to the CBIR of aerial images.
Moreover, the theoretical background needed in order to compute them locally has only recently
been introduced [24]. The first reported implementation of local pattern spectra has been in the context
of general purpose image classification, where they have been computed from salient regions that
have been detected by means of MSER [25,26]. Following the promising performances that have been
obtained in that context, in this paper, for the first time, we explore calculating local pattern spectra not from salient regions, but instead from the entire input image, using not a global approach but rather a dense grid with fixed steps. This constitutes the second novelty aspect of our approach.
In addition, following the work of Ozkan et al. [9], where SIFT has been explored along with
VLAD, we investigate and report the results of combining locally computed pattern spectra along with the visual vocabulary obtained through VLAD. In this regard, our work is the second time in the state-of-the-art that any morphological approach is used to form a visual vocabulary (with the
first being [22]), and the first time with local pattern spectra, which constitutes the third original
contribution of our work to the state-of-the-art.
The proposed approach is tested and validated with the largest publicly available dataset of its kind, and is shown to be comparable in terms of retrieval performance to the widely-used SIFT descriptors at a much shorter feature vector length.
3. Pattern Spectra
This section will first recall the principles behind pattern spectra, and then elaborate on the particularities and differences between their global and local implementation.
Pattern spectra are histogram-like structures originating from mathematical morphology,
commonly used for content analysis [23], and capture information on the distribution of sizes
and shapes of image components. They can be seen as estimates of probability density functions,
with histograms as their basic and oldest form [48]. They can be efficiently computed using a technique
known as (size or shape) granulometry [49,50] on a max-tree and min-tree hierarchy [51,52].
3.1. Min- and Max-Trees
The min- and max-trees [51,52] are hierarchical decompositions of an image, working with its
level sets. In more detail, the upper level sets are defined for each gray level k of an image I. The upper
level set at level k comprises all the pixels p with the gray level value f(p)higher than the threshold k,
Lk= {p∈ I|f(p) ≥k}. Each level set can contain several connected components, called also the peak
components. The peak components of the upper level setLkare denoted byLk,i(where i is from some
index set) and are nested for the decreasing values of k. When organized in a hierarchy, these nested
components form a hierarchy called a max-tree (cf. Figure2) which contains a node corresponding to
each peak componentLk,i.
3
3
3
3
3
3
3
3
2
2
2
3
0
3
3
2
1
2
3
0
3
3
2
2
2
3
0
3
3
2
4
2
3
3
3
3
2
2
2
3
3
3
3
3
3
3
3
3
3
(a)L
4,1L
3,1L
2,1L
1,1L
0,1 (b)Figure 2.The max-tree for the shape in (a) is displayed in (b). The regions corresponding to the nodes are displayed besides them, with the level sets indicated inside the nodes.
The max-tree hierarchy contains bright image details and regions (local gray level maxima) in its leaves. On the contrary, for operating with dark image regions, lower level sets denoted by
Lk = {p ∈ I|f(p) ≤ k}are used, and organized in a hierarchy called a min-tree. The min-tree
hierarchy can also be constructed as a max-tree of the inverted image−I, due to the duality relation
between the two hierarchies. As the hierarchies themselves store the gray levels of all the components, a full image can be reconstructed directly from its min and max-trees.
3.2. Filtering and Granulometries
To characterize the regions of these hierarchies, we can assign to each node the attributes
pertaining to the characteristics of that node. An attribute K(·) is increasing if, for two nested
regionsLk,i ⊆ Ll,j, its value is always greater for the larger region: K(Ll,j) ≥K(Lk,i). Consequently,
the attribute value of a node, K(Lk,i), will be smaller than any of the values of its ancestors. These
If this property does not hold, the attribute is non-increasing. Out of all the non-increasing attributes, here we are interested by the strict shape attributes, which respond only to region shape
and are thus invariant to scaling, rotation, and translation [49].
We rely on the standard approach of measuring the number of pixels of a region to describe its size,
which is thus represented by the corresponding area A(Lk,i). We tackle the shape information through
two different attributes. The first attribute used is an elongation measure of the region, called the corrected noncompactness (CNC): CNC(Lk,i) =2π I(L k,i) A(Lk,i)2 + 1 6A(Lk,i) ! (1)
where I(Lk,i)is the moment of inertia of the region here. This attribute in fact corresponds to the first
moment invariant of Hu [53] corrected for its application on the discrete image space, as opposed to the
continuous space [54]. It is a shape attribute commonly used in remote sensing [20]. Thus, the first term
I(Lk,i)
A(Lk,i)2 computes the first moment invariant of Hu, while the term
1
6A(Lk,i)corresponds to the correction
factor. This attribute takes the value of 1 for a perfectly circular (compact) object, which grows as the shape of the object approaches that of a long thin line. However, in practice, values higher than a
threshold of around 50–60 tend to be discarded when working with this attribute [6,24] as the regions
achieving such high noncompactness values are extremely rare (1% or less of all the regions per min and max-trees corresponding to the dataset used in this paper). Other measures exist which correspond
better to the elongation of the object, such as geodesic diameter [55]. However, while such attributes
are needed when the region selection process depends solely on one (or several) attributes such as
extraction of fingerprint structures presented in [56], the pattern spectra approach presented hereafter
is more robust due to relying on multiple attribute measures from a single region to characterize it with a region descriptor. Additionally, even the efficient approximation of the geodesic diameter called
barycentric diameter [56] still requires modification to the max-tree algorithm due to the max-tree
being suited only for calculation of attributes which can be efficiently updated as the tree is constructed from the local maxima by an aggregation process. Thus, in the efficient implementation of filtering using the barycentric diameter, the max-tree traversal order is modified to better suit the nature of the attribute, and only partial information pertaining to the attribute is updated during the tree traversal, while the final attribute values still need to be computed by examining the pixels of each node in the traversal anew.
The second non-increasing attribute we use is Shannon entropy, defined using the frequency with
which a pixel of gray level i occurs in the regionLk,i, expressed by the probability p(i,Lk,i):
H(Lk,i) = −
∑
i∈ gray levels
p(i,Lk,i)log2p(i,Lk,i) (2)
Low attribute values ofH(·)will be observed when the region content is homogeneous in terms
of gray level distribution, while heterogeneous regions containing many different gray levels will have higher values of this attribute. However, the range of this attribute is much smaller than that of the
CNC attribute, so that the attribute values of interest are between 0 and 8 [6]. Attributes assigned
to nodes can also be based on more complex notions, such as texture, motion, or even similarity to
predefined shapes [57]. Many other attribute examples can be found in [49,51,58].
After the tree construction phase and the attribute assignment of their nodes, we can consider
nodes for further processing only if their attribute value K(Lk,i)is above a certain threshold t. The trees
are then pruned by removing all the connected components below this threshold. Processing the hierarchies in such a manner (in which the decision to preserve or reject the nodes of the hierarchy
is based on their attribute values) is called filtering. For a general attribute K(·) and threshold t,
we represent by Ψt the filter which keeps only the nodes with K(Lk,i) > t, and Ψt(I)the image
When performing a single attribute filtering with an increasing attribute such as size, the resulting
operationΓtwill have properties of an attribute opening (i.e., anti-extensivity, increasingness and
idempotence). A size granulometry [49] is a series of such openings{Γti}with increasing size, ti+1>ti,
which removes more components from the image in every step and can be seen as a set of sieves of increasing grades. After each consecutive opening, a granulometry notes the amount of detail still
present in the image. When using a non-increasing, scale-invariant attributeΦt, the resulting attribute
filtering, or attribute thinning is still anti-extensive and idempotent, but no longer increasing. If the
imageΦt(I)is reconstructed from a tree pruned by applying the subtractive rule [50], the extension of
the technique to shape granulometries [50] allows noting the amount of image detail across classes
based on shape or other scale-independent attribute measures of the regions. The subtractive rule used for pruning the tree is performed by removing only the components which do not satisfy the attribute,
but preserving the local contrast of the kept components. When such a rule is used,Φt(I)contains
only the components with K(Lk,i) >t, and, more importantly, the difference image I−Φt(I)contains
only the components with K(Lk,i) ≤t.
3.3. Global Pattern Spectra
Contrary to granulometries, pattern spectra focus on the amount of detail removed between
consecutive openings. The size pattern spectrum [23] is based on area openings and size
granulometries, and is represented by a histogram over all the different size classes. Similarly, a
shape pattern spectrum [50] is based on the shape granulometry corresponding to a histogram of
component attribute distribution over a range of shape classes. Every size class (resp. shape class) in the size pattern spectrum (resp. shape pattern spectrum) is described by its Lebesgue measure corresponding to the amount of detail falling into that class. The pattern spectra can be interpreted as probability density function estimates in their simplest, histogram form, describing the probability of a component with a certain size or shape to be present in the image. In order to put the definition of the
size pattern spectra from [23] into a form more suitable for grayscale images I, we define the volume
of a grayscale image I as:
V(I) =
∑
k
A(Lk) =
∑
k
∑
iA(Lk,i) (3)
Then, for a size granulometry{Γti}, we can define the size pattern spectrum{sΓ,ti}as:
sΓ,ti =V(Γti−1(I)) −V(Γti(I))
sΓ,tmin=V(I) −V(Γtmin(I))
(4)
Similarly, according to [50], for a shape granulometry{Φti}, the shape pattern spectrum{sΦ,ti}
can be defined as:
sΦ,ti =V(Φti−1(I)) −V(Φti(I))
sΦ,tmin =V(I) −V(Φtmin(I))
(5) Combining shape and size pattern spectra into a unique 2D histogram showing the amount of
image detail across dedicated size-shape bins produces a shape-size pattern spectrum [47]. For a
size granulometry{Γti}and shape granulometry{Φuj}, we define the combined shape-size pattern
spectrum{sΓ,Φ,ti,uj}as:
sΓ,Φ,ti,uj =V(Γti−1(Φuj(I))) −V(Γti(Φuj(I))) +V(Γti(Φuj−1(I))) −V(Γti(Φuj(I))) (6)
=V(Γti−1(Φuj−1(I))) −V(Γti(Φuj(I)))
sΓ,Φ,tmin,uj =V(Φuj−1(I)) −V(Γtmin(Φuj(I)))
sΓ,Φ,ti,umin=V(Γti−1(I)) −V(Γti(Φumin(I)))
When calculated for a whole image, they can be used as translation, scale and rotation invariant
image descriptors and have been successfully applied to image classification [47] and retrieval [6]. It is
possible to use the combinations of attributes describing different object properties, such as orientation,
color and intensity as explored in [59]. As we aim the descriptor to encode the difference between
images with high and low content, we do not normalize the produced descriptors, but simply store the amount of image detail (Lebesgue measure of contributing components) as a ratio of total image size. The pattern spectra are parametrized by choosing the number of bins to be used for each attribute, as well as the maximum value of each attribute to be considered in the histogram. The bin distribution over different shape and size classes is typically logarithmic over the chosen range of attribute values. When used in this manner, we will refer to the produced global image descriptors as Global Pattern Spectra (GPS).
3.4. Local Pattern Spectra
Recently, a local extension of pattern spectra has been proposed [24,25], designed to characterize
patches rather than the whole image, i.e., either specifically selected regions of interest or patches of predetermined shape and size. A local shape-size pattern spectrum is obtained by applying the series
of operators{sΓ,Φ,ti,uj}to a specific connected componentL
k,i, or more generally a regionRinstead of
the whole image I. They were initially introduced on maximally stable extremal regions (MSER) [7] for
reasons of computational efficiency, as MSERs can be extracted from max-tree and min-tree hierarchies in a straightforward manner. Initial experimental results showed that these descriptors can achieve
competitive performances in the context of grayscale image retrieval [24], motivating us to further
explore Local Pattern Spectra (LPS) in the context of remote sensing along more diversified strategies. The inevitably smaller scale of objects contained within aerial images, with respect to regular color photographs, alleviates the need for extracting regions of interest using detection steps such as MSER. This is why we have chosen to instead employ a dense regular grid strategy for computing LPS. More specifically, the LPS are computed on local rectangular patches defined on a densely sampled
regular grid over the image (cf. Section4for the details). If all the preselected local patches are of the
same (or very similar) size, the scale invariance property holds in the extension of GPS to LPS [25].
However, in order to achieve image description at multiple scales, different sizes of local patches can be selected to correspond to each scale used. Due to the logarithmic binning, a common reference scale M is used to allow for descriptor comparison in a scale-invariant manner. The local pattern spectrum
{sΓ,Φ,ti,uj,M}(R)is then defined as:
{sΓ,Φ,ti,uj,M}(R) = {sΓ,Φ,ti,uj}(
M
A(R)R) (7)
where aRin general denotes the scaling of the regionR by a. This technique, introduced in [24],
does not increase the complexity of the approach as this is achieved by simply scaling the Lebesgue measure of individual contributions during the descriptor calculation.
4. Experimental Set-Up
4.1. Dataset and Evaluation Metrics
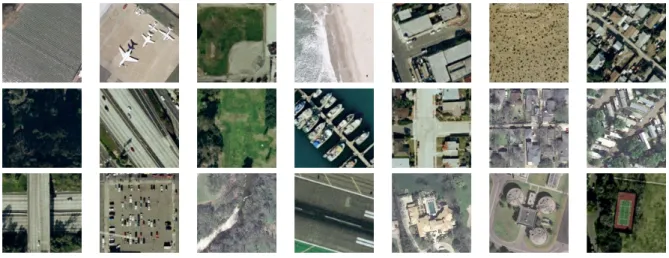
All of our experiments have been conducted on the publicly available UC Merced Dataset [34].
It contains 2100 color RGB images organized into 21 classes (100 images per class), examples of which
are shown in Figure3. All images are of size 256×256 pixels at a spatial resolution of 30 cm. We have
computed our descriptors first on the grayscale versions of the images, with the conversion being
Gray=0.299×R+0.587×G+0.114×B.
To additionally boost the performance of the LPS descriptors, we applied data augmentation techniques to the input images of the validation dataset. The best performance was achieved when all
The LPS calculation is then repeated on the augmented images and appended to the descriptors obtained for non-augmented data. It is important to note that the benefit of this approach comes from the fact that different parts of the image are used for descriptor calculation, as the descriptors themselves are scale invariant. For this reason, the GPS descriptors are not calculated on the augmented data, as rotating an image does not change its content (as measured by the GPS).
Figure 3.Illustration of the 21 classes from the Merced dataset.
Figure 4.Examples of applying data augmentation on the images from the Merced dataset. The first row shows the original images, while the corresponding 45° rotated images used for data augmentation are shown in the second row.
The evaluation metric chosen is average normalized modified retrieval rank (ANMRR), as it is the most commonly used metric on this dataset, thus allowing for straightforward comparison with
other published results [9,21,22,34]. It is commonly used to measure the effectiveness of retrieval [60].
Given a query q or all the queries of a same class, a number K(q)is defined, which denotes that only
the first K(q)returned images are considered as feasible in terms of retrieval evaluation. It is often set
as twice the size of the ground truth set NG(q). Assuming that the kthground truth image is retrieved
at Rank(k), a penalty function Rank∗(k)is defined for each retrieved item:
Rank∗(k) =
(
Rank(k), if Rank(k) ≤K(q)
From all the penalties Rank∗(k)for each query q, the average rank (AVR) for that q is defined as: AVR(q) = 1 NG(q) NG(q)
∑
k=1 Rank∗(k) (9)After the intermediate step, ANMRR is directly defined as:
ANMRR= 1 NQ NQ
∑
q=1 AVR(q) −0.5(1+NG(q)) 1.25 K(q) −0.5(1+NG(q)) (10)where NQ is the number of queries. Thus, ANMRR obtains values in the range of 0 for best results, and 1 for worst results.
For the sake of completeness, we also express our results in terms of another retrieval measure, namely mean Average Precision (mAP). This measure is designed specifically to evaluate ranked
retrieval results [61] and provide a single measure of quality across all recall levels of a system for a
set of multiple queries. For a single query image q, if a retrieval system returns K(q)results, we can
calculate precision and recall considering only the first m returned images in an unordered fashion. Precision at m is calculated as the ratio between the number of correct (relevant) images in the set of results and the total number of images retrieved at that point, m:
precision(m) = relevantRetrieved(m)
m (11)
while the recall at m is defined as the ratio between the number of relevant images in the set of results and the total number of relevant images for that query:
recall(m) = relevantRetrieved(m)
relevantTotal (12)
Calculating and plotting the precision and recall values for a single query in a ranked retrieval context produces a precision-recall curve. The area under this curve over all K results corresponds to AP, the Average Precision of a query, and is equivalent to averaging the precision values obtained for the set of top K retrieval results, after retrieving each new relevant result:
AP= K
∑
m=1 precision(m) ×∆ recall(m) (13) = ∑ K m=1precision(m) ×relevant(m) relevantTotalwhere relevant(m)is an indicator variable with the value 1 if the m-th retrieved image is relevant.
Finally, the mAP is calculated as the mean value of the Average Precision for all the queries. This method does not penalize incorrect predictions, allowing for a large number of retrieval results to be examined, while valuing the order of predictions by penalizing ranking incorrect predictions before the correct ones.
4.2. Settings of Pattern Spectra Approaches 4.2.1. Global Pattern Spectra
We chose to use the 2D GPS descriptors to obtain a baseline performance for the family of Pattern Spectra descriptors. In this baseline approach, we calculate the GPS descriptors from entire images. The bin sizes have been determined experimentally, where the bin sizes used in previous published
works were used as a starting point [6]. This resulted in choosing to use 10 bins for the size (area)
of the image. The maxima for the shape attributes were determined experimentally to be 56 for the
CNC attribute and eight for theHattribute. As we calculate the GPS from both the min-tree and the
max-tree of every image, this leads to global descriptors of length 6×10+6×10=120.
We report in Table1the results using the Area+CNC and Area+Has shape attributes, and observe
a further improvement when combining them into a single descriptor of length 240. Calculating GPS from each grayscale channel of the RGB images separately (i.e., marginally) has been also explored, but the results are not reported due to negligible improvements and because the approach cannot be practically implemented with multi-channel images possessing an arbitrary number of channels. 4.2.2. Local Pattern Spectra
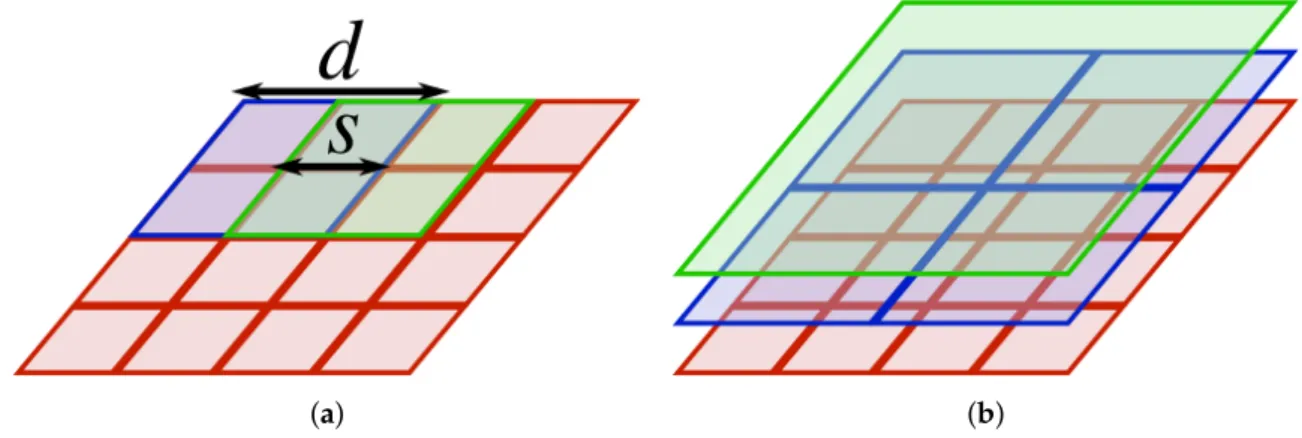
In order to improve the baseline GPS approach, we have first focused on a single-scale, local approach. Here, the image is densely sampled and the LPS are calculated on regular rectangular
image patches over a grid on the image, as shown in Figure5a. The patch dimensions have been
determined empirically to be between d = 32 and d = 128 pixels, and the dimensions of 80×80
pixels were determined to be optimal. Similarly, a distance of 16 pixels between patch centers has
been selected for the best performance among the tested s=8, 16, 32 pixels. Using eight bins for the
size attribute and six for the shape, resulting in a histogram of size 8×6, was found to exhibit the
best performance with respect to the size of the LPS. This also agrees with our previous experiments
of LPS on salient regions [24]. As we still calculate two histograms per image patch (one per tree),
the final descriptor size of LPS is 8×6+8×6=96 (Table1—dense LPS). Since all patches possess the
same size (contrary to salient regions), there is no need for any additional steps to ensure the scale invariance of the descriptors.
(a) (b)
Figure 5.The illustration of how the patches cover the densely sampled image. In (a), the coverage on a single scale is shown. The patch dimensions are d×d, and the parameter s determines the offset between the centers of the patches; in (b), three final layers in a pyramid of patches covering the image are shown (no overlap between the patches is shown in this example for clarity).
We have further experimented with LPS by calculating it across multiple scales, using a multiscale
pyramid of patches (Table1—pyramid LPS). The patch size in the lowest scale was set to 32×32
pixels and the size of patch increases for each level of the pyramid (2×along each dimension), as
shown in Figure5b. As the size of patches used for LPS is no longer consistent, we follow the strategy
introduced in our previous work [24] to ensure scale invariance by using a common reference scale
for all the patches (set to the patch size on the second scale, 64×64). The distance between the patch
centers is set to 16 pixels across all scales, thus resulting in the same descriptor length of 96, but with three times more descriptors calculated per image.
We have tested both dense LPS and pyramid LPS with and without data augmentation. Moreover, for both LPS based approaches, the VLAD indexing scheme has been used to produce the final
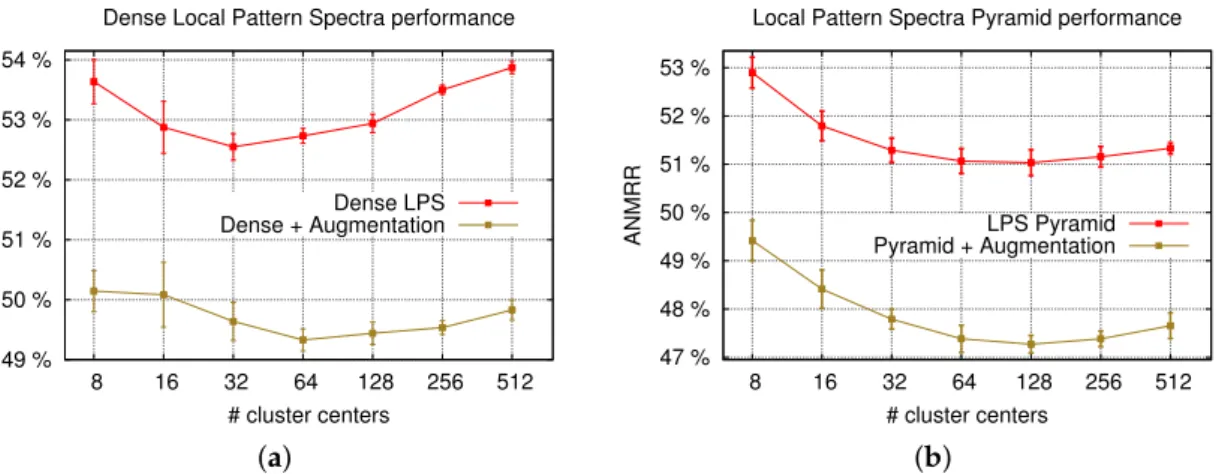
image descriptors [11] (Figure6). As the crucial parameter of VLAD is the number of cluster centers, we report the best performance for each LPS approach assuming different numbers of cluster centers,
ranging from k = 8 to k = 512 (Figure7b). To construct the vocabulary for VLAD, we rely on
another publicly available dataset, namely ImageNet’s Large Scale Visual Recognition Challenge 2010
(ILSVRC2010) Validation dataset [62]. Let us underline that this dataset does not contain any remote
sensing data. The descriptors are calculated for the first 500 images of this ImageNet dataset (with the same parameters for both the dense samples and the pyramid approach, where the pyramid patch size
was stopped at 256×256 pixels), and a random subset of these descriptors is used for each experiment.
No data augmentation was performed on this dataset, as it has been used only for providing the visual words for the VLAD cluster center calculation.
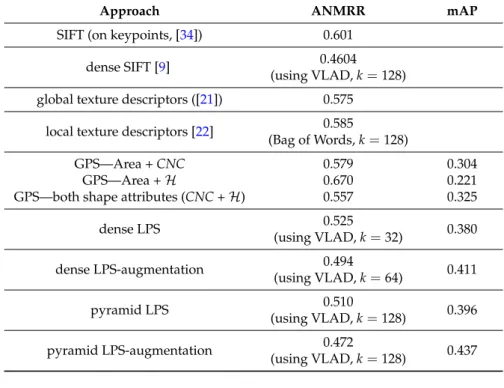
Table 1.The retrieval performances of different local and global approaches on Merced dataset.
Approach ANMRR mAP
SIFT (on keypoints, [34]) 0.601
dense SIFT [9] 0.4604 (using VLAD, k=128) global texture descriptors ([21]) 0.575
local texture descriptors [22] 0.585
(Bag of Words, k=128)
GPS—Area + CNC 0.579 0.304
GPS—Area +H 0.670 0.221
GPS—both shape attributes (CNC +H) 0.557 0.325
dense LPS 0.525 0.380 (using VLAD, k=32) dense LPS-augmentation 0.494 0.411 (using VLAD, k=64) pyramid LPS 0.510 0.396 (using VLAD, k=128) pyramid LPS-augmentation 0.472 0.437 (using VLAD, k=128) Local Pa?ern Spectra
VLAD
Feature encoding and pooling Image descriptor49 % 50 % 51 % 52 % 53 % 54 % 8 16 32 64 128 256 512 ANMRR # cluster centers
Dense Local Pattern Spectra performance
Dense LPS Dense + Augmentation (a) 47 % 48 % 49 % 50 % 51 % 52 % 53 % 8 16 32 64 128 256 512 ANMRR # cluster centers
Local Pattern Spectra Pyramid performance
LPS Pyramid Pyramid + Augmentation
(b)
Figure 7.Experiments showing the influence of the number of VLAD cluster centers as well as using the descriptors based on augmented data. In (a), the retrieval results when calculating the LPS on a densely sampled image are shown. The results when using a pyramid of patches are shown in (b). Each data point was obtained by repeating the experiments between 10 and 20 times with different random values used to initialize the VLAD clustering. The error bars on the figures express the scatter in the results, and correspond to one standard deviation.
5. Results and Discussion
Our overall findings are shown in Table1. From the obtained results, we report that the GPS
baseline, despite being a holistic approach, already outperforms both the previously reported global
and local morphological approaches based on texture description [21,22], as well as the seminal SIFT
approach based on salient keypoints [34].
More specifically, GPS have first been calculated along Area+CNC, since it is the shape attribute used most commonly for pattern spectra calculation. Then, we have additionally experimented with
the Area+Hcombination for GPS (suggested by [6] to be the second most effective shape attribute).
The second set of pattern spectra, based onH, performs worse by itself, which can be explained by the
lower discriminatory power of theHattribute, since this attribute obtains values from a smaller range
than CNC. Nevertheless, the combination of the two attributes results in a performance improvement, thus showing their complementary nature. The best results obtained with GPS have reached an ANMRR of 55.7% (or the equivalent mAP of 32.5%).
As far as the proposed dense LPS and VLAD based approach is concerned, we have obtained more significant improvements there. The first LPS approach (dense LPS), where the descriptors are
calculated from densely and regularly sampled patches of size 80×80 pixels with 16 pixels between
the cluster centers, produces 144 descriptors per image and achieves an ANMRR of 52.5% (or mAP of 38%).
However, the LPS results are reported using only the CNC attribute, since, contrary to GPS, their combination with the other shape attribute did not result in an improvement. This can be explained by the fact that the amount of detail contained in the densely sampled patches is much smaller than in the whole image as in the case of GPS, hence resulting in fewer samples (regions)
employed during histogram calculation. Moreover, the range of theHattribute is typically smaller
than that of the CNC attribute; consequently, the histograms are no longer representative of the distribution of this attribute in LPS, due to the lack of sufficient sample regions. Data augmentation, on the other hand, leads to an improvement of three percentile points for both ANMRR and mAP
(Figure7a). This figure also shows the effect of the number of VLAD cluster centers on performance,
where it can be observed that the best performance is achieved for a relatively low number of cluster centers. It can also be seen that the optimal number of cluster centers shifts towards greater values when data augmentation is applied, due to the greater variability expressed in the descriptors.
The last improvement on the proposed approach has been achieved through multiscale LPS calculation (pyramid LPS). This strategy results in an approximately three-fold increase in the number of descriptors, producing specifically 476 descriptors per image due to the multiple scales; while it
further improves its performances by means of data augmentation as shown in Figure7b.
Moreover, a similar trend in the number of cluster centers can also be observed between the augmented and non augmented versions of pyramid LPS, as they both achieve their optimum level for the same number of cluster centers. When compared against the single scale dense approach, the difference can be explained by the increase in the descriptor complexity as well as their number. We note that this strategy contains the GPS approach, since the final scale of the LPS pyramid are the images themselves.
Overall, the best LPS based results that have been achieved are 47.2% ANMRR (corresponding to 43.7% mAP), and show an improvement over all previous morphology-based approaches, as well as the
seminal keypoint based SIFT approach on this dataset [34]. Furthermore, our results are comparable to
the dense SIFT+VLAD approach of [9] with only a 1.2% difference in ANMRR performance. However,
let us highlight all the same that we achieve this by using shorter descriptors (of length 96 for LPS
and 128 for SIFT), as well as by employing fewer descriptors ([9] reports an offset of 10 pixels and five
pyramid levels, while we use a 16 pixel offset across four different scales).
6. Conclusions
In this paper, we have employed both global and local pattern spectra in the context of geographical image retrieval, and implemented pattern spectra for the first time with a dense strategy, in combination with the VLAD indexing scheme. We have evaluated the retrieval performance of the Global Pattern Spectrum as well as of its new local counterpart, and compared them to the performance of other state-of-the-art approaches. We have additionally expressed our results in terms of mAP, another commonly used measure in retrieval, allowing for easier comparison to the performance of the descriptors on different datasets. Our descriptor outperforms the seminal keypoint based SIFT
approach of [34] and produces the best morphology-based results thus far, outperforming all previous
morphological approaches.
When compared to the dense SIFT approach of [9], we obtain similar results using the VLAD
indexing scheme, with our performance being slightly lower by 1.2% ANMRR. However, the advantage of our descriptor is that, despite its sparser sampling, it relies on far shorter feature vectors (75% length of the dense SIFT descriptors), which leads to higher retrieval speeds.
Having established a multiscale and effective LPS based content based description solution, future work will focus on exploiting the multi-variate structure of remote sensing images, which nowadays routinely reaches the level of hundreds of bands in the case of hyperspectral images.
Acknowledgments:This work was supported by the French Agence Nationale de la Recherche (ANR) under reference ANR-13-JS02-0005-01 (Asterix project) by the BAGEP Award of the Science Academy and by the Turkish TUBITAK Grant 115E857.
Author Contributions: This paper builds upon the doctoral work of Petra Bosilj, jointly supervised by Sébastien Lefèvre and Ewa Kijak. All authors contributed to the design of the method. Petra Bosilj and Erchan Aptoula conceived, designed, and performed the experiments. All authors contributed to the writing of the paper.
Conflicts of Interest:The authors declare no conflict of interest. The founding sponsors had no role in the design of the study; in the collection, analyses, or interpretation of data; in the writing of the manuscript, and in the decision to publish the results.
References
1. Bay, H.; Ess, A.; Tuytelaars, T.; Van Gool, L. Speeded-up robust features (SURF). Comput. Vis. Image Underst.
2008, 110, 346–359.
2. Tola, E.; Lepetit, V.; Fua, P. A fast local descriptor for dense matching. In Proceedings of the IEEE Conference on Computer Vision and Pattern Recognition, Anchorage, AK, USA, 23–28 June 2008; pp. 1–8.
3. Alahi, A.; Ortiz, R.; Vandergheynst, P. Freak: Fast retina keypoint. In Proceedings of the IEEE Conference on Computer Vision and Pattern Recognition, Providence, RI, USA, 16–21 June 2012; pp. 510–517.
4. Lowe, D.G. Distinctive image features from scale-invariant keypoints. Int. J. Comput. Vis. 2004, 60, 91–110. 5. Datta, R.; Joshi, D.; Li, J.; Wang, J.Z. Image retrieval: Ideas, influences, and trends of the new age.
ACM Comput. Surv. 2008, 40, doi:10.1145/1348246.1348248.
6. Tushabe, F.; Wilkinson, M.H.F. Content-based image retrieval using combined 2D attribute pattern spectra. In Advances in Multilingual and Multimodal Information Retrieval; Springer: Budapest, Hungary, 2008; pp. 554–561. 7. Matas, J.; Chum, O.; Urban, M.; Pajdla, T. Robust wide-baseline stereo from maximally stable extremal
regions. Image Vis. Comput. 2004, 22, 761–767.
8. Mikolajczyk, K.; Schmid, C. An affine invariant interest point detector. In Proceedings of the European Conference on Computer Vision, Copenhagen, Denmark, 28–31 May 2002; pp. 128–142.
9. Ozkan, S.; Ates, T.; Tola, E.; Soysal, M.; Esen, E. Performance analysis of state-of-the-art representation methods for geographical image retrieval and categorization. IEEE Geosci. Remote Sens. Lett. 2014, 11, 1996–2000.
10. Iscen, A.; Tolias, G.; Gosselin, P.H.; Jégou, H. A comparison of dense region detectors for image search and fine-grained classification. IEEE Trans. Image Process. 2015, 24, 2369–2381.
11. Jégou, H.; Douze, M.; Schmid, C.; Pérez, P. Aggregating local descriptors into a compact image representation. In Proceedings of the IEEE Conference on Computer Vision and Pattern Recognition, San Francisco, CA, USA, 13–18 June 2010; pp. 3304–3311.
12. Sivic, J.; Zisserman, A. Video Google: Efficient visual search of videos. In Toward Category-Level Object Recognition; Ponce, J., Hebert, M., Schmid, C., Zisserman, A., Eds.; Springer: Budapest, Hungary, 2006; pp. 127–144.
13. Wang, M.; Wan, Q.M.; Gu, L.B.; Song, T.Y. Remote-sensing image retrieval by combining image visual and semantic features. Int. J. Remote Sens. 2013, 34, 4200–4223.
14. Espinoza-Molina, D.; Datcu, M. Earth-Observation image retrieval based on content, semantics, and metadata. IEEE Trans. Geosci. Remote Sens. 2013, 51, 5145–5159.
15. Bahmanyar, R.; Cui, S.; Datcu, M. A comparative study of bag-of-words and bag-of-topics models of EO image patches. IEEE Geosci. Remote Sens. Lett. 2015, 12, 1357–1361.
16. Pesaresi, M.; Benediktsson, J. A new approach for the morphological segmentation of high-resolution satellite imagery. IEEE Trans. Geosci. Remote Sens. 2001, 39, 309–320.
17. Dalla Mura, M.; Benediktsson, J.; Waske, B.; Bruzzone, L. Morphological attribute profiles for the analysis of very high resolution images. IEEE Trans. Geosci. Remote Sens. 2010, 48, 3747–3762.
18. Ghamisi, P.; Dalla Mura, M.; Benediktsson, J.A. A survey on spectral-spatial classification techniques based on attribute profiles. IEEE Trans. Geosci. Remote Sens. 2015, 53, 2335–2353.
19. Aptoula, E. Hyperspectral image classification with multi-dimensional attribute profiles. IEEE Geosci. Remote Sens. Lett. 2015, 12, 2031–2035.
20. Aptoula, E.; Dalla Mura, M.; Lefèvre, S. Vector attribute profiles for hyperspectral image classification. IEEE Trans. Geosci. Remote Sens. 2016, 54, 3208–3220.
21. Aptoula, E. Remote sensing image retrieval with global morphological texture descriptors. IEEE Trans. Geosci. Remote Sens. 2014, 52, 3023–3034.
22. Aptoula, E. Bag of morphological words for content-based geographical retrieval. In Proceedings of the International Workshop on Content-Based Multimedia Indexing, Klagenfurt, Austria, 18–20 June 2014. 23. Maragos, P. Pattern spectrum and multiscale shape representation. IEEE Trans. Pattern Anal. Mach. Intell.
1989, 11, 701–716.
24. Bosilj, P.; Wilkinson, M.H.F.; Kijak, E.; Lefèvre, S. Local 2D pattern spectra as connected region descriptors. In Proceedings of the International Symposium on Mathematical Morphology, Reykjavik, Iceland, 27–29 May 2015; pp. 182–193.
25. Bosilj, P.; Kijak, E.; Wilkinson, M.H.F.; Lefèvre, S. Short local descriptors from 2D connected pattern spectra. In Proceedings of the IEEE International Conference on Image Processing, Quebec City, QC, Canada, 27–30 September 2015.
26. Bosilj, P.; Wilkinson, M.H.F.; Kijak, E.; Lefèvre, S. Local 2D pattern spectra as connected region descriptors. Math. Morphol. Theory Appl. 2016, 1, 203–215.
27. Liu, Y.; Zhang, D.; Lu, G.; Ma, W.Y. A survey of content-based image retrieval with high-level semantics. Pattern Recognit. 2007, 40, 262–282.
28. Bretschneider, T.; Cavet, R.; Kao, O. Retrieval of remotely sensed imagery using spectral information content. In Proceedings of the IEEE International Geoscience and Remote Sensing Symposium, Toronto, ON, Canada, 24–28 June 2002; pp. 2253–2255.
29. Scott, G.; Klaric, M.; Davis, C.; Shyu, C. Entropy-balanced bitmap tree for shape-based object retrieval from large-scale satellite imagery databases. IEEE Trans. Geosci. Remote Sens. 2011, 49, 1603–1616.
30. Yao, H.; Li, B.; Cao, W. Remote sensing imagery retrieval based-on Gabor texture feature classification. In Proceedings of the International Conference on Signal Processing, Montreal, QC, Canada, 17–21 May 2004; pp. 733–736.
31. Tobin, K.W.; Bhaduri, B.L.; Bright, E.A.; Cheriyadat, A.; Karnowski, T.P.; Palathingal, P.J.; Potok, T.E.; Price, J.R. Large-scale geospatial indexing for image-based retrieval and analysis. In Proceedings of the International Symposium on Visual Computing, Lake Tahoe, NV, USA, 5–7 December 2005; pp. 543–552. 32. Xu, S.; Fang, T.; Li, D.; Wang, S. Object classification of aerial images with bag-of-visual words. IEEE Geosci.
Remote Sens. Lett. 2010, 7, 366–370.
33. Chen, L.; Yang, W.; Xu, K.; Xu, T. Evaluation of local features for scene classification using VHR satellite images. In Proceedings of the Joint Urban Remote Sensing Event, Munich, Germany, 10–13 April 2011; pp. 385–388.
34. Yang, Y.; Newsam, S. Geographic image retrieval using local invariant features. IEEE Trans. Geosci. Remote Sens. 2013, 51, 818–832.
35. Ozdemir, B.; Aksoy, S. Image classification using subgraph histogram representation. In Proceedings of the International Conference on Pattern Recognition, Istanbul, Turkey, 23–26 August 2010; pp. 1112–1115. 36. Negrel, R.; Picard, D.; Gosselin, P.H. Evaluation of second-order visual features for land-use classification.
In Proceedings of the International Workshop on Content-Based Multimedia Indexing, Klagenfurt, Austria, 18–20 June 2014.
37. Zhao, L.J.; Tang, P.; Huo, L.Z. Land-use scene classification using a concentric circle-structured multiscale bag-of-visual-words model. IEEE J. Sel. Top. Appl. Earth Obs. Remote Sens. 2014, 7, 4620–4631.
38. Zhang, F.; Du, B.; Zhang, L. Saliency-guided unsupervised feature learning for scene classification. IEEE Trans. Geosci. Remote Sens. 2015, 53, 2175–2184.
39. Zhong, Y.; Zhu, Q.; Zhang, L. Scene classification based on the multifeature fusion probabilistic topic model for high spatial resolution remote sensing imagery. IEEE Trans. Geosci. Remote Sens. 2015, 53, 6207–6222. 40. Gueguen, L. Classifying compound structures in satellite images: A compressed representation for fast
queries. IEEE Trans. Geosci. Remote Sens. 2015, 53, 1803–1818.
41. Fan, J.; Tan, H.L.; Lu, S. Multipath sparse coding for scene classification in very high resolution satellite imagery. SPIE Remote Sens. 2015, 9643, 96430S.
42. Song, Q.; Huang, R.; Wang, K. Remote sensing image retrieval based on attribute profiles. In Proceedings of the International Conference on Computer Science and Mechanical Automation, Hangzhou, China, 23–25 October 2015; pp. 231–234.
43. Zhou, W.; Shao, Z.; Diao, C.; Cheng, Q. High-resolution remote-sensing imagery retrieval using sparse features by auto-encoder. Remote Sens. Lett. 2015, 6, 775–783.
44. Napoletano, P. Visual descriptors for content-based retrieval of remote sensing images. arXiv 2016, arXiv:1602.00970.
45. Wang, Y.; Zhang, L.; Tong, X.; Zhang, L.; Zhang, Z.; Liu, H.; Xing, X.; Mathiopoulos, P.T. A three-layered graph-based learning approach for remote sensing image retrieval. IEEE Trans. Geosci. Remote Sens. 2016, 54, 6020–6034.
46. Demir, B.; Bruzzone, L. A novel active learning method in relevance feedback for content based remote sensing image retrieval. IEEE Trans. Geosci. Remote Sens. 2015, 53, 2323–2334.
47. Urbach, E.R.; Roerdink, J.B.T.M.; Wilkinson, M.H.F. Connected shape-size pattern spectra for rotation and scale-invariant classification of gray-scale images. IEEE Trans. Pattern Anal. Mach. Intell. 2007, 29, 272–285. 48. Silverman, B.W. Density Estimation for Statistics and Data Analysis; CRC Press: Boca Raton, FL, USA, 1986. 49. Breen, E.J.; Jones, R. Attribute openings, thinnings, and granulometries. Comput. Vis. Image Underst. 1996,
50. Urbach, E.R.; Wilkinson, M.H.F. Shape-only granulometries and grey-scale shape filters. In Proceedings of the International Symposium on Mathematical Morphology, Sydney, Australia, 3–5 April 2002; pp. 305–314. 51. Salembier, P.; Oliveras, A.; Garrido, L. Antiextensive connected operators for image and sequence processing.
IEEE Trans. Image Process. 1998, 7, 555–570.
52. Jones, R. Component trees for image filtering and segmentation. In Proceedings of the IEEE Workshop on Nonlinear Signal and Image Processing, Mackinac Island, MI, USA, 8–10 September 1997.
53. Hu, M.K. Visual pattern recognition by moment invariants. IRE Trans. Inf. Theory 1962, 8, 179–187. 54. Westenberg, M.A.; Roerdink, J.B.T.M.; Wilkinson, M.H.F. Volumetric attribute filtering and interactive
visualization using the Max-Tree representation. IEEE Trans. Image Process. 2007, 16, 2943–2952.
55. Lantuéjoul, C.; Maisonneuve, F. Geodesic methods in quantitative image analysis. Pattern Recognit. 1984, 17, 177–187.
56. Morard, V.; Decenciere, E.; Dokládal, P. Efficient geodesic attribute thinnings based on the barycentric diameter. J. Math. Imaging Vis. 2013, 46, 128–142.
57. Salembier, P.; Wilkinson, M.H.F. Connected operators. IEEE Signal Process. Mag. 2009, 26, 136–157. 58. Soille, P. On genuine connectivity relations based on logical predicates. In Proceedings of the International
Conference on Image Analysis and Processing, Modena, Italy, 10–14 September 2007; pp. 487–492. 59. Lefèvre, S. Beyond morphological size distribution. J. Electron. Imaging 2009, 18, 013010.
60. Manjunath, B.S.; Ohm, J.R.; Vasudevan, V.V.; Yamada, A. Color and texture descriptors. IEEE Trans. Circuits Syst. Video Technol. 2001, 11, 703–715.
61. Manning, C.D.; Raghavan, P.; Schütze, H. Introduction to Information Retrieval; Cambridge University Press: Cambridge, UK, 2008.
62. Russakovsky, O.; Deng, J.; Su, H.; Krause, J.; Satheesh, S.; Ma, S.; Huang, Z.; Karpathy, A.; Khosla, A.; Bernstein, M.; et al. ImageNet large scale visual recognition challenge. Int. J. Comput. Vis. 2015, 115, 1–42.
© 2016 by the authors; licensee MDPI, Basel, Switzerland. This article is an open access article distributed under the terms and conditions of the Creative Commons Attribution (CC-BY) license (http://creativecommons.org/licenses/by/4.0/).