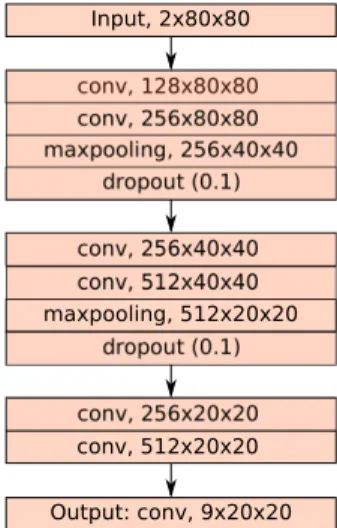
Ship identification and characterization in Sentinel-1 SAR images with multi-task deep learning
Texte intégral
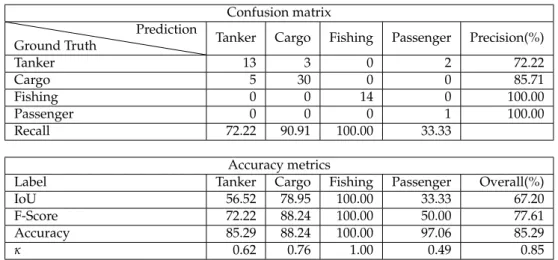
Figure


Documents relatifs
Similarly, ( Stab and Gurevych , 2017 ) used a CRF to extract argu- ment components in essays. , 2017 ) leveraged deep learning techniques to extract ar- guments from raw
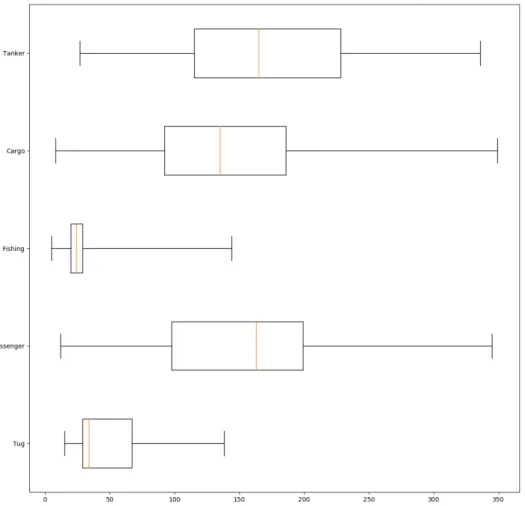
In this section, we study the simultaneous detection of user environment (Indoor, Outdoor) and mobility state (Low, Medium, High) using a deep learning approach.. Why Multi-Task
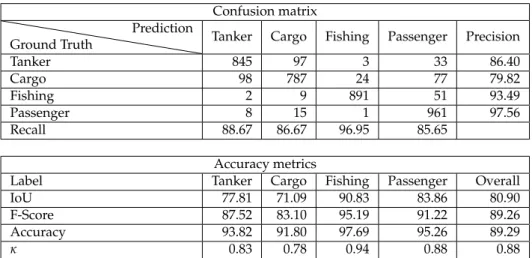
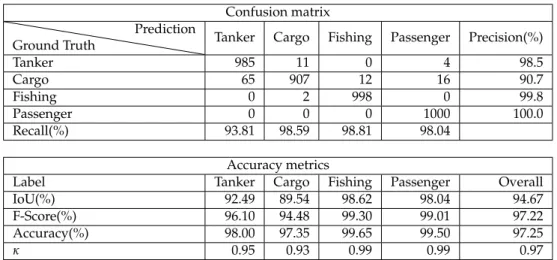
The results of our experiment show that the method can be applied for ships identification by combining CDBN, spectrum and softmax functions, the classi- fication recognition
1: An RGB composition SAR image over the Mont Blanc chain (one of the 23 French alpine massifs of the database) using 3 sentinel-1 VH images (R: 2017/08/24, G: 2018/01/15,
For the time being, we applied the MTCD method to the high resolution satellites that can produce time series with constant viewing angles (LANDSAT and FORMOSAT-2), but
Note that this definition can also bring new insights regarding the ecology and evolution of infectious diseases, because although the importance of G £ G £ E interactions (that is,
The reason for the effect of the phylogeny on regressions involving dsCD4 is that when the PCA is used to study trait correlations, the correction applied to the phylogeny (i.e.
A comparison with other already previously benchmarked algorithms for expensive numerical black-box op- timization with the default setting of MATSuMoTo highlights the strengths
