HAL Id: hal-01503357
https://hal.archives-ouvertes.fr/hal-01503357
Submitted on 7 Apr 2017HAL is a multi-disciplinary open access
archive for the deposit and dissemination of sci-entific research documents, whether they are pub-lished or not. The documents may come from teaching and research institutions in France or abroad, or from public or private research centers.
L’archive ouverte pluridisciplinaire HAL, est destinée au dépôt et à la diffusion de documents scientifiques de niveau recherche, publiés ou non, émanant des établissements d’enseignement et de recherche français ou étrangers, des laboratoires publics ou privés.
Evolution of elastic shear modulus in granular materials
along isotropic and deviatoric stress paths
Christophe Dano, Pierre-Yves Hicher
To cite this version:
Christophe Dano, Pierre-Yves Hicher. Evolution of elastic shear modulus in granular materials along isotropic and deviatoric stress paths. 15th ASCE Engineering Mechanics Conference, Columbia Uni-versity, Jun 2002, New York, NY, United States. �hal-01503357�
EVOLUTION OF ELASTIC SHEAR MODULUS IN GRANULAR MATERIALS
ALONG ISOTROPIC AND DEVIATORIC STRESS PATHS
Christophe Dano1
and Pierre-Yves Hicher2 ABSTRACT
The effect of the mean effective stress on the elastic properties of unbound granular materials is a well-known experimental result. Power laws between the mean effective stress and the shear modulus Gvhmax
of three natural sands are established for isotropic stress paths using bender elements. Triaxial test results reveal that such power laws are also suitable for contracting deviatoric stress paths whereas it is no longer the case for dilating deviatoric stress paths. Fabric changes during shearing are therefore highlighted. These observations seem to be a typical feature of the behavior of granular materials.
Keywords: small strains, shear modulus, granular materials
INTRODUCTION
The “bender elements” technique has known an ongoing progress in the last two decades. It is now frequently associated with the triaxial apparatus in order to determine the elastic properties of soils such as sands, gravels, clays, etc. For instance, many theoretical works (Bates, 1989; Viggiani & Atkinson, 1995; Brignoli et al., 1996; Jovicic et al., 1996; Arulnathan et al., 1998; Blewett et al., 2000) have led to a more accurate measurement of the velocity of the shear waves generated by these piezoelectric transducers. A large quantity of experimental results was also published in the literature. This additional contribution demonstrates a typical evolution of the shear modulus for various granular materials along both isotropic and deviatoric stress paths.
MATERIALS
Three granular materials were used in this experimental study: •= A fine and siliceous sand named Fontainebleau Sand NE34;
•= A first class of natural alluvial deposits of the Seine River (France) noted AD1; •= A second class of coarser alluvial deposits of the Seine River noted AD2.
1 Civil Engineering Laboratory of Nantes Saint-Nazaire, Ecole Centrale Nantes, 44321 NANTES. E-mail:
2 Civil Engineering Laboratory of Nantes Saint-Nazaire, Ecole Centrale Nantes, 44321 NANTES. E-mail:
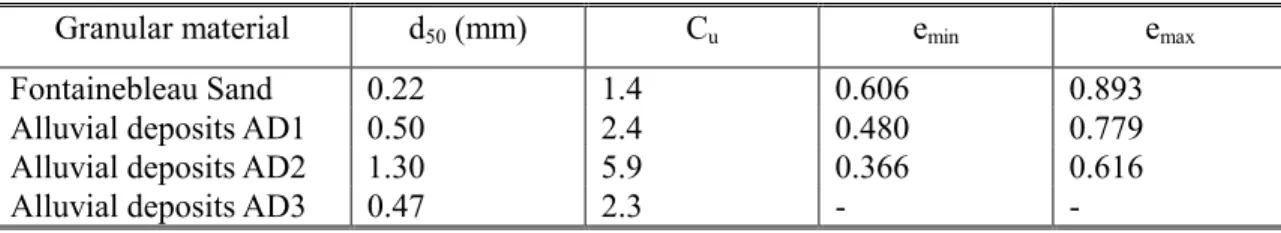
The basic properties of the soils (mean grain size d50, Hazen’s ratio Cu = d60/d10, minimal and
maximal void ratio emin and emax) are given in Table 1. The maximal grain size dmax of alluvial
deposits AD1 was also reduced to 3.15 mm (material noted AD3) in order to examine the effect of decreasing the maximal grain size on the stiffness properties of granular materials.
TABLE 1. Properties of the granular materials
Granular material d50 (mm) Cu emin emax
Fontainebleau Sand 0.22 1.4 0.606 0.893
Alluvial deposits AD1 0.50 2.4 0.480 0.779 Alluvial deposits AD2 1.30 5.9 0.366 0.616
Alluvial deposits AD3 0.47 2.3 - -
EXPERIMENTAL SET-UP
Consolidated drained triaxial tests were carried out in the laboratory. Cylindrical specimens were 100 mm in diameter and 200 mm in height. Dense samples of Fontainebleau Sand were reconstituted through air pluviation. Dense alluvial deposits were deposited in five layers and were compacted by tamping. Tests were performed on dry samples of alluvial deposits and on fully saturated samples of Fontainebleau Sand. The saturation process comprised three stages: gaseous carbon dioxide percolation, deaired water percolation and application of back pressures up to 350 kN/m2 which guaranteed B-values of at least 0.95.
Volumetric strains were measured either in a burette or through the volume changes of the cell water recorded on a pressure/volume controller which applied the confining pressure σ’3. Axial
strains were determined from an external displacement transducer. As stated by Scholey et al. (1995), such a measurement overestimates the true axial displacements (measured by local transducers located on soil specimens for instance) because of bedding errors and system compliance. The error made on the axial displacements involves an error, although low, on the relative position of the bender elements during the test and therefore on the absolute value of the shear modulus but has no effect on its general evolution.
The preparation procedure was not changed by the pair of bender elements embedded in the lower and upper pedestals of the triaxial cell. These bender elements, which are piezoelectric transducers, provide a non destructive and punctual measure of the shear modulus. Application of a square impulse is converted into tangential vibrations of the transmitter, which cause a shear wave to be propagated through the sample. This phenomenon is reversible, and then a mechanical force on the receiver produces an electric field. The input and output electric signals were recorded on an oscilloscope on which the propagation time Tw of the shear wave could be determined, according
to the instructions by Viggiani & Atkinson (1995) and Jovicic et al. (1996). The distance of propagation Lw is the length between the tips of the bender elements. The velocity of the shear
wave is therefore:
w w
w L T
V = (1)
Owing to the direction and the polarization of the shear wave, only the component Gvhmax of the
small strain stiffness matrix can be identified, assuming a linear cross-anisotropic elastic behavior (Kuwano et al., 1999). The shear modulus is related to the unit mass ρ of the material and to the shear wave velocity Vw:
[
]
2 w w 2 w max vh V L T G =ρ× =ρ× (2)EVOLUTION OF THE SHEAR MODULUS ALONG ISOTROPIC STRESS PATHS
A critical review of the literature shows that the shear modulus of unbound granular materials mainly depends on the void ratio e and on the effective principal stresses σ’1 and σ’3. However,
during triaxial tests, the minor principal stress σ’3 is kept constant. Therefore, the shear modulus
Gvhmax is expressed as a function of the void ratio and of the mean effective stress p’ such as (Hardin
& Richart, 1963; Iwasaki & Tatsuoka, 1977; Hicher, 1996; Lo Presti et al., 1997):
(
2)
( )
n(
2)
max vh f e p' kN/m K m / MN G = × (3)where K and n are material constants and f(e) a function of the void ratio (Table 2). The values of the two parameters K and n proposed by the authors previously mentioned are clarified in Table 2. Fig. 1 represents a non-exhaustive compilation of experimental data relative to sands and gravels found in the literature: all the references can be found in Dano (2001). The correlation by Biarez & Hicher (1994) constitutes a good approximation for many experimental data (Fig. 1).
TABLE 2. Relations between Gmax, e and p’
Reference K n f(e) Comments
Hardin & Richart (1963) 6.93 0.5 Rounded grains Iwasaki & Tatsuoka (1977) 14.10 0.4
(
2.17 e) (
1 e)
2 +
− C
u < 1.8
Biarez & Hicher (1994) 5.69 0.5 1e All soils Lo Presti et al. (1997) 9.25 0.45 1 e1.3 Sands
0 5 10 15 20 25 30 35 0.2 0.4 0.6 0.8 1 1.2 G ma x (M N /m 2 ) / p' 0,5 (kN /m 2 ) Void ratio e Biarez & Hicher (1994)
Hardin & Richart (1963) Experimental data = symbols
The case of triaxial tests on fully saturated Fontainebleau Sand is presented in Fig. 2. The loading program was composed of:
•= A first isotropic compression from 100 to 500 kN/m2 (Path 1);
•= An isotropic unloading from 500 to 100 kN/m2 (Path 2);
•= A second isotropic compression from 100 to 400 kN/m2 (Path 3);
•= A shearing loading up to a strain slightly larger than the one corresponding to the maximal shear resistance (Path 4);
•= An unloading step down to an isotropic stress state (Path 5); •= A final isotropic unloading from 400 to 100 kN/m2 (Path 6).
-400 0 400 800 1200 0 200 400 600 800 D ev iat or q ( M N /m 2 )
Mean Effective stress p' ( kN/m2 )
Paths 1,2 Path 3 Path 6 Path 4 Path 5 Fig. 2a 40 60 80 100 120 140 160 100 150 200 250 300 350 400 450 500 G vh ma x x e ( M N /m 2 )
Mean effective stress p' ( kN/m2 )
Gvhmax x e = 4,38 x p' 0.56
Gvhmax x e = 5,84 x p' 0,49
Paths 1,2,3
Path 6 Biarez & Hicher
(1994)
Fig. 2b
FIG. 2. Evolution of Gvhmax along isotropic stress paths
In this section, only the isotropic stress paths (1,2,3,6) are considered. Two distinct power laws, which give evidence of the fabric change due to shearing, fit the experimental values of the shear modulus Gvhmax:
for stress paths 1, 2 and 3 0.56 max vh p' e 38 . 4 G = × (4)
for stress path 6 0.49
max vh e p' 84 . 5 G = × (5)
Similar patterns were obtained for tests on alluvial deposits. The values of the parameters K and n of the relation (3) are indicated in Table 3. e0 is the void ratio for a confining pressure equal to 100
kN/m2. The power n, which characterizes the quantity of grain-to-grain contacts, was close to 0.5. The deviation from the predictions of the Hertz’s theory (n = 1/3) can be explained by the nature of the contacts, not necessarily punctual.
EVOLUTION OF THE SHEAR MODULUS ALONG DEVIATORIC STRESS PATHS
The shearing phase induced an obvious fabric change. In particular, the values of the shear modulus were systematically lower after shearing than before for the same isotropic stress state. Whatever the maximal axial strain might be, the reduction of Gvhmax was located between 15 and
25%.
TABLE 3. Experimental values of K and n
Granular material e0 First isotropic loading Isotropic unloading after shearing
K n K n
Fontainebleau Sand 0.598 4.38 0.56 5.84 0.49 Alluvial deposits AD1 0.480 6.98 0.48 2.76 0.62 Alluvial deposits AD2 0.399 5.65 0.51 6.02 0.46 Alluvial deposits AD3 0.490 5.57 0.50 3.72 0.56
Few publications tackle the problem relative to the evolution of the shear modulus over a large domain of strains. By performing tests on Hime gravel samples (d50≈ 2 mm), Shibuya et al. (1992)
experimentally found a non-monotonic evolution of the elastic modulus determined on small unloading/reloading loops using local measurements of the axial strains. They first noted that the power laws, usually accepted in the geotechnical community, were suitable only on a restricted stress domain, without bringing any precision as for the size of this domain.
Kuwano et al. (1999) performed tests on Ham River Sand (d50 = 0.27 mm) using
multi-directional bender element transducers. Their experiments showed a decrease of the shear modulus Gvhmax which coincides with the onset of dilation at the characteristic state as defined by
Luong (1980). It means that the evolution of the shear modulus is mainly controlled by the volumetric behavior. However, the variations of the void ratio can not by themselves explain this particular feature which has consequently to be related to the fabric change.
Fig. 3 represents the evolution of the shear modulus Gvhmax corrected by the void ratio e as a
function of the axial strain ε1 in the case of a dense Fontainebleau Sand (Fig. 3a) and in the case of
three triaxial tests on dense alluvial deposits AD3 (Fig. 3b). Fig. 3 reveals a slight decrease of the shear moduli almost simultaneously to the crossing of the characteristic state whereas, in the contracting domain, the evolution of the shear modulus still follows the power laws deduced from the isotropic stress paths. Similar trends were observed for alluvial deposits AD1 and AD2.
ADDITIONAL TESTS
Additional tests were carried out in order to confirm these experimental observations: •= Triaxial test on loose alluvial deposits AD3 (e0 = 0.641 ; σ’3 = 200 kN/m2) (Fig. 4);
•= Test at a constant mean effective stress p’ = 200 kN/m2 (e
0 = 0.461) (Fig. 5).
Triaxial test on loose alluvial deposits
Loose alluvial deposits AD3 were first isotropically consolidated up to a mean effective stress p’ equal to 200 kN/m2. The power law was then:
49 . 0 max vh e p' 60 . 6 G = × (6)
Fig. 4 represents the evolution of the shear modulus (multiplied by the void ratio e) during shearing. As expected, the values increased according to the power law (6) until the volumetric strain rate became equal to zero. The shear modulus then remained almost constant for a small dilation rate. Also note that the shear modulus after unloading was very close to its initial value whereas previous tests carried out at larger strains in the dilating domain had shown a decrease of about 15 to 25 % of the stiffness.
100 120 140 160 180 200 0 2 4 6 8 10 0 0.01 0.02 0.03 0.04 0.05 0.06 G vh ma x x e ( M N /m 2 ) (G vh ma x x e ) / p ' 0,56 Axial strain ε1 Experiment
Data corrected of the effect of the mean effective stress
Path 4 Fig. 3a 0 50 100 150 200 0 200 400 600 800 1000 G vh ma x x e ( M N /m 2 )
Mean effective stress p' ( kN/m2 )
σ'3 = 400 kN/m2
σ'3 = 200 kN/m2
σ'3 = 100 kN/m2
Arrows indicate characteristic states
Gvhmax x e = 5.57 x p' 0.50
Fig. 3b
FIG. 3. Evolution of Gvhmax along deviatoric stress paths for dense materials
0 100 200 300 400 500 600 0 0.01 0.02 0.03 0.04 0.05 0.06 0.07 D ev iat or q ( k N /m 2 ) Axial strain ε1 Gvhmax x e ( MN/m2 ) 96,2 117,1 125,7 134,0132,6 129,4 132,8 130,7 97,6 Fig. 4a -0.012 -0.01 -0.008 -0.006 -0.004 -0.002 0 0 0.01 0.02 0.03 0.04 0.05 0.06 0.07 Axial strain ε1 Gvhmax x e ( MN/m2 ) 96,2 117,1 125,7 134,0 132,6 129,4 132,8 130,7 97,6 Volumet ric st rain εv Fig. 4b
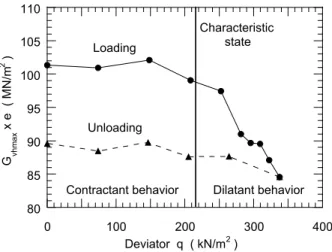
Test on alluvial deposits at a constant p’ = 200 kN/m2
In the previous tests, the effect of the shear stress was found to be negligible over a large domain of strains. In order to examine this effect, a triaxial test at a constant mean effective stress p’ = 200 kN/m2 was carried out on alluvial deposits AD3 (e
0 = 0.461). The equipment used in the
laboratory did not allow a stress servo control. The test was therefore performed by gradually decreasing the minor stress σ’3 and by increasing the major stress σ’1. Fig. 5 shows that the value of
the shear modulus was constant in the contracting domain. Once the characteristic state was reached, the shear modulus gradually decreased while increasing the deviatoric strain.
80 85 90 95 100 105 110 0 100 200 300 400 G vh ma x x e ( M N/m 2 ) Deviator q ( kN/m2 ) Characteristic state Loading Unloading
Contractant behavior Dilatant behavior
FIG. 5. Evolution of Gvhmax for a test at a constant p’ = 200 kN/m2 CONCLUSIONS
Triaxial tests were carried out on three unbound granular materials and the shear modulus was continuously measured using piezoelectric transducers. This experimental study shows that the power laws, usually considered to describe the effect of the mean effective stress on the shear modulus, are suitable only along isotropic stress paths and along deviatoric stress paths as long as the volumetric behavior is contracting. Indeed, when dilation appears, the shear modulus Gvhmax
gradually decreases during shearing. Further developments will use compression wave transmitter/receiver transducers associated to the bender elements. Numerical simulations using discrete element methods would have to be included to these developments in order to better understand the experimental observations described in this paper.
ACKNOWLEDGMENTS
The authors would like to acknowledge the companies RATP and INTRAFOR (France) for their financial support.
REFERENCES
Arulnathan, R., R.W. Boulanger, and M.F. Riemer (1998), “Analysis of bender element tests”, Geotechnical Testing Journal, 21(2), 120-131.
39(4), 721-726.
Biarez, J. and P.-Y. Hicher (1994), Elementary mechanics of soil behaviour – saturated and remoulded soils, Balkema.
Blewett, J., I.J. Blewett, and P.K. Woodward (2000), “Phase and amplitude responses associated with the measurement of shear-wave velocity in sand by bender element”, Canadian Geotechnical Journal, 37, 1348-1357.
Brignoli, E.G.M., M. Gotti, and K.H. Stokoe (1996), “Measurement of shear waves in laboratory specimens by means of piezoelectric transducers”, Geotechnical Testing Journal, 19(4), 384–397.
Dano, C. (2001), “Comportement mécanique des sols injectés”, PhD. Thesis, Ecole Centrale of Nantes and University of Nantes (in French).
Dyvik, R. and C. Madhus (1986), “Lab measurements of Gmax using bender elements”, Publication
161 of the Norwegian Geotechnical Institute, 1-7.
Hardin, B.O. and F.E. Richart (1963), “Elastic wave velocities in granular soils”, Journal of the Geotechnical Engineering Division, ASCE, 89(1), 33-65.
Iwasaki, T. and F. Tatsuoka (1977), “Effects of grain size and grading on dynamic shear moduli of sands”, Soils and Foundations, 17(3), 19-35.
Jovicic, V., M.R. Coop, and M. Simic (1996), “Objective criteria for determining Gmax from bender
element tests”, Geotechnique, 46(2), 357-362.
Kuwano, R., T.M. Connoly, and J. Kuwano (1999), “Shear stiffness anisotropy measured by multi-directional bender element transducers”, Proceedings of the 2nd International Symposium
on Pre-failure deformation characteristics of geomaterials, Torino, Italy, 1999, 205-212. Lo Presti, D.C.F., M. Jamiolkowski, O. Pallara, A. Cavallararo, and S. Pedroni (1997), “Shear
modulus and damping of soils”, Geotechnique, 47(3), 603–617.
Luong, M.P. (1980), “Phénomènes cycliques dans les sols pulvérulents”, Revue Française de Géotechnique, 10, 39-53 (in French).
Scholey, G.K., J.D. Frost, D.C.F. Lo Presti, and M. Jamiolkowski (1995), “A review of instrumentation for measuring small strains during triaxial testing of soil specimens”, Geotechnical Testing Journal, 18(2), 137–156.
Shibuya, S., F. Tatsuoka, S. Teachavorasinskun, X.J. Kong, F. Abe, Y.S. Kim, and C.S. Park (1992), “Elastic deformation properties of geomaterials”, Soils and Foundations, 32(3), 26-46.
Viggiani, G. and J.H. Atkinson (1995), “Interpretation of bender element tests”, Geotechnique,