HAL Id: dumas-02863724
https://dumas.ccsd.cnrs.fr/dumas-02863724
Submitted on 10 Jun 2020
HAL is a multi-disciplinary open access
archive for the deposit and dissemination of sci-entific research documents, whether they are pub-lished or not. The documents may come from teaching and research institutions in France or abroad, or from public or private research centers.
L’archive ouverte pluridisciplinaire HAL, est destinée au dépôt et à la diffusion de documents scientifiques de niveau recherche, publiés ou non, émanant des établissements d’enseignement et de recherche français ou étrangers, des laboratoires publics ou privés.
Perturbations rénales chez le patient traumatisé
crânien : approche physiopathologique
Alexandre Lannou
To cite this version:
Alexandre Lannou. Perturbations rénales chez le patient traumatisé crânien : approche
1 Université de Bordeaux
U.F.R DES SCIENCES MÉDICALES
Année 2020 Thèse n°3025
THÈSE
Pour l’obtention du
DIPLÔME d’ÉTAT DE DOCTEUR EN MÉDECINE
Spécialité Anesthésie-Réanimation Présentée et soutenue publiquement
Le Vendredi 15 Mai 2020 Par Alexandre LANNOU
Né le 31 Mai 1990 à Chambray-Lès-Tours (37)
Perturbations rénales chez le patient traumatisé crânien :
Approche physiopathologique
Directeur de thèse
Monsieur le Docteur Cédric CARRIE Rapporteur de thèse
Monsieur le Professeur Matthieu BIAIS
Membres du jury
Madame le Professeur Karine NOUETTE-GAULAIN Présidente
Monsieur le Professeur Matthieu BIAIS Rapporteur
Monsieur le Professeur Christian COMBE Juge
Madame le Docteur Cécile DEGRYSE Juge
Monsieur le Docteur Laurent PETIT Juge
2
TABLE DES MATIÈRES
Perturbations rénales chez le patient traumatisé crânien………..P.5 1. Hyperclairance rénale………...P.5 2. Hyponatrémie et syndrome de perte de sel………..P.8 3. Problématiques et objectifs du travail………P.12 Augmented renal clearance in critically ill trauma patients: a pathophysiologic approach using renal vascular index………..P.15 Salt wasting syndrome in the brain-damaged patients: a pathophysiologic approach using sodium balance and urinary biochemical analysis….………...P.43 Discussion………..……P.63 1. Perturbation de la vasomotricité artériolaire rénale et augmentation de la filtration glomérulaire………..P.63 2. Variations de la balance sodée et syndrome de perte en sel………..P.64 3. Mécanismes explicatifs de la fuite sodée………..P.65 4. Limites des études et perspectives futures………..P.66 Conclusion……….P.68
3
LISTE DES ABBRÉVIATIONS
ACSOS = Agressions cérébrales secondaires d’Origine Systémique ACR = Augmentation de la Clairance Rénale
AKI = Acute Kidney Injury
ANP = Atrial Natriuretic Peptide (Peptide Natriurétique Atrial) BNP = Brain Natriuretic Peptide
CLCR = Clairance de la créatinine
CLPAH = Clairance de l’acide p-aminohippurique
CSW = Cerebral Salt Wasting
DFG = Débit de Filtration Glomérulaire DSR = Débit Sanguin Rénal
FEUrate = Fraction Excrétée d’Urate FF = Fraction de Filtration
IL-6 = Inter-Leukine 6
IRM = Imagerie par Résonnance Magnétique MCP-1 = Monocyt Chemoattractant Protein NGAL = Neutrophil Gelatinase-Associated Lipocalin NO = Monoxyde d’azote
PIC = Pression Intracrânienne RBP = Retinol Binding Protein RFR = Réserve Fonctionnelle Rénale
SDRA = Syndrome de Détresse Respiratoire Aigüe
SIADH = Syndrome de Sécrétion Inappropriée d’Hormone Anti-Diurétique SPS = Syndrome de Perte de Sel
SRIS = Syndrome de Réponse Inflammatoire Systémique VEC = Volume Extra-Cellulaire
5
PERTURBATIONS RÉNALES CHEZ LE PATIENT TRAUMATISÉ CRÂNIEN
En Europe, le traumatisme crânien représente environ 260 cas /100 000 habitants/an (1). Celui-ci représente un enjeu sociétal majeur car il conduit à 15% de mortalité et 50 à 60% de handicap (2). Les patients cérébrolésés pris en charge en réanimation présentent fréquemment des perturbations de la fonction rénale, notamment une augmentation de la clairance rénale (ACR) ou un syndrome de perte en sel (SPS). Ces deux syndromes peuvent avoir des conséquences délétères sur le pronostic du patient. Cependant, la physiopathologie expliquant de telles perturbations reste peu explorée et méconnue.
1. Augmentation de la clairance rénale
L’augmentation de la clairance rénale (ACR) correspond à un état supra-physiologique du débit de filtration glomérulaire (DFG), définie par une clairance de la créatinine supérieure à 130 ml/min/1,73m2(3).
Admise par consensus, cette définition se base sur la limite supérieure du DFG normal variable en fonction du sexe, de l’ethnie et de la surface corporelle, estimée entre 120 et 130 ml/min/1,73m2 (4). Chez le patient
traumatisé crânien, l’ACR a également été définie par un DFG supérieur à 150ml/min/1,73m2 chez la femme et
supérieur à 160ml/min/1,73m2 chez l’homme (5). Udy Anest Analg 2010
Des études observationnelles récentes montrent une grande variabilité d’incidence de l’ARC en réanimation polyvalente allant de 20 à 65% (6)(7). Celle-ci varie en fonction du motif d’admission ; les populations les plus à risque sont les patients polytraumatisés, les brûlés, les parturientes, les patients en post-opératoire d’une chirurgie majeure et dans certains cas le sepsis (8)(9)(10). En outre, l’incidence paraît encore plus importante chez les patients cérébrolésés, de 65 à 85% (11). Une incidence de 100% a même été décrite dans une population de 20 hémorragies sous arachnoïdiennes avec des clairances moyennes de 325ml/min/1,73m2 (12).
6 L’ACR conduit à une augmentation de l’élimination des substances hydrophiles à élimination rénale, pouvant engendrer une diminution de leurs concentrations plasmatiques (12). Cette modification de la fonction rénale a été reconnue comme l’un des principaux facteurs de risque de sous dosage en β-lactamine (4)(13)(6). Dans ce contexte, une étude réalisée en réanimation chirurgicale retrouvait une association significative entre ARC, sous dosage en β-lactamine et échec thérapeutique (14). Dans une autre étude rétrospective utilisant le même protocole d’antibiothérapie, l’ACR était associé à un risque accru de récidive de PAVM (OR = 4,4 [1,2-1,6] ; p = 0,03). Ces échecs de traitement n’ont pas à ce jour d’effet démontré sur la mortalité (15).
A ce jour, les mécanismes physiopathologiques à l’origine de ce phénomène ne sont pas complètement élucidés. A notre connaissance, une seule étude s’est intéressée à la physiopathologie de l’ACR à l’aide de biomarqueurs rénaux chez 20 patients à risque (16). Les résultats de cette étude suggèrent :
- Une association significative entre clairance de la créatinine (CLCR) et clairance de la sinistrine,
confirmant l’augmentation du DFG chez les patients en ACR (Fig 1.A).
- Une association significative entre CLCR et clairance de l’acide p-aminohippurique (CLPAH), suggérant
une augmentation du débit sanguin rénal (DSR) chez les patients en ACR (Fig. 1.B).
- D’importantes variations de la fraction de filtration pour une même valeur de CLPAH, soulevant
l’hypothèse d’une inhibition de la vasomotricité artériolaire rénale pour expliquer les changements de pression intra-glomérulaire (Fig 1.D)
- Cette étude retrouve en outre, une augmentation significative de la sécrétion tubulaire d’anions, bien que les mécanismes physiopathologiques de cette dysfonction tubulaire ne soient pas expliqués.
7
Figure 1. Exploration des mécanismes physiopathologiques à l’origine de l’ACR d’après Udy (16)
Les facteurs déclenchants restent à ce jour méconnus, bien que le rôle du syndrome inflammatoire systémique, des facteurs natriurétiques et de la réserve fonctionnelle rénale aient été évoqués.
- Le syndrome de réponse inflammatoire systémique (SRIS) est l’une des causes les plus fréquemment évoquées. Il pourrait être à l’origine d’une vasodilatation artériolaire et d’une augmentation du débit cardiaque (17)(18)(52).
- Certains auteurs ont également suggéré que l’augmentation des taux d’ANP pourrait participer à l’augmentation du DFG chez le traumatisé crânien, bien qu’une étude récente n’ait pas permis de retrouver de corrélation en CLCr et taux d’ANP plasmatique (19)
- Enfin, l’ACR est retrouvé dans certaines situations physiologiques comme la grossesse ou l’obésité. Un sujet sain ne solliciterait que 30 à 50% de ses capacités fonctionnelles rénales. La différence entre le DFG max et le DFG basal représente la réserve fonctionnelle rénale, cette RFR apparaît alors comme la capacité du rein à s’adapter afin de maintenir l’homéostasie (20)(21)
Au total, l’ACR est une entité fréquente chez le traumatisé crânien, potentiellement responsable de sous-dosage en antibiotiques à élimination urinaire, entrainant un risque d’échec accru. Malgré cette forte incidence, la physiopathologie de l’hyperclairance rénale est mal connue. L’hypothèse d’une inhibition de la vasomotricité artériolaire, bien que probable, reste à confirmer.
8
2. Hyponatrémie et « syndrome de perte de sel »
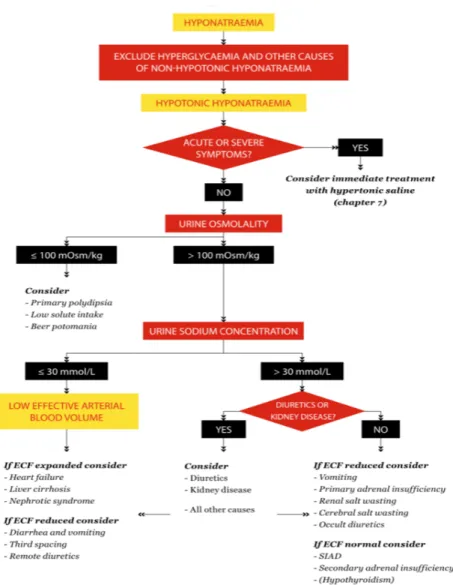
L’hyponatrémie est fréquente chez les patients cérébrolésés et son incidence varie entre 10 et 50 % (22-25). Elle constitue l’une des agressions cérébrales secondaires d’origine systémique (ACSOS) et pourrait avoir des conséquences délétères sur le pronostic (25-27). Chez les patients traumatisés crâniens, les étiologies principales des hyponatrémies sont la iatrogénie (mannitol, desmopressine …), le syndrome de perte de sel (SPS) et le syndrome de Sécrétion Inappropriée d’Hormone Antidiurétique (SIADH) (23) (Figure 2).
Figure 2. Algorithme proposé par les recommandations européennes de 2014 pour le diagnostic étiologique d’une hyponatrémie (28)
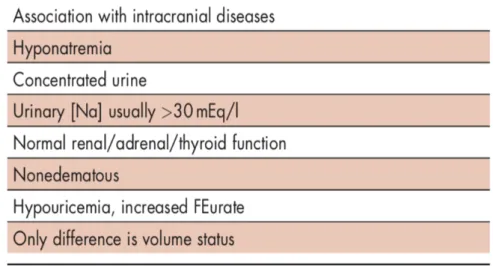
9 Historiquement, le diagnostic de SPS a été soumis à de nombreuses controverses concernant son existence et sa prévalence, car possédant de critères diagnostiques non spécifiques, souvent communs avec le SIADH (29,30). Le diagnostic différentiel entre le SPS et le SIADH réside dans l’appréciation difficile du volume extracellulaire (Tableau 1). Le SPS se présente classiquement comme une perte rénale de sodium non expliquée par une pathologie endocrinienne, responsable d’une hyponatrémie hypo-osmolaire à volume extracellulaire diminué (31,32). L’incidence du SPS est variable entre 0,8% à 34,6% selon la définition utilisée (33).
Tableau 1. Diagnostic différentiel entre SIADH et SPS d’après Maesaka et coll. (31)
La détermination du volume extracellulaire est donc d’une importance capitale mais son évaluation est reconnue comme inexacte selon les critères cliniques habituels (34). En utilisant des radio-isotopes, Audibert et coll. ont retrouvé une réduction significative du volume extracellulaire chez les patients atteints d’hémorragie sous-arachnoïdienne. La baisse du volume extracellulaire due à une perte rénale en sel pourrait être le mécanisme à l’origine d’une sécrétion en ADH malgré une baisse de l’osmolalité plasmatique (31) (35).
10
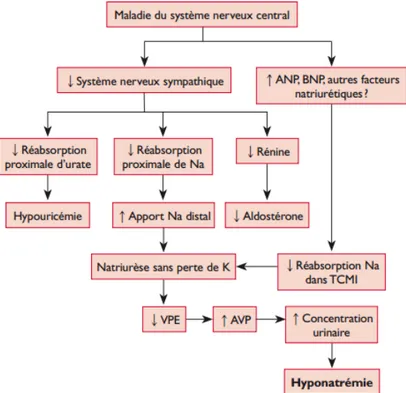
La physiopathologie du SPS demeure aujourd’hui encore hypothétique. Les deux mécanismes habituellement retenus et responsables de la perte rénale de sodium sont, d’une part, l’activation inappropriée du système des peptides natriurétiques et, d’autre part, la diminution de la stimulation sympathique rénale (Figure 3) (29) (36). Cette théorie reste cependant très controversée, d’autres mécanismes également évoqués dans la littérature impliqueraient une natriurèse de pression (via une hyperadrénergie ou l’administration de catécholamines) (35) et un hypoaldostéronisme secondaire (34). Certains auteurs ont également défini le SPS par la persistance d’une Fraction excrétée d’urate > 11% après correction de l’hyponatrémie, évoquant la possibilité d’un trouble de la réabsorption tubulaire proximale comme origine possible à cette perturbation (31).
Figure 3. Physiopathologie du syndrome de perte en sel d’origine cérébrale, d’après Deslarzes et coll. [29]
ANP: atrial natriuretic peptide; AVP: arginine vasopressine; BNP: brain natriuretic peptide; K: pot@assium; Na: sodium; TCMI: tubule collecteur
11 Le diagnostic étiologique d’une hyponatrémie est indispensable pour guider la prise en charge thérapeutique :
- Le SPS nécessite la correction de la volémie et la perfusion de soluté hypertoniques. En effet, la perfusion de solutés hypo- ou isotoniques (dont l'osmolarité est inférieure à celle de l'urine) entraîne une rétention d'eau libre via la sécrétion d’ADH et favorise l’hyponatrémie(28). Ce phénomène est décrit comme le « dessalement » ou dessalation, où le sodium et le chlorure apportés sont excrétés sous forme d'osmoles tandis que l'eau exempte de sodium est réabsorbée grâce à l'action de l'ADH au niveau du tube collecteur (45).
- L'administration orale d'urée (15-30 g par jour) est une stratégie alternative efficace pour corriger l'hyponatrémie dans le SIADH qui peut être envisagée chez les patients moins graves ou comme traitement de deuxième ligne (46). Cependant, la diurèse osmotique se produit en second lieu avec une perte d'eau libre sans électrolyte conduisant à une augmentation de la concentration de sodium sérique (c'est-à-dire que plus l'osmolarité de l'urine est faible, plus la perte d'eau libre sans électrolytes et l'augmentation du sodium sérique seront élevées), ce qui la rend inappropriée dans le SPS (32).
- Pour finir, la fludrocortisone est souvent utilisée pour traiter les hyponatrémies des patients présentant un syndrome de perte de sel. La fludrocortisone a une action minéralo-corticoïde prédominante, « aldosteron-like ». Elle va augmenter la réabsorption distale du sodium et favoriser l’excrétion du potassium. Une récente étude randomisée contrôlée a été réalisée chez des patients présentant un syndrome de perte de sel avec hyponatrémie. Chez ces patients atteints de méningite tuberculeuse, l’administration de fludrocortisone permettait de corriger plus rapidement l'hyponatrémie, avec une augmentation des épisodes d’hypokaliémies sévères et d’hypertension artérielle (47).
Au total, le SPS est désormais une cause reconnue d’hyponatrémie chez le cérébrolésé, justifiant un traitement spécifique urgent. La compréhension des mécanismes physiopathologiques pourrait orienter une prise en charge plus spécifique, notamment pour le diagnostic, la prévention et/ou le suivi du SPS.
12
3. Problématiques et hypothèses
Les perturbations de la fonction rénale sont fréquentes chez le patient traumatisé crânien, et potentiellement responsables d’effets délétères. De manière étonnante, les mécanismes physiopathologiques responsables de ces perturbations ne sont pas démontrés et restent peu explorés. Or la compréhension des mécanismes physiopathologiques est un prérequis indispensable pour le diagnostic, la prévention et la prise en charge des patients de réanimation.
Ce travail a donc pour objectif principal d’explorer les mécanismes physiopathologiques des perturbations de la fonction rénale (augmentation de la clairance rénale et syndrome de perte en sel) chez le patient traumatisé crânien en utilisant des marqueurs accessibles en pratique clinique.
Plusieurs hypothèses de travail ont été élaborées :
1. L’inhibition de la vasomotricité artériolaire serait le mécanisme principal de l’ACR chez le patient de traumatologie. La perte d’autorégulation rendrait le DSR et le DFG dépendant des changements hémodynamiques systémiques.
2. L’hyponatrémie chez le cérébrolésé serait la conséquence d’un bilan sodé négatif dans le cadre d’une natriurèse inadaptée. L’augmentation de la clairance rénale pourrait être un mécanisme explicatif à une natriurèse accrue. Une étiologie tubulaire pourrait être explorée par le biais de la fraction excrétée d’urate.
Dans cette optique, nous avons créé une base de données chez tous les patients polytraumatisés et traumatisés crâniens admis en réanimation chirurgicale au cours d’une période de 6 mois. Tous les patients bénéficiaient d’un ionogramme urinaire quotidien. Les données cliniques, biologiques et échographiques collectées au cours des 7 premiers jours du séjour étaient reportées Tableau 2. Le calcul de l’apport en sodium intraveineux ou per os a été réalisé chez tous nos patients de façon quotidienne (Tableau 3). Nous avons estimé que l’absorption du sodium était complète et nous avons négligé les pertes sodées autres qu’urinaires (digestives et insensibles comme la sueur et les larmes).
13
Tableau 2. Recueil des données cliniques et paracliniques au cours du temps (en jour).
Jour 1 Jour 2 Jour 3 Jour 4 Jour 5 Jour 6 Jour 7 Poids
Apports hydriques (ml/24h) Balance hydrique (ml/24h) Apports sodés (mmol/24h) Balance sodée (mmol/24h) Créatinine plasmatique (µmol/L)
Natrémie (mmol/L) Kaliémie (mmol/L) Phosphate (mmol/L)
Glycémie (mmol/L) Urée plasmatique (mmol/L)
Hématocrite (%) Protidémie (g/L) Acide urique (mmol/L) Osmolarité plasmatique (mmol/L)
Diurèse (ml/24h) Créatininurie (mmol/L) Urée urinaire (mmol/L) Urate urinaire (mmol/L) Phosphaturie (mmol/L) Natriurèse (mmol/L)
Glycosurie (mmol/l) Kaliurèse (mmol/L) Chlore urinaire (mmol/L)
FeNa (%) FeUrée (%) FeUrate (%) FePhosphate (%) Osmolarité urinaire (mmol/24h)
Osmolarité urinaire (mmol/L) Clairance de l'eau libre CrCL mesurée (ml/min) Ventilation mécanique (1/0)
Sédation (MDZ/PROPO) Noradrénaline (1/0)
Noradrénaline (moyenne/24h, en µg/kg/min) Inotrope (1/0) Mannitol (1/0) HSHC (1/0) AINS (1/0) IEC (1/0) Fludrocortisone (1/0) Urée (1/0) Acétazolamide (1/0) Diurétiques de l'anse (1/0) PAM moyennée (mmHg) FC moyennées (bpm) ITV sous-aortique (ETT)
Débit cardiaque (ETT)
Index de résistivité rénal (échographie rénale) BNP (pg/ml)
Aldostérone (pmol/L) Cortisol (noml/L)
14
Tableau 3. Calcul apport sodé quotidien
Par jour (mmol/unité) Na 0-6 6-12 12-18 18-24 Total Bilan hydrique (ml/24h) (mmol/24h) Bilan sodé
Réhydratation (ml) Remplissage (ml) NaCl 0,9% (par ml) 0,15 Isofundine (par ml) 0,15 Albumine (4 ou 20%) 0,15 Ringer (par ml) 0,13 PG5 (par ml) 0,07 Bicarbonates 4,2% 0,50 Bicarbonates 1,4% 0,17 Dextrion 0,03 Parentérale (par ml) 0,04 Per os (ml) Nutrison (par ml) 0,04 SE (ml) IV (ml) NaCl 10% (par ml) 1,71 NaCl 3% (par ml) 0,51
SE dilués (par ml de NaCL 0,9%) 0,15
IV dilués (par ml de NaCL 0,9%) 0,15
Thiopental (par flacon de 1g) 4,60
Amoxicilline / Augmentin (par flacon de 2g) 5,48
Céfazoline (par flacon de 2g) 4,40
Ceftriaxone (par flacon de 2g) 7,20
Cefotaxime (par flacon de 2g) 4,20
Pipéracilline ± Tazobactam (par flacon de 4g) 11,35
Ceftazidime (par flacon de 2g) 4,50
Méropéném (par flacon de 2g) 7,80
Ciprofloxacine (par poche de 200mg/100ml) 30,80
Lévofloxacine (par poche de 500mg/100ml) 15,80
Linézolide (par poche de 600mg/300ml) 4,95
Métronidazole (par poche de 500mg/100ml) 14,76
Lévétiracétam(par flacon de 500 mg) 0,80
Paracétamol (par poche de 1g/100ml) 0,17
15
Augmented renal clearance in critically ill trauma patients: a pathophysiologic approach using renal vascular index.
Authors: CEDRIC CARRIE*, M.D.1, ALEXANDRE LANNOU1, SEBASTIEN RUBIN, M.D.2, LAURENT PETIT, M.D.1, MATTHIEU BIAIS, M.D Ph.D.1, 3
ADDRESS AND AFFILIATION
1. Anesthesiology and Critical Care Department, CHU Bordeaux, 33000 Bordeaux, France 2. Nephrology Department, CHU Bordeaux, 33000 Bordeaux, France
3. Univ. Bordeaux Segalen, 33000 Bordeaux, France
EMAIL ADRESSES : cedric.carrie@chu-bordeaux.fr alexandre.lannou@chu-bordeaux.fr sebastien.rubin@chu-bordeaux.fr laurent.petit@chu-bordeaux.fr matthieu.biais@chu-bordeaux.fr (*) CORRESPONDING AUTHOR Dr Cédric CARRIE,
Surgical and Trauma Intensive Care Unit, Anesthesiology and Critical Care Department Hôpital Pellegrin, CHU Bordeaux,
Place Amélie Raba Léon, 33076 Bordeaux Cedex, France
16
ABSTRACT
BACKGROUND: In critically ill trauma patients, augmented renal clearance (ARC) is common and may result in subtherapeutic antibiotic exposure. The aim of the present study was to explore the relationship between creatinine clearance (CrCL), cardiac output (CO) and renal Doppler vascular index (RVI) in order to
assess the potential mechanisms driving ARC in this population.
METHODS: This study involves a retrospective review of a prospectively collected database of every trauma patients consecutively admitted to a 25-bed Surgical and Trauma Intensive Care Unit (ICU) over a 3-month period. Were included every trauma patients who underwent cardiac and renal ultrasound measurements over three consecutive days during their initial ICU management. ARC was defined by a 24-hr urinary measured CrCL > 130 ml/min
RESULTS: Thirty patients, contributing for 86 coupled physiologic data, were retrospectively analyzed. There was an inverse correlation between CrCL and RVI values (ρ = -0.501; p < 0.0001). The best threshold value
for RVI to predict ARC was 0.65 (sensibility 76% [62 – 86]; specificity 72% [56 - 84]). There was only a slight correlation between CrCL and CO values (ρ = 0.219; p = 0.05). There was no statistical correlation between RVI
and MAP (ρ = -0.09; p = 0.41), whether in patients with or without ARC.
CONCLUSION: The combination of an inhibition of arteriolar vascular tone coupled with an increased cardiac output in patients with a greater physiological reserve should been accepted as the leading mechanism for ARC.
KEY WORD: Augmented renal clearance; Renal vascular index; Renal ultrasound; Trauma; Critical illness
17
BACKGROUND
For several years, augmented renal clearance (ARC) has been increasingly investigated in critical care practice, currently defined by an increased urinary creatinine clearance (CrCL) exceeding 130 mL/min/1.73m²
[1]. ARC has been reported in approximately 30-65% of patients during the first week in the intensive care unit [2]. At-risk populations of ARC included those with sepsis, burns, major trauma and brain injury [3, 4]. This is a major concern as ARC has been recognized as one of the leading causes of subtherapeutic antibiotic exposure, potentially responsible for poor clinical outcome in septic patients [4-9].
The pathophysiologic mechanisms responsible for ARC in critically ill patients remain mainly unknown, although alterations in both glomerular filtration and renal tubular function have been observed [10]. The most widespread theory involves an increase in cardiac output, resulting in an increased renal blood flow (RBF) and therefore an increased glomerular filtration rate (GFR) [11]. However, most trials failed to establish a significant relationship between cardiac index and ARC, suggesting that the underlying mechanisms are likely more complex [1]. Other authors thus hypothesized that changes in vasomotor tone and intra-glomerular filtration pressure were potentially the main mechanism underlying ARC in critically ill patients [10].
Renal Doppler vascular index (RVI) has been used to reflect regulation of renal vascular tone in the critical care settings [12, 13]. A recent meta-analysis suggested that abnormally high RVI was associated with further renal impairment in septic critically ill patients [14]. In addition, RVI seems to be of interest in evaluating changes in renal perfusion as a consequence of therapeutic interventions [15-17]. The ability of RVI to monitor renal perfusion remains, however, questionable and still needs to be demonstrated [18].
The main objective of this study was thus to investigate the relationship between 24-hr urinary creatinine clearance (CrCL), renal Doppler vascular index (RVI) and cardiac output (CO) in critically ill trauma
patients. We hypothesized that ARC should be driven by an inhibition of arteriolar tone responsible for a loss of renal autoregulation, RBF and GFR becoming dependent of changes in systemic hemodynamics.
18
METHODS
1. Design, population and settings
This study is a retrospective analysis of our local database (declared to the French Data Protection Authority: declaration number 2166637v0) prospectively collected in a 25-bed Surgical and Trauma Intensive Care Unit (ICU) over a 3-month period (May to July 2018). Ethical approval for this analysis was obtained from the Ethics Committee of the French Society of Anesthesiology and Intensive Care (IRB number: CERAR 00010254-2018-089). The patients and/or next of kin were informed about the inclusion of their anonymized health data in the database, and none declined participation.
During the study period, every trauma patients who underwent cardiac and renal ultrasound over three consecutive days during their initial ICU management were included. Indications for performing the ultrasound measurements were at the discretion of the attending physician. Non-inclusion criteria were pregnancy, age < 18 years, end-stage renal failure or indication for renal replacement therapy, known renal artery stenosis, cirrhosis, congestive heart failure, atrial fibrillation or arrhythmia.
19
2. Data collection and ultrasound measurements
Our local database includes daily metabolic, hemodynamic and ultrasound measurements prospectively collected as part of a standard care in every trauma patient. Serum creatinine was measured using a standardized enzymatic method with Isotope Dilution Mass Spectrometry (IDMS). Measured CrCL was
calculated as follows: 24-hr urinary volume (ml/day) x urinary creatinine (mmol/L) / plasma creatinine (µmol/L), converted in ml/min. Excretion fraction of sodium (FENa) was calculated as follows: (urinary sodium [mmol/L] x
plasma creatinine [µmol/L]) / (urinary creatinine [mmol/L] x Natremia [mmol/L]). For data analysis, ARC was defined by a measured CrCL > 130 ml/min. For population analysis, patients were considered in ARC when the
mean CrCL was above 130 ml/min over the three consecutive days.
All cardiac and renal ultrasound measurements were performed using a General Electric Vivid S6 machine (GE Healthcare, Wauwatosa, WI, USA) by an experienced physician unaware of the measured CrCL. As
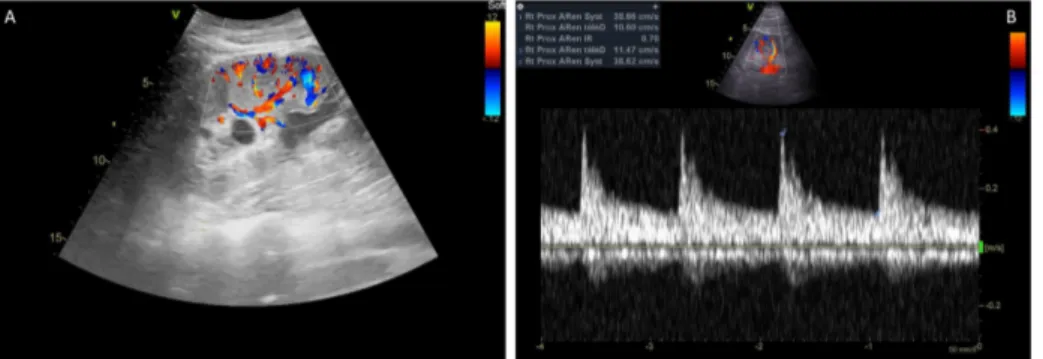
previously described, renal Doppler vascular index was obtained from the most representative proximal interlobar arteries [19]. The peak systolic velocity (Vmax) and the minimal diastolic velocity (Vmin) were
determined by pulse wave Doppler, and RVI was calculated as (Vmax - Vmin)/Vmax. The results from three
consecutive similar-appearing waveforms were averaged for each kidney (Supplementary Data). Using echocardiography, stroke volume (SV) was calculated as the product of the aortic valve area (π/diameter²/4) by the area under the envelope of the pulsed-wave Doppler measured at the aortic annulus and averaged over three consecutive measurements. Cardiac output was calculated as the product of heart rate (HR) and stroke volume.
The intra-observer and interobserver reproducibility of VTI and RI measurements were assessed in ten patients before the study. Intra-observer variability coefficient was 5 ± 3% for RVI and 4 ± 3% for VTI. Inter-observer variability was 4 ± 3% for RVI and 4 ± 4% for VTI. The least significant change was 9.8 for RVI and 7.8 for VTI.
20
3. Statistical analysis
Results are expressed as mean ± standard deviation or median (25% to 75% interquartile range) for continuous variables and as numbers (percentages) for categorical variables. The data distribution was analyzed by a Kolmogorov-Smirnov test. Comparisons between continuous variables were performed using the Student t test or the Mann–Whitney test and categorical variables were compared using the chi-square test or Fisher’s exact test as appropriate.
Relationships between RVI, CO and CrCL were assessed using Spearman’s correlation coefficient and
differences over time were assessed by repeated-measures ANOVA procedure. The reliability of each variable was estimated by intraclass correlation coefficients. The accuracy of RVI and CO to predict ARC was assessed using a receiving operator curve (ROC) analysis. The best threshold values were chosen to maximize Youden index. These thresholds were subsequently adopted to define higher and lower RVI and CO values. Finally, the correlation between RVI and MAP was assessed to estimate renal autoregulation using logistic regression procedure [13, 20].
A p value < 0.05 was considered statistically significant. Statistical analyses were performed using XLSTAT 2017 for Windows (Addinsoft Paris, France).
21
RESULTS
1. Population
During the study period, 63 trauma patients were admitted for multiple trauma, brain trauma or both. Only thirty patients met the inclusion criteria (lack of ultrasound data over 3 consecutive days, N = 30; end-stage renal failure or indication for renal replacement therapy, N = 3). Most of them were included the first day of ICU admission (73%); others were included the second (17%) or the third day (10%) of ICU admission. The characteristics of the population are resumed Table 1. Over the three consecutive days, 18 patients (60%) presented ARC (mean CrCL > 130 ml/min) and 4 (13%) presented renal failure (mean CrCL < 60 ml/min).
Finally, 86 coupled data of CrCL, RVI and CO were analysed (missing CrCL value in 4 patients). Representation
of CrCL, RVI and CO over time is showed in Figure 1. The intra-patient variability coefficients were 15 ± 10% for
CrCL, 6 ± 4% for RVI and 19 ± 9% for CO without significant difference over the three consecutive days. The
intraclass correlation coefficients were 0.93 [0.87 – 0.97] for CrCL, 0.83 [0.68 – 0.92] for RVI and 0.51 [0.06 –
22
2. Relationship between CrCL, RI and systemic hemodynamic data
Mean values for CrCL was 139 ± 56 ml/min over the three consecutive days, and ARC was found in 52/86
urinary samples (60%). There was an inverse correlation between CrCL and RVI values (r = -0.501; p < 0.0001).
There was only a weak correlation between CrCL and CO values (r = 0.219; p = 0.05) (Figure 2). There was no
statistical correlation between CrCL and MAP values or norepinephrine dosages.
The best threshold values for RVI and CO to predict ARC were respectively 0.65 (sensibility 76% [62 – 86]; specificity 72% [56 - 84]) and 5.5 L/min (sensibility 44% [32 – 58]; specificity 80% [64 - 90]). Those values were used to define lower and higher values for both CI and RVI measurements. The ROC curves (0.74 [0.64 – 0.84],
p < 0.001 and 0.6 [0.48 – 0.72], p = 0.106 respectively) are displayed in Figure 3. Representation of CrCL
measurements according to various values of CO and RVI is depicted Figure 4. Percentages of ARC according to various values of RVI and CO are depicted in Supplementary Data.
We found no statistical correlation between RVI and MAP (r = -0.09; p = 0.41), whether in patients with or without ARC. For a given MAP, lower RVI values were observed in ARC patients (Supplementary data). There was no relationship between RVI and norepinephrine dose.
23
DISCUSSION
In critically ill patients, augmented renal clearance is common and may result in subtherapeutic antibiotic exposure when standard dosing regimens are used [1-9]. On the other hand, evidence regarding the pathophysiological mechanism underlying ARC is uncommon, and the hypothesis put forward to date remain to be confirmed.
Our results suggested an inverse correlation between RVI and CrCL in critically ill trauma patients
without renal impairment. The weak but statistical association between CO and CrCL suggested that increased
cardiac output is not the main mechanism responsible for ARC. In another physiological study using exogenous markers of renal function in 20 critically ill patients with ARC, Udy et al. observed a strong correlation between CrC, Sinistrin clearance and PAHclearance, demonstrating elevated glomerular filtration and high renal plasma
flow in ARC patients [10]. On the other hand, considerable variations in filtration fraction, supporting the hypothesis that changes in intra-glomerular filtration pressure were probably the key mechanism underlying ARC in critically ill patients. In agreement with these data, we can assume that 1) lower RVI for a given MAP should reflect the inhibition of arteriolar tone responsible for ARC in critically ill patients; 2) the sustained vasodilatation may contribute to kidney autoregulation impairment, 3) RBF and GFR becoming dependent of changes in systemic hemodynamics.
Nevertheless, we observed a considerable overlap in RVI and CO values between patients with or without ARC, suggesting a significant inter-individual variability. Under normal conditions, renal functional reserve reflects the ability of the kidney to respond to an increased physiological demand through a combination of nephron recruitment, increase in renal blood flow and/or glomerular hyperfiltration [21]. Renal functional reserve seems to be significantly lower in the elderly than in young and healthy individuals, potentially explaining the demographic characteristics of ARC patients [1]. Moreover, the key mechanism leading to this reduced arteriolar tone remains unknown. Trauma, sepsis and systemic inflammation may result in afferent vasodilation and increased renal blood flow [22, 23]. In brain damaged patients, the implication of a specific plasma mediator of a “brain-kidney” crosstalk remains an attractive theory. In this context, experimental data have suggested a right shift of cerebral autoregulation curve after inhibition of NO synthesis
24 [24]. Although speculative, the role of natriuretic factors, endothelin and relaxin has also been advocated [11, 25, 26]. Further studies are needed to explore the association between cerebral reactivity and renal autoregulation in this specific population at risk for ARC [27].
The aim of our work was to study the possible involvement of renal vascular tone (studied using Doppler vascular index) in ARC physiopathology in critically ill patients. We did not use RVI as a screening marker for ARC, the considerable overlap between patients with and without ARC precluding the use of this index in daily practice. Indeed, determinants of RVI are multiple, including renal vascular resistances (RVR) and compliance, renal interstitial pressure, ureteral pressure or systemic arterial pressure [28]. Although RVI is not a valuable reflect of renal blood flow, Lerolle et al. previously demonstrated a negative relationship between MAP and RVI, without correlation with the dose of norepinephrine. Higher RVI values were observed in patients with acute kidney injury, consistent with the physiological increase in RVR in hypoperfusion situations [13]. This assessment was however challenged by Dewitte et al. in which such a relationship was only observed in patients without persistent AKI, suggesting that RVI could only reflect renal autoregulation before the occurrence of renal vascular or tubular damage [20]. The statistical association between CrCL, RVI and MAP was
not observed in the current study, although ARC patients displayed lower RVI for a given MAP, suggesting a shift in renal autoregulation.
The current study has some limitations. First, the design was monocentric with a retrospective analysis over a relatively short period (3 months), which limits the generalizability of the results. Moreover, we included only trauma patients who underwent at least three consecutive renal and cardiac ultrasound measurements, which excluded half of the patients admitted over the period. However, ultrasound measurements were standardized, prospectively collected and blinded for CrCL values. Moreover, we acknowledge a limited number
of patients, although contributing for numerous physiologic data without statistical differences over time using repeated-measures ANOVA procedure. Third, RVI, MAP and CO levels were measured once per day whereas CrCL was recorded from the 24-hr urinary samples. As those parameters may vary widely over 24h in ICU
patients, it is uncertain that CrCL data correspond to the actual CrCL at the time of other physiologic parameters
measurements. This limitation could explain the poor correlation between CO and 24-hr CrCL when compared
25 could be a limiting factor if we consider that the hyperkinetic phase at risk of ARC occurs mainly in the initial phase. Finally, 24-hr measured CrCL is known to overestimate glomerular filtration rate and RVI is far from being
the most valuable marker of renal vascular resistance or plasma renal flow [18, 21]. On the other hand, the clinical evaluation of renal autoregulation is restricted because of the lack of non-invasive RBF assessment at the bedside [27]. Standardized and valuable measurements of GFR and RPF by exogenous markers, contrast-enhanced ultrasound and/or magnetic resonance imaging might be necessary to corroborate the hypothesis pertaining to this study.
26
CONCLUSION
Increased cardiac output is not the main mechanism responsible for ARC. The combination of an inhibition of arteriolar vascular tone coupled with an increased renal blood flow in patients with a greater physiological reserve should been accepted as the leading mechanism for ARC. Further studies are though necessary to comfort this hypothesis.
27
LIST OF ABBREVIATIONS
• ARC = augmented renal clearance • CO = cardiac output
• CrCL = creatinine clearance
• GFR = glomerular filtration rate • HR = heart rate
• ICU = Intensive Care Unit • RBF = renal blood flow • RVI = renal vascular index • ROC = receiving operator curve • SV = stroke volume
• Vmax = peak systolic velocity
28
REFERENCES
1. Bilbao-Meseguer I, Rodríguez-Gascón A, Barrasa H, et al. Augmented Renal Clearance in Critically Ill Patients: A Systematic Review. Clin Pharmacokinet. 2018;57(9):1107-1121
2. Udy AA, Baptista JP, Lim NL, et al. Augmented renal clearance in the ICU: results of a multicenter observational study of renal function in critically ill patients with normal plasma creatinine concentrations. Crit Care Med. 2014;42(3):520-527
3. Udy A, Boots R, Senthuran S, et al. Augmented creatinine clearance in traumatic brain injury. Anesth Analg. 2010;111(6):1505-1510
4. Sime FB, Udy AA, Roberts JA. Augmented renal clearance in critically ill patients: etiology, definition and implications for beta-lactam dose optimization. Curr Opin Pharmacol. 2015;24:1-6
5. Udy AA, Varghese JM, Altukroni M, et al. Subtherapeutic initial β-lactam concentrations in select critically ill patients: association between augmented renal clearance and low trough drug concentrations. Chest. 2012;142(1):30-39
6. Udy AA, Lipman J, Jarrett P, et al. Are standard doses of piperacillin sufficient for critically ill patients with augmented creatinine clearance? Crit Care. 2015;19:28
7. Carrie C, Bentejac M, Cottenceau V, et al. Association between augmented renal clearance and clinical failure of antibiotic treatment in brain-injured patients with ventilator-acquired pneumonia: A preliminary study. Anaesth Crit Care Pain Med. 2018; 37(1):35-41.
8. Carrié C, Petit L, d'Houdain N, et al. Association between augmented renal clearance, antibiotic exposure and clinical outcome in critically ill septic patients receiving high doses of β-lactams administered by continuous infusion: a prospective observational study. Int J Antimicrob Agents. 2018; 51(3):443-449.
9. Carrié C, Rubin S, Sioniac P, et al. The kinetic glomerular filtration rate is not interchangeable with measured creatinine clearance for prediction of piperacillin underexposure in critically ill patients with augmented renal clearance. Crit Care. 2018; 22(1):177.
10. Udy AA, Jarrett P, Stuart J, et al. Determining the mechanisms underlying augmented renal drug clearance in the critically ill: use of exogenous marker compounds. Crit Care. 2014;18(6):657
29 11. Udy AA, Jarrett P, Lassig-Smith M, et al. Augmented Renal Clearance in Traumatic Brain Injury: A Single-Center Observational Study of Atrial Natriuretic Peptide, Cardiac Output, and Creatinine Clearance. J Neurotrauma. 2017; 34(1):137-144.
12. Schnell D, Darmon M. Bedside Doppler ultrasound for the assessment of renal perfusion in the ICU: advantages and limitations of the available techniques. Crit Ultrasound J. 2015; 7(1):24.
13. Lerolle N, Guérot E, Faisy C, et al. Renal failure in septic shock: predictive value of Doppler-based renal arterial resistive index. Intensive Care Med. 2006; 32(10):1553-1559.
14. Ninet S, Schnell D, Dewitte A, et al. Doppler-based renal resistive index for prediction of renal dysfunction reversibility: A systematic review and meta-analysis. J Crit Care. 2015; 30(3):629-635. 15. Deruddre S, Cheisson G, Mazoit JX, et al. Renal arterial resistance in septic shock: effects of increasing
mean arterial pressure with norepinephrine on the renal resistive index assessed with Doppler ultrasonography. Intensive Care Med. 2007; 33(9):1557-1562.
16. Lauschke A, Teichgräber UK, Frei U, Eckardt KU. 'Low-dose' dopamine worsens renal perfusion in patients with acute renal failure. Kidney Int. 2006; 69(9):1669-1674.
17. Moussa MD, Scolletta S, Fagnoul D, et al. Effects of fluid administration on renal perfusion in critically ill patients. Crit Care. 2015; 19:250.
18. Wan L, Yang N, Hiew CY, et al. An assessment of the accuracy of renal blood flow estimation by Doppler ultrasound. Intensive Care Med. 2008; 34(8):1503-1510.
19. Schnell D, Darmon M. Renal Doppler to assess renal perfusion in the critically ill: a reappraisal. Intensive Care Med. 2012; 38(11):1751-1760.
20. Dewitte A, Coquin J, Meyssignac B, et al. Doppler resistive index to reflect regulation of renal vascular tone during sepsis and acute kidney injury. Crit Care. 2012; 16(5):R165.
21. Ronco C, Bellomo R, Kellum J. Understanding renal functional reserve. Intensive Care Med. 2017;43(6):917-920
22. Bellomo R, Kellum JA, Ronco C, et al. Acute kidney injury in sepsis. Intensive Care Med 2017; 43:816-828
23. Ricci Z, Romagnoli S, Ronco C. The 10 false beliefs in adult critical care nephrology. Intensive Care Med. 2018; 44(8):1302-1305.
30 24. Garry PS, Ezra M, Rowland MJ, et al. The role of the nitric oxide pathway in brain injury and its
treatment--from bench to bedside. Exp Neurol. 2015; 263:235-243.
25. Chapman AB, Abraham WT, Zamudio S, et al. Temporal relationships between hormonal and hemodynamic changes in early human pregnancy. Kidney Int. 1998; 54(6):2056-2063.
26. Maegele M, Wafaisade A, Peiniger S, Braun M. The role of endothelin and endothelin antagonists in traumatic brain injury: a review of the literature. Neurol Res. 2011;33(2):119-126.
27. Dias C, Gaio AR, Monteiro E, et al. Kidney-brain link in traumatic brain injury patients? A preliminary report. Neurocrit Care. 2015; 22(2):192-201.
28. Lerolle N. Please don't call me RI anymore; I may not be the one you think I am! Crit Care. 2012; 16(6):174.
29. Post EH, Vincent JL. Renal autoregulation and blood pressure management in circulatory shock. Crit Care. 2018;22(1):81
31
TABLES AND FIGURES LEGEND
Table 1: Characteristics of the population
Figure 1: Variations of creatinine clearance CrCL (ml/min), cardiac output CO (L/min) and renal Doppler vascular
index RVI over three consecutive days in 30 critically ill trauma patients.
Figure 2: Relationship between creatinine clearance CrCL (ml/min) and (A) renal Doppler resistivity index RVI or
(B) Cardiac Output CO (L/min) and (C) Mean Arterial Pressure (MAP) in 88 pooled physiologic data over three consecutive ICU-days.
Figure 3: Receiver operating characteristic (ROC) showing the ability of resistivity index (continuous line; area under the curve = 0.74 [0.64 – 0.84], p < 0.001; best cut-off value RI ≤ 0.65) and cardiac output (dotted line; area under the curve = 0.6 [0.48 – 0.72], p = 0.106; best cut-off value CO > 5.5 L/min) to predict ARC defined by a 24-hr urinary creatinine clearance > 130 ml/min.
Figure 4: Representation of creatinine clearance (CrCL) measurements according to different values of cardiac
32
SUPPLEMENTARY DATA
Appendix 1: Principles of measurements of renal Doppler vascular index (RVI). (A) Visualization of proximal interlobar arteries in color-Doppler mode. (B) Peak systolic velocity (Vmax) and minimal diastolic velocity (Vmin) determined by pulsed Doppler from three consecutive similar-appearing waveforms. RVI calculated as
(Vmax - Vmin)/Vmax [19].
Appendix 2: Percentages of ARC according to various values of cardiac output (CO) and renal Doppler vascular index (RVI).
Appendix 3: Relationship between Renal Vascular Index (RVI) and Mean Arterial Pressure (MAP) with (continuous line) and without (dotted line) Augmented Renal Clearance (ARC).
33
Table 1: Characteristics of the population
Overall (N = 30) No ARC (N = 12) ARC (N = 18) p Demographic data • Age • Male sex • Body Mass Index
48 [32 – 67] 27 (90) 26 [22 – 29] 67 [57 – 75] 11 (92) 27 [22 – 29] 36 [28 – 56] 16 (89) 27 [22 – 29] 0.002 0.804 0.882 Reason for admission
• Multiple trauma with brain trauma • Isolated brain trauma
• Multiple trauma without brain trauma
13 (43) 9 (30) 8 (27) 5 (42) 5 (42) 2 (17) 8 (44) 4 (22) 6 (33) 0.880 0.255 0.312 SAPS II at ICU admission
ISS 42 [23 – 49] 34 [29 – 50] 50 [46 – 55] 46 [29 – 57] 31 [18 – 42] 32 [27 – 40] 0.001 0.125 Norepinephrine at ICU admission
Median duration for norepinephrine infusion
18 (60) 5 [0 – 8] 8 (67) 1 [0 – 2] 10 (56) 1 [0 – 2] 0.54 0.930 Mechanical ventilation at ICU admission
Median duration for mechanical ventilation
22 (73) 5 [0 – 8] 9 (75) 8 [2 – 10] 13 (72) 2 [0 – 6] 0.866 0.035 Median values from day 1 to 3
• Serum creatinine (µmol/L) • Diuresis
• Urine creatinine (mmol/L) • 24-hr urinary CrCL (ml/min) • Natremia (mmol/L) • Natriuresis (mmol/L)
• Excreted fraction of sodium (%) • RVI
• CO (L/min) • MAP (mmHg)
• Doses of norepinephrine (µg/kg/min)
56 [53 – 79] 1858 [1275 – 2700] 6.8 [4.9 – 9.8] 148 [114 – 169] 140 [137 – 142] 90 [54 – 120] 0.77 [0.30 – 1.19] 0.64 [0.62 – 0.70] 4.9 [4.2 – 5.9] 89 [83 – 94] 0.02 [0 – 0.19] 83 [54 – 105] 1787 [1228 – 2183] 6.2 [4.4 – 7.2] 105 [51 – 115] 143 [139 – 151] 89 [61 – 110] 0.98 [0.63 – 1.13] 0.70 [0.65 – 0.74] 4.7 [4.1 – 5.1] 90 [87 – 100] 0.07 [0 – 0.25] 56 [53 – 61] 1997 [1228 – 2183] 7.5 [5.2 – 11.6] 168 [160 – 187] 138 [137 – 140] 91 [51 - 144] 0.69 [0.23 – 0.88] 0.63 [0.61 – 0.65] 5.2 [4.4 – 6.2] 88 [82 – 89] 0 [0 – 0.16] 0.054 0.397 0.062 < 0.0001 0.029 0.719 0.066 0.025 0.363 0.122 0.205
Length of stay in ICU 12 [8 – 17] 16 [10 – 17] 11 [8 – 14] 0.203
Death in ICU 3 (10) 3 (25) 0 (0) 0.025
Results expressed in numbers (percentages) or median [25% to 75% interquartile range]. ARC = Augmented
Renal Clearance (mean CrCL > 130 ml/min over 3 consecutive days); CO = Cardiac Output; CrCL = Creatinine
Clearance; ICU = Intensive Care Unit; ISS = Injury Severity Score; MAP = Mean Arterial Pressure; RVI = Renal Vascular Index; SAPS = Simplified Acute Physiologic Score
34
Figure 1: Variations of creatinine clearance CrCL (ml/min), cardiac output CO (L/min) and renal Doppler vascular
index RVI over three consecutive days in 30 critically ill trauma patients.
0,5 0,55 0,6 0,65 0,7 0,75 0,8 0,85 0,9 0 1 2 3 4 RI Day 2 3 4 5 6 7 8 9 0 1 2 3 4 C O (L/ min) Day 0 50 100 150 200 250 300 0 1 2 3 4 CrCL (ml/min) Day
35
Figure 2: Relationship between creatinine clearance CrCL (ml/min) and (A) renal Doppler resistivity index RVI or
(B) Cardiac Output CO (L/min) and (C) Mean Arterial Pressure (MAP) in 88 pooled physiologic data.
Correlations were assessed using Spearman correlation coefficient.
0,4 0,5 0,6 0,7 0,8 0,9 0 50 100 150 200 250 300
RI
Cr
CL(ml/min)
R² = 0.251, p < 0.0001
A
36
Correlations were assessed using Spearman correlation coefficient.
B
1 2 3 4 5 6 7 8 9 0 50 100 150 200 250 300C
O
(L/
min
)
Cr
CL(ml/min)
R² = 0.05, p = 0.05
37
38
Figure 3: Receiver operating characteristic (ROC) showing the ability of resistivity index (continuous line; area under the curve = 0.74 [0.64 – 0.84], p < 0.001; best cut-off value RI ≤ 0.65) and cardiac output (dotted line; area under the curve = 0.6 [0.48 – 0.72], p = 0.106; best cut-off value CO > 5.5 L/min) to predict ARC defined by
39
Figure 4: Representation of creatinine clearance (CrCL) measurements according to different values of cardiac
output (CO) and renal Doppler resistivity index (RI).
Correlations were assessed using Spearman correlation coefficient. Lower CO ≤ 5.5 L/min; higher CO > 5.5 L/min ; lower RI ≤ 0.65 and higher RI > 0.65.
40
Appendix 1. Principles of measurements of renal Doppler vascular index (RVI). (A) Visualization of proximal interlobar arteries in color-Doppler mode. (B) Peak systolic velocity (Vmax) and minimal diastolic velocity (Vmin)
determined by pulsed Doppler from three consecutive similar-appearing waveforms. RVI calculated as (Vmax -
Vmin)/Vmax [19].
41
Appendix 2: Percentages of ARC according to various values of cardiac output (CO) and renal Doppler vascular index (RVI).
42
Appendix 3: Relationship between Renal Vascular Index (RVI) and Mean Arterial Pressure (MAP) with (continuous line) and without (dotted line) Augmented Renal Clearance (ARC).
ARC
No ARC
0,5 0,6 0,7 0,8 0,9 1 40 50 60 70 80 90 100 110 120 130 140 RI MAP (mmHg)R² = 0.01; p = 0.41
43
Salt wasting syndrome in the brain-damaged patients:
a pathophysiologic approach using sodium balance and urinary biochemical analysis
Authors: ALEXANDRE LANNOU1, CEDRIC CARRIE*, M.D.1, SEBASTIEN RUBIN, M.D.2, GREGOIRE CANE1, VINCENT COTTENCEAU, M.D.1, LAURENT PETIT, M.D.1, MATTHIEU BIAIS, M.D Ph.D.1, 2
ADDRESS AND AFFILIATION
4. Anesthesiology and Critical Care Department, CHU Bordeaux, 33000 Bordeaux, France 5. Nephrology Department, CHU Bordeaux, 33000 Bordeaux, France
6. Univ. Bordeaux Segalen, 33000 Bordeaux, France
(*) CORRESPONDING AUTHOR Dr Cédric CARRIE,
Surgical and Trauma Intensive Care Unit, Anesthesiology and Critical Care Department Hôpital Pellegrin, CHU Bordeaux,
Place Amélie Raba Léon, 33076 Bordeaux Cedex, France
cedric.carrie@chu-bordeaux.fr
Number of Figures and Tables - Tables : 3
- Figures : 2
Word count:
- Abstract : 250 words - Article : 2158 words
44
ABSTRACT
PURPOSE: To explore the underlying mechanisms leading to the occurrence of hyponatremia and enhanced urinary sodium excretion in brain-damaged patients using sodium balance and urinary biochemical analysis.
METHODS: We conducted a retrospective analysis of a local database prospectively collected in 60 brain trauma patients without chronic renal dysfunction. Metabolic and hemodynamic parameters were averaged over three consecutive periods over the first seven days after admission. The main outcome investigated in this study was the occurrence of at least one episode of hyponatremia.
RESULTS: Over the study period, there was a prompt decrease in sodium balance (163 ± 193 vs. -12 ± 154 mmol/day, p < 0.0001) and free water clearance (-0.7 ± 0.7 vs. -1.8 ± 2.3 ml/min, p < 0.0001). The area under the ROC curves for sodium balance in predicting the occurrence of hyponatremia during the next period was 0.81 [95% CI: 0.64 – 0.97]. Variables associated with averaged urinary sodium excretion were sodium intake (R² = 0.26, p < 0.0001) and fractional excretion of urate (R² = 0.15, p = 0.009). Urinary sodium excretion was also higher in patients with sustained augmented renal clearance over the study period (318 ± 106 vs. 255 ± 135 mmol/day, p = 0.034).
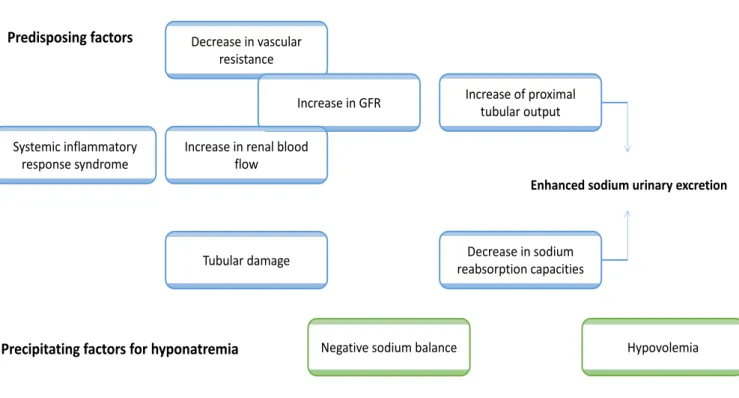
CONCLUSION: The decreased vascular volume resulting from a negative sodium balance is a major precipitating factor of hyponatremia in brain-damaged patients. Predisposing factors for enhanced urinary sodium excretion were high sodium intake, high fractional excretion of urate and augmented renal clearance over the first seven days after ICU admission.
45
INTRODUCTION
Salt wasting syndrome (SWS) is a common cause of hyponatremia in the brain-damaged patients, with a reported incidence varying from 0.8 to 34.6% according to the definition [1]. The most widespread theory explaining the renal loss of sodium purports a neurohumoral response involving a pressure-induced natriuresis, an increased level of natriuretic peptides and a hypoaldosteronism syndrome [2, 3]. Some authors also suggested a defect in proximal tubular sodium reabsorption, as suggested by the increased excretion fraction of solutes exclusively transported in the proximal tubule [4].
Although the pathophysiologic mechanisms responsible for SWS remain mainly unknown, the decreased vascular volume resulting from a renal loss of sodium is thought to be the leading mechanism for an enhanced ADH secretion despite an increasing plasma hypoosmolality [2, 4].Determining volume status is thus of paramount importance in brain-trauma patients, the assessment of which being universally agreed to be inaccurate by usual clinical criteria [3].
The hypothesis pertaining to this study is that a negative sodium balance could be a precipitating factor of hyponatremia during the acute phase of traumatic brain injury. Our objective was thus to explore the underlying mechanisms leading to the occurrence of hyponatremia and enhanced urinary sodium excretion in brain-damaged patients using sodium balance and urinary biochemical analysis.
46
METHODS
1. Design, population and settings
This study is a retrospective analysis of our local database (declared to the French Data Protection Authority, number 2166637v0) prospectively collected over an 8-month period (June 2018 to January 2019) in every brain trauma patients (Abbreviated Injury Score [AIS] > 3) consecutively admitted in a 25-bed Surgical and Trauma Intensive Care Unit (ICU). Study participants had to have an ICU length of stay alive ≥ 5 days and no evidence of congestive heart failure, cirrhosis or chronic renal failure (measured creatinine clearance [CLCR] <
60 ml/min/1.73m²). Patients who presented hyponatremia (i.e. ≤ 135 mmol/L) at ICU admission were also excluded.
As previously described, all patients were managed by a standardized protocol in accordance with French recommendations [5, 6]. Patients who presented at least one episode of hyponatremia underwent BNP (normal range < 100 pg/ml), aldosterone (normal range 53 – 645 pmol/L), TSH (normal range 0.35 – 4.94 UI/L) and cortisol (normal range 100 – 540 nmol/L) measurements and were treated by administration of hypertonic saline. Fludrocortisone (100 – 400 µg/day) was used in refractory cases of SWS [7].
Ethical approval was obtained from the Ethics Committee of the French Society of Anesthesiology and Intensive Care (CERAR 00010254-2018-153). The patients and/or next of kin were informed about the inclusion of their anonymized health data in the database, and none declined participation.
47
2. Study protocol and data collection
Plasma and 24-hr urinary samples were recorded daily and CLCR was calculated as follows: (24-hr urinary
volume x urinary creatinine)/plasma creatinine, converted in ml/min and normalized to a body surface area of 1.73 m² (Dubois formula). Sustained augmented renal clearance was considered in patients who presented a mean CLCR > 130 ml/min/1.73m² over the study period [6]. Free water clearance (CLH20) was also calculated as
follows: 24-h urine volume x (1 – Urinary Osmolality / Plasma Osmolality), converted in ml/min.
Fractional excretion of sodium (FENa, normal range < 1%) and urate (FEurate, normal ranges < 11%) were
both calculated with standard formulas. Fluid balance, sodium balance and averaged hemodynamic data (mean arterial pressure [MAP], norepinephrine [NE] infusion) were collected during the first seven days after admission. Metabolic and hemodynamic parameters were averaged over three consecutive periods: an early (day 1 – day 2), intermediate (day 3 – 4) and a late period (day 5 to day 7). The daily sodium intake conversion table is reported in Supplementary Data.
48
3. Statistical analysis
Results are expressed as mean ± standard deviation or median (25% to 75% interquartile range) for continuous variables and as numbers (percentages) for categorical variables. The data distribution was analyzed by a Kolmogorov-Smirnov test.
The main outcome investigated in this study was the occurrence of at least one episode of hyponatremia during the first seven days after admission for TBI. Only the first episode of hyponatremia was considered over the first seven days after admission. As the occurrence of hyponatremia justified a prompt increase in sodium intake, sodium balances couldn’t be compared over the same period between patients who presented or not an episode of hyponatremia. Hemodynamic and metabolic parameters of patients who presented or not a first episode of hyponatremia during the intermediate and late periods were thus compared during the previous period. The association between sodium balance during one period and the occurrence of hyponatremia the following period was also assessed using a receiving operator curve (ROC) analysis. A sample size of 56 patients was necessary to assess the predictive value of sodium balance with an AUC ≥ 0.75 and different from 0.5, assuming a 5% type I error rate, an 80% power and a prevalence of hyponatremia ≥ 25% [8]. A threshold analysis was also performed using a grey zone approach [9].
Precipitating factors of hyponatremia were also described by comparison of metabolic and hemodynamic parameters during the 48 hours before the occurrence of hyponatremia. Continuous variables were compared using Wilcoxon test for paired samples and categorical variables were compared using the chi-square test or Fisher’s exact test as appropriate. For the secondary outcome of this study, linear regression models were used to assess the effect of sodium intake, CLCR, MAP and FEurate on urinary sodium excretion averaged over the
study period. A p value < 0.05 was considered statistically significant.
49
RESULTS
1. Characteristics of the population
Over the study period, 60 TBI patients without chronic renal dysfunction contributed to the database. Overall, 16 patients (27%) presented at least one episode of hyponatremia, occurring after a median duration of 6 [4 – 7] days after ICU admission. Each episode of hyponatremia was adequately treated by administration of hypertonic saline ± fludrocortisone. The characteristics of the population are resumed Table 1.
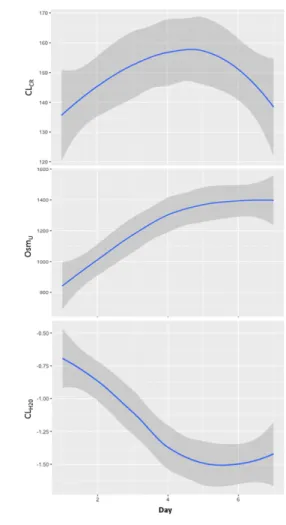
Averaged metabolic and hemodynamic parameters over the study periods are described Table 2. Over the study period, there was a prompt decrease of sodium balance (163 ± 193 vs. -12 ± 154 mmol/day, p < 0.0001), induced by an enhanced sodium excretion (202 ± 183 vs. 316 ± 154 mmol/day, p = 0.0002) and a decrease in sodium intake (375 ± 110 vs. 304 ± 114 mmol/day, p = 0.0003). Similarly, the decreased fluid balance (1.3 ± 1.0 vs. 0.6 ± 0.9 L/day, p = 0.001) was induced by an enhanced diuresis (2.5 ± 0.8 vs. 2.0 ± 1.1 L/day, p = 0.003) and a decreased fluid intake (3.3 ± 0.8 vs.3.1 ± 0.9 L/day, p = 0.038). Finally, a decreased plasma osmolality (307 ± 12 vs. 303 ± 12 mOsm/L, p = 0.014) and increased urinary osmolality (523 ± 141 vs. 605 ± 124 mOsm/L, p =
50
2. Precipitating factors for hyponatremia in brain-damaged patients
The evolution of metabolic and hemodynamic parameters during the 48 hours before the occurrence of hyponatremia are depicted Table 3. The rapid fall in Natremia was associated with an increased natriuresis, a negative sodium balance and a significant hemoconcentration over the two previous days. The day of hyponatremia, each patient presented normal values of BNP (41 [26 – 80] pg/ml), aldosterone (90 [72 – 180] pmol/L), TSH (0.6 [0.5 – 1.4] UI/L) and cortisol (396 [308 – 505] nmol/L).
Patients who presented an episode of hyponatremia during the intermediate and late periods had lower sodium balances during the previous period (Figure 1). There was no statistical difference regarding other averaged metabolic or hemodynamic data.
A negative sodium balance during one period was associated with an increased risk of hyponatremia the next period (OR = 9.3 [2.2 – 40.5], p = 0.001). A negative sodium balance had a sensibility of 80% [95%CI: 48 – 95%] and a specificity of 69% [95%CI: 59 – 77%] to predict hyponatremia the next period. The area under the ROC curves for sodium balance over one period in predicting the occurrence of hyponatremia during the following period was 0.81 [95% CI: 0.64 – 0.97] (Figure 2). The rate of patients who belonged to the grey zone was 38%.
51
3. Predisposing factors for enhanced sodium excretion
The averaged urinary sodium excretion was high, but not statistically different in patients who presented or not one episode of hyponatremia over the study period (287 ± 90 vs. 282 ± 133 mmol/day, p = 0.621). Continuous variables associated with averaged urinary sodium excretion were sodium intake (R² = 0.26, p <
0.0001) and FEurate (R² = 0.15, p = 0.009). Urinary sodium excretion was also higher in patients with sustained
augmented renal clearance over the study period (318 ± 106 vs. 255 ± 135 mmol/day, p = 0.034). The mean MAP was high, but not statistically associated with renal sodium excretion (R² = 0.035, p = 0.151).
52
DISCUSSION
To our knowledge, this is the first study aiming to assess the predisposing and precipitating factors of hyponatremia in brain-damaged patients. Over the first seven days after ICU admission, there was an inverse relationship between the prompt increase in urinary sodium excretion and the decrease in free-water clearance. Predisposing factors for enhanced urinary sodium excretion were higher sodium intake, higher FEurate values and augmented renal clearance over the first seven days after ICU admission. Patients with
negative sodium balance and hemoconcentration were particularly at risk for hyponatremia during this period.
On the one hand, there is general agreement that the renal loss of sodium is responsible for variable reduction in extracellular volume (ECV), leading to an appropriate ADH secretion that may promote renal free-water retention and hyponatremia despite an increasing plasma hypoosmolality [2, 4]. In this context, Audibert et al. determined blood volume by gold-standard radioisotope dilution methods and demonstrated a significant reduction in ECV after subarachnoid hemorrhage [3]. Authors argued that hyponatremia might be prevented by controlled sodium intake adapted to renal excretion. It should be noticed that the complexity of sodium intake calculation may preclude any clinical application. In this context, our results may suggest that monitoring of hemoconcentration markers (such as BUN or protidemia) should promote a prompt increase in ECV and sodium intake to avoid a sustained plasma hypoosmolality.
On the other hand, the pathophysiology of the enhanced urinary sodium excretion is not completely understood. Some authors previously advocated a decreased sympathetic outflow and an increased level of circulating natriuretic peptides [10, 11]. Moreover, hypoaldosteronism has been considered as a contributing factor for the enhanced sodium excretion [3]. Our results didn’t corroborate this neurohumoral theory, with normal BNP and aldosterone values reported in patients experiencing a first episode of hyponatremia. This result was in accordance with Maesaka et al. who first suggested that the contribution of natriuretic factors or renin-aldosterone levels was not straightforward in brain-damaged patients [4].

![Fig. 3.A. ROC curves of RVI (continuous line, AUC = 0.742 [95% CI: 0.649–0.834];P < 0.0001) and ARTIC score [dotted line, AUC = 0.842 (95% CI: 0.771–0.913;P < 0.0001)] for predicting augmented renal clearance (P = 0.049)](https://thumb-eu.123doks.com/thumbv2/123doknet/7418068.218817/78.892.170.703.142.375/curves-continuous-artic-score-dotted-predicting-augmented-clearance.webp)