Science Arts & Métiers (SAM)
is an open access repository that collects the work of Arts et Métiers Institute of Technology researchers and makes it freely available over the web where possible.
This is an author-deposited version published in: https://sam.ensam.eu
Handle ID: .http://hdl.handle.net/10985/9756
To cite this version :
Octavie OKAMBA-DIOGO, Emmanuel RICHAUD, Jacques VERDU, François FERNAGUT, Jean GUILMENT, Bruno FAYOLLE - Molecular and macromolecular structure changes in polyamide 11 during thermal oxidation - Kinetic modeling - Polymer Degradation and Stability - Vol. 120, p.76-87 - 2015
MOLECULAR AND MACROMOLECULAR STRUCTURE CHANGES IN POLYAMIDE 11 DURING
THERMAL OXIDATION – KINETIC MODELLING
Octavie OKAMBA‐DIOGOa,b, Emmanuel RICHAUDa1, Jacques VERDUa, François FERNAGUTb, Jean GUILMENTb, Bruno FAYOLLEa a Arts et Métiers ParisTech, CNRS, PIMM UMR 8006, 151 bd de l'Hôpital, 75013 Paris, France b ARKEMA, CERDATO, LEM, Route du Rilsan, 27470 Serquigny, France Abstract The oxidation kinetics of unstabilized polyamide 11 thin film under oxygen pressures up to 2.0 MPa was studied by means of ferrous ion method for hydroperoxides titration, size exclusion chromatography (SEC) for molar weight measurements and in situ FTIR monitoring for carbonyl build up. Oxidation was shown not to be limited by oxygen diffusion which militates in favor of the use of a simple kinetic model for simulating experimental data. The kinetic parameters of this model were estimated from literature for initiation and propagation, and from selective experiments such as ageing under several oxygen pressures for the estimation of the termination rate constants, or exposures under inert atmosphere to investigate the solid state polymerization effects and tentatively check the boundary conditions of the model. The kinetic model simulates satisfyingly the overall experimental results using the minimal number of adjustable parameters (except for some reactions difficult to be experimentally isolated and studied). Keywords: polyamide, kinetic modelling, thermal oxidation, solid state polymerization 1 Corresponding author.
1. Introduction
The thermal oxidation of aliphatic polyamides has been widely studied to determine the oxidation products, the influence of temperature on reaction rate and the changes in mechanical properties [1,2,3,4]. In our previous paper on polyamide 11 thermal oxidation [5], we showed that chain scissions induced by oxidation radical chain reactions remained predominant over crosslinking for temperatures ranging from 90 to 165°C and oxygen pressure ranging from 0.02 MPa (ambient atmosphere) to 2.0 MPa, which is also observed during polyamide radio‐oxidation [6]. Since polyamide end groups remain reactive in the solid state, some condensation reaction namely solid state polymerization (SSP) is expected to occur as observed for example in the bulk of PA6 thick pieces [7,8].
It is now well documented that embrittlement is provoked by molar mass decrease linked to the chain scissions in amorphous phase and the subsequent chemicrystallization process [9], as observed for instance in polypropylene [10] or polyoxymethylene [11].
In comparisons with Nylon 6 and 66, there are only a few studies about the oxidation of long hydrocarbon backbone polyamide such as polyamide 11 and 12 [12,13,14,15,16,17], and even less about the elaboration of a kinetic model [18,19], while polyamide 11 is widely used in applications such as automotive (fuel lines, air brake systems,…) or oil and gas (flexible liners, gas pipes,…) due to the low moisture pick‐up, chemical resistance, flexibility and mechanical strength. The thermal resistance is determining for such applications therefore the elaboration of a kinetic model for lifetime prediction appears to be a valuable tool for polyamide producers. The oxidation of aliphatic polyamides is expected to display some common features, but the existing models mainly fail by neglecting some of the above mentioned phenomena (e.g. SSP) and/or the unsufficient level of model validation. Despite providing an excellent criterion of the model because their simulation requires a minimum number of adjustable parameters, data on the changes in hydroperoxide concentration in thermally oxidized polyamides are scarce or even missing [20]. Here, it will be considered that the kinetic model is valid not only if it simulates the changes in stable oxidation product (carbonyls) and intermediate species (hydroperoxides) but also the changes in the macromolecular architecture (chain scission, SSP and crosslinking).
Such a model requires the use of several kinetic parameters. It might be possible that several sets of rate constants could simulate the experimental results with an equivalent accuracy. It tackles the
issue that the final set is both unique and displays physically reasonable values for each parameter. Some of the kinetic parameters for initiation and propagation are expected to have almost the same value for model amides and aliphatic polyamides [21]. It remains to determine termination rate constants, which is more intricate because:
‐ The value of rate constants for reactions involving two radicals strongly depends on macromolecular mobility [22,23] (and hence are significantly different between model amides and polyamides),
‐ In principle, the rate constant values for terminations: P● + P●, P● + POO●, POO● + POO● can only be determined from investigations on the effect of oxygen pressure on oxidation rate [24]. A first raw estimation was done in our previous paper [5] but the final numerical solution remains to be done. The present paper is hence aimed at:
‐ Collecting the additional set of experimental data required for an entire validation of the kinetic model and in particular, by investigating hydroperoxide concentration changes under various oxygen pressures. ‐ Inspecting the absence of Diffusion Limited Oxidation (DLO) [25,26]. If the non DLO is established experimental results and simulations can be compared. ‐ Checking the reliability of data at our disposal by comparing continuous monitoring of oxidation by in situ FTIR measurements and discontinuous one (conventional FTIR spectra of aged samples). ‐ Simulating the experimental data at our disposal by employing the whole set of rate constants. 2. Experimental
The samples were 70‐µm thick unstabilized polyamide 11 films. In order to investigate oxidation profiles, 1‐mm polyamide 11 plaques were molded at 240 °C by microinjection molding (KAP Inserject® 16/10 designed by Rheo Art [27]) into a mold maintained at ambient temperature. The plaques were arranged in an air ventilated oven XUO 32 (France Etuves) thermostated at 110 °C, and removed every 100 hours for analyses. All the samples were dried overnight under vacuum at 50 °C prior to exposure. The samples were characterized by infrared (IR) spectroscopy and size exclusion
chromatography (SEC) as described in our previous article [5]. They were aged under « ambient air » (PO2 = 0.02 MPa) or enhanced oxygen pressure (PO2 up to 2.0 MPa). 2.1. In situ IR (Infrared) spectroscopy Many articles about polyamide oxidation highlight the absence of induction period [1,3,28,29] and it was shown in our previous article that initial rate corresponds to the so‐called steady state oxidation rate [5]. This singular behavior points out the importance of having an accurate oxidation monitoring at the first time of exposure. In situ IR measurements appeared to be a relevant technique to follow carbonyl build‐up at the early stage of oxidation.
The in situ IR disposal is a Harrick high pressure/high temperature demountable cell provided by EuroLabo. The cell is designed with a slide plate facilitating its disposition in the Spectrum Two IR spectrometer (PerkinElmer). After thickness measurement with a length gauge, film sample is sandwiched between 13 mm diameter ZnSe optical windows with an optical path length of 6 mm. A 750‐µm path length Teflon® spacer was placed between the sample and one ZnSe window for gas circulation inside the cell. To perform isobar experiments the cell was connected to a gas system consisting of an Alphagaz gas bottle (air, N2 or O2 provided by Air Liquide) equipped with a pressure regulator. The temperature was controlled by a thermocouple disposed inside the body of the cell and two cartridge heaters perform the heating. The time‐dependent IR measurements were controlled by the Spectrum TimebaseTM software (PerkinElmer) to perform one spectrum each 10 minutes for exposure durations between 70 and 100 hours. The IR spectra were obtained from 32 averaged scans with 4 cm‐1 resolution. The time resolved profiles were directly processed inline by TimebaseTM. Fig. 1 displays an enlargement in the carbonyl area for some in situ IR spectra; the sample was continuously exposed under oxygen (1.0 MPa) at 110 °C.
Figure 1. IR spectra in the carbonyl area during in situ exposure of PA11 film sample (1.0 MPa of oxygen at 110 °C) and the arrows schematize the increase of the absorbance in carbonyl area during oxidation for the main oxidation products detected in [5]). 2.2. IR microscopy
The oxidation profiles were investigated from 40‐µm microtome specimens of oxidized PA11 plate using a rotary microtome LEICA RM 2255, the angle of the titanium knife was about 45 ° and the specimens were cut in the cross‐section. The micro‐IR analyses in transmission mode were performed on the SpotlightTM 300 FTIR microscope (PerkinElmer) fitted with a MCT 100×100 detector cooled with liquid nitrogen. A motorized x‐y sample stepper was controlled by SpectrumIMAGETM software (PerkinElmer) for automatic scanning across the surface of the microtome cut sample. The spectra were done with an accumulation of 16 scans at a resolution of 4 cm‐1 and the path across the section was 20 µm. The collected spectra were then analyzed using Spectrum 10TM software (PerkinElmer).
2.3. Hydroperoxide titration
Contrarily to polyolefins or polystyrenic polymers, PA hydroperoxides could not be determined by studying the IR spectra at about 3400 cm‐1 [30,31,32,33] because of partial overlap of N‐H bonded band (3301 cm‐1), νOH and N‐H free [34,35]. The chemical titration method was initially proposed by Petrůj et
al [36]. Roger and Lemaire used this technique to titrate some aliphatic polyamide hydroperoxides [13,14,37,38]. 10 mg of PA11 films were placed in 10 mL flask and 2 mL of hexafluoroisopropanol
(HFiP). After the total dissolution of the sample 4 mL of an acidified solution of methanolic ferrous ammonium sulfate (10‐2 mol L‐1) was added, followed by the addition of 4 mL of a methanolic solution of ammonium thiocyanate (2 10‐1 mol L‐1). The color of the solution turned from transparent to light rose. The mixture was gently swirled and allowed to rest in the dark for 30 minutes then filtered on Acrodisc CR PTFE 0.2 µm (Pall Light Sciences) before UV‐Vis analysis (Lambda 25 ‐ PerkinElmer). Hydroperoxide concentration was calculated from the absorption of ferric thiocyanate complex at 503 nm with = 16800 L mol‐1 cm‐1.
3. Results
3.1. Polyamide aged under inert atmosphere
Solid State Polymerization (SSP) experiments were performed on 100 mg PA11 sample placed in a 30 cm3 vessel purged by nitrogen (N2). It can be shown that reverse hydrolysis is negligible compared to SSP at early exposure time and does not induce any underestimation of SSP rate constant noted kR. Fig. 2 displays the kinetics of changes of average molar mass (measured by SEC) for some N2 heated samples together with their best simulations. Figure 2. Molar mass changes (symbols) and SSP numerical simulation (lines) for PA11 film samples aged under N2 (0.5 MPa) at 150 °C.
The increase of molar mass during inert atmosphere exposure suggests the occurrence of post‐ polycondensation (namely SSP for solid state polymerization). As expected for a bimolecular process, the curves display a hyperbolic shape with pseudo‐asymptotic Mn and Mw values corresponding theoretically to the total consumption of the end group in lowest concentration. This trend is in accordance with the reported SSP process for PA6 [39,40,41].
Samples aged under N2 were also analyzed by FTIR. The IR spectra did not reveal any change apart from the slight apparition of the band at 1734 cm‐1 after 2 hours suggesting the formation of imides from the decomposition of the tiny amount of POOH initially present after processing (see “APPENDIX”).
3.2. Polyamide degradation in the presence of oxygen
3.2.1. Oxidation of thick materials under air
In the case of films having a thickness lower than 100 µm, it is often said that oxidation is homogenous across the thickness which was verified for polyolefins or elastomers for example [42,43]. Homogeneous oxidation allows using a simplified version of the kinetic modeling without diffusion ‐ reaction coupling [44]. However, this remains to be checked for polyamides being much more oxidizable materials than polyolefins (and thus displaying a sharper oxidation profile). One option to validate this hypothesis is to analyze the changes in IR spectrum across the cross‐section of aged thick plaques (1 mm) and determine carbonyl concentration from the surface to the core. Fig. 3 presents the carbonyl area (1830‐1680 cm‐1) of IR spectra across the thickness for a 900‐hour air aged sample at 110 °C (Fig. 3a) and the carbonyl build up from the surface to the core is shown for several times of exposure at 110 °C (Fig. 3b). Figure 3. IR spectra in carbonyl area across a sample aged 900 h under air at 110 °C (a) and the carbonyl build as a function of aging time across the section of aged samples under air at 110 °C (b). It appears clearly from Fig. 3a that the IR spectra remains unchanged whether it is at the surface or at the core of the sample. Fig. 3b shows that the carbonyl level remains constant through the thickness of the sample within the experimental uncertainty thus justifying the absence of oxygen diffusion limitation at this low aging temperature and at low conversion across the 1‐mm plaque. These results
are in good accordance with the observations of Ahlblad et al on the investigation of oxidation profiles of PA66 during thermal oxidation [45]. In fact, the oxidation depth was approximately 0.4‐0.5 mm at 110 °C and 0.2‐0.3 mm at 130 °C under air. 3.2.2. Oxidation of thin films under air The carbonyl build up from in situ IR measurements and conventional IR ones between 110 and 150 °C under air is shown in Fig. 4. In situ IR and “classical” IR measurements overlap pretty well over all the investigated timescale and allow an accurate monitoring of carbonyl build up at the earlier exposure time and thus a precise assessment of the initial oxidation rate (Fig. 4). Last, overall data confirm the absence of induction period for carbonyls. Because of the high instability of polyamide hydroperoxides, it was compulsory to use a method we could perform at room temperature which is the case of ferric complex titration [46]. This method is only reliable when the polymer is totally soluble in the solvent [33] and it was fortunately the case for PA11 in HFiP. The changes in hydroperoxide concentration during air aging at 110 °C are presented in Fig. 5. The initial hydroperoxide concentration [POOH]0 is about 30 mmol L‐1 (± 5 mmol L‐1), which is consistent with Lemaire et al titration on PA11 sample with [POOH]0 ~ 20 mmol L‐1 [34,35]. Hydroperoxide concentration undergoes a fast decrease at the first stage of exposure (until 24 hours) then it reaches an asymptotic value (~ 15 mmol L‐1). This trend suggests that POOH groups are simultaneously formed and destroyed but, in the conditions under study, their initial concentration is higher than the steady state concentration, this latter being determined by oxidation kinetics.
Figure 4. Carbonyl build up from in situ IR and classical IR measurements from [5] under air between 110 °C and 150 °C.
Figure 5. Changes of hydroperoxide concentration at 110 °C under air.
The analysis of samples exposed during 48 h under N2 prior to ageing under air (see “APPENDIX”) showed a slight shift of curves towards longer exposure times. Those results militate in favor of: ‐ the quasi absence of a direct thermolysis reaction of polymer chain generating radicals. Those latter would actually induce a higher oxidation rate for samples having undergone an isothermal treatment under nitrogen [16] which is contrary to experimental results. ‐ the thermolysis of hydroperoxides generated during processing (expressed by the [POOH]0 value in our kinetic model, see later). It explains the shift of carbonyl build up curve toward longer exposure times for the sample thermally treated under N2 (see ‘APPENDIX’) and partially confirms the major role of POOH in thermal oxidation.
3.2.3. Oxidation of thin films under high oxygen pressure In situ IR experiments were also performed under oxygen pressure between 0.3 and 1.0 MPa at 110 °C and the results are presented in Fig. 6a together with “conventional” IR data [5]. Overall results confirm that the rate of carbonyl build up increases with oxygen pressure. Hydroperoxide titrations are presented in Fig. 6b for PA11 film samples aged under oxygen (0.5 and 1.6 MPa) at 110 °C. The fast increase of hydroperoxide concentration (within the first 5 hours) at the beginning of the exposure is then followed by a slight decrease. The maximal concentration depends on oxygen pressure: [POOH]max ~ 45 mmol L‐1 at 0.5 MPa and about 60 mmol L‐1 at 1.6 MPa (110 °C). The results suggest that the steady state of POOH concentration [POOH] is an increasing function of oxygen pressure, it is higher than the initial value at the oxygen pressures under study that explains the initial increase of [POOH] which tends towards its steady state value. This latter depends however of the concentration of PA11 oxidizable sites, namely PH, and their consumption explains the slight final decrease of POOH concentration [47]. In the following, the kinetic model will help to discuss the reliability of this hypothesis. Figure 6. Carbonyl build up from in situ IR and classical IR measurement from [5] at 110 °C between 0.21 and 1.0 MPa O2 (a) and hydroperoxide concentration from sample aged at 110 °C under 0.5 and 1.6 MPa O2 (b).
4. Discussion
4.1. Kinetic modeling of PA11 solid state polymerization
One distinctive feature of polyamides, contrarily to polyolefins, is the fact that the remaining reactive end groups can react in the solid state when temperature is above the glass transition that favors their mobility.
-COOH
-NH
2 kP-CONH-
H
2O
kH
kP and kH are the rate constants respectively associated to condensation and hydrolysis. The condensation is usually assumed to be favored over hydrolysis because in the absence of an external source water is in low concentration and is rapidly eliminated by evaporation at this temperature.
Since solid state polymerization affects molar mass changes which is also related to chain scission, the kinetic model has to take into account this characteristic in order to predict time to embrittlement. Literature reports SSP kinetic models that generally rely on simple power laws [17,48,49] or on Flory principles [50, 51] related to the intrinsic reactivity of end groups. We have chosen to use the kinetic approach usually taken to describe oxidation kinetics to model the SSP kinetics. The amide build‐up is described by the following differential equation: (1) And the consumption of end groups is as follows: (2) Hence: ∙ (3) ∙ (4)
The initial end group concentrations determined by proton nuclear magnetic resonance (not detailed here in sake of simplicity) are: [NH2]0 = 0.038 (± 0.005) mol L‐1 and [COOH]0 = 0.058 (± 0.005) mol L‐1. The numerical resolution of the differential equations was performed with the ode23s solver of MatLab® and the SSP rate constant kP was determined by the numerical reverse method.
The simulation of experimental data during the SSP at 150 °C is presented in Fig. 2 for molar mass changes (Mn and Mw). Fig. 7 displays the corresponding simulation of end group consumption and amide build up. The kinetic model simulates perfectly the experimental data and enables the prediction of the changes in reactive groups. The SSP rate constant is determined at 150 °C: kP ~ 6 (± 1) ∙ 10‐4 L mol‐1 s‐1. Figure 7. Simulation of PA11 SSP at 150 °C (N2): simulation of and the consumption of carboxylic acids [COOH] and amine [NH2] and amide build up [CONH].
The order of magnitude of SSP activation energy (Ea) is determined from an Arrhenius graph of kp values coming from our simulations (PA11 and PA6 [41]) and from literature data in Fig. 8. The approximate value Ea ~ 68 kJ mol‐1 was obtained.
Figure 8. Arrhenius plot of SSP rate constant kP :*[52], **[53], ***[54], ****[55] and simulation of the PA6 SSP from *****[41]. 4.2. Kinetic modeling of PA11 thermal oxidation From now on, it remains to make use of the experimental results to establish a kinetic model used for predicting rate of chain scission, crosslinking and SSP. Its validity is guaranteed by: ‐ The simulation of the main features of polyamide oxidation: here, molar mass decrease, carbonyl build‐up and POOH trends. ‐ The use of physically reasonable kinetic parameters (see ‘Introduction’).
The “classical” model (generally used for polyolefin oxidation) involves the following elementary steps:
(1u) POOH → 2P● + C=O PC=O + s chain scission k1u (1b) POOH + POOH → P● + POO● + C=O PC=O + s chain scission k1b
(2) P● + O2 → POO● k2
(3) POO● + PH → POOH + P● k3
(4) P●+ P● → inac ve products k4 (5) P● + POO●→ inactive products k5 (6) POO● + POO●→ inac ve products + O2 k6
In this paper, this scheme will be adapted for describing some specificities of polyamide thermo‐ oxidative aging. We will also attempt to explain the values of kinetic parameters used for the simulations at 110°C (corresponding at temperature at which most of the experimental data were obtained), 90 and 130 °C (for the other experimental results at disposal [5]). Let us also insist on the fact that the model envisaged here is aimed at simulating the degradation course at low conversion and low temperature contrarily to data of high temperature degradation of PA6 for example [56]. 4.2.1. Initiation
‐N‐Hydroperoxides (POOH) are known to be destabilized by the electron withdrawing effect of amide group and they possibly decompose by a unimolecular process with a relatively high rate constant consistently with the observation of Sagar [57]. Initiation rate constant can be theoretically determined from:
‐ The length of induction period, ‐ The maximal level of hydroperoxides,
‐ The decay of hydroperoxides during thermolysis experiments.
Data of hydroperoxide decay during thermolysis is from far the best but unluckily very scarce. The kinetic analysis of Arnaud et al [58] results confirmed the first order kinetics of PA11 hydroperoxides decomposition. A possible value at 110°C was estimated at ca 5.0 10‐5 s‐1 (see Table 5 in ref [21]).
4.2.2. Propagation
The propagation rate constants of this model will be here supposed to display some common characteristics with previously studied cases (namely polyolefins and hydrocarbon elastomers [24,42,44,59]):
k2 corresponds to the reaction of a very reactive alkyl radical P● and the diradical oxygen molecule. The value of the propagation rate constant k2 is usually high in our kinetic models (k2 ~ 107‐108 L mol‐1
s‐1) without any experimental mean to measure it accurately. The best simulations obtained for PA11 were ran with k2 = 106 L mol‐1 s‐1. k3 is expected to mainly depend on BDE(C‐H) (the Bond Dissociation Energy of the C‐H bond reacting with POO●). Since this latter is significantly lower for ‐N‐methylene namely ‐N‐C‐H (< 360 kJ mol‐1) than for other methylenes (ca 390‐395 kJ mol‐1), the ‐N‐C‐H is expected to be the main reactive site in aliphatic polyamides and they correspond to PH in our model. According to our previous work [5]: exp 19.517 exp (5) The concentration in ‐N‐C‐H is given by: (6)
Where MU is the molar mass of repetitive unit of PA11 (0.183 kg mol‐1) and PA11 the density of PA11 amorphous phase (1.013 kg L‐1). Thus, in the case of PA11 before oxidation, the initial substrate concentration is [PH]0 = 5.5 mol L‐1. 4.2.3. Terminations k6 can be determined from the oxidation rate value or the maximal POOH value under oxygen excess conditions at which numerical and analytical solution converge [24] where one actually has: ² ² (7)
The plot 1/rOX vs 1/[O2] enables to determine rOX MAX and (Fig. 9):
∙ ∙ (8)
With Fig. 9, we find: 1/rOX MAX = 122432. Hence, rOX MAX = 8.17 ∙ 10‐6 mol L‐1 s‐1 at 110 °C.
Hence, k6 can be approximated: k6 ~ 3000 / 8.2 10‐6 ~ 3.5 108 L mol‐1 s‐1.
Figure 9. 1/rox vs 1/[O2] plot at 110 °C.
k5 is also theoretically unknown, but termination rate constant values of k4 ,k5 and k6 can be determined from simulations of the oxidation rate under several oxygen pressures, in particular the ratio k6/k5 which can practically be estimated from the value of the critical oxygen pressure i.e. the pressure at which oxidation rate reaches a plateau. An approximate analytical solution gives [60,61]: (9) In Fig. 8. , the slope is: 1/(∙rOX MAX) = 988.7 s so ~ 120 l mol‐1. can alternatively be determined from the steady state concentration in POOH since one has for unimolecular mode [62]: (10) ∙ ∙ (11) where:
‐ [O2] is the concentration of oxygen dissolved in amorphous phase of polyamide. [O2] = SO2 × PO2, with SO2 being close to the value used in PE or in PA6 i.e. here SO2 = 1.8 ∙ 10‐8 mol L‐1 Pa‐1 [63].
‐ [POOH]s is the “asymptotic” (actually the steady state) concentration of [POOH] at the considered oxygen concentration [O2]. Here, in air at atmospheric pressure: [POOH]s ~ 0.015 mol L‐1.
‐ [POOH]s excess O2 is the “asymptotic” (actually the steady state) concentration of [POOH] under oxygen excess. Here: [POOH]s ~ 0.06 mol L‐1 (see Figure 6).
Hence, ~ 925 L mol‐1.
The first method of assessment is based on the analysis of the initial (maximal) rate of carbonyl build up measured from FTIR. The main causes of uncertainty are: the possible overlapping of various carbonyl products that complicates the analysis of FTIR data, the choice of molar absorptivity values for each product, and the possible presence of volatile compounds.
The second method of calculation is based on the level of POOH being in relatively low concentration. The maximal value [POOH]s excess O2 value used in Eq. 10 and Eq. 11 (0.06 mol L‐1) is possibly underestimated because of partial substrate consumption, experimental uncertainty on the method for POOH titration etc …
Hence, it justifies at least partially the difference between the two values of . Moreover, is actually the combination of four rate constants. Despite the uncertainty on value, it makes possible a first estimation of the order of magnitude of k5 which is the unknown rate constant in Eq. 9 using k3[PH] = 55 s‐1 and k6 ~ 3.5108 L mol‐1 s‐1 (see above) and assuming k2 = 106 L mol‐1:
k5 ~ 7 109 ‐ 5 1010 L mol‐1 s‐1.
Then, k4 is expected to obey a classical relationship: k4 ~ k5 > k6 since alkyl radicals are much more reactive than peroxy ones. Let us also mention that the rate constants cannot in principle exceed the physical limit of 109 L mol‐1 s‐1 even if sometimes the determination slightly exceeds this threshold [64,65,66,67].
4.2.4. From the “classical” scheme to PA11 oxidation scheme
As previously said, one of the requirements of the model is to simulate the changes in imide concentration. According to Arnaud et al [56], the thermolysis of POOH mainly yields imides but, according to [5], imides represent 2/3 of overall carbonyl species irrespectively of oxygen pressure. Understanding the origin of this difference is of crucial importance for our kinetic model aimed at predicting the residual engineering properties of polymers submitted to thermal aging. Those two facts can be reconciled by considering the following expression of the mechanistic scheme valid under oxygen excess where imides are formed from:
Decomposition of POOH, which is described by the following in chain sequence of reactions: POOH PO● + HO●
HO● + PH P● + H2O 1 – 1
(PO● + HO●)cage imide + H2O 1
PO● + PH hydroxyamide (‐CO‐NH‐CHOH‐CH2‐) + P● 2
PO● aldehyde + P● 3
Hydroxyamides are unstable and they will yield to aldehydes. Both sorts of aldehydes produced from PO● + PH reaction or PO● direct ‐scission will then be oxidized in carboxylic acid observed by FTIR and SEC for chain scission so that:
POOH 1imide + 2(1‐1)P● + (2+3)carboxylic acids+ (2+3) chain scission
Termination POO● + POO● yielding a pair of PO● in cage that disproportionates:
POO● + POO● [PO● ●OP]cage imide + hydroxyamide imide +carboxylic acid + chain scission
The overall scheme is thus:
POOH 2(1‐1)P● + 1imide+ (1‐1)carboxylic acid + (1‐1) chain scission
P● + O2 POO●
POO● + POO● POOOOP imide + carboxylic acid + chain scission Assuming that imides are stable within the investigated timescale, the imide build up is given by: ● (12) 1 ● (13) The term 1 remains to be determined. Thus, under oxygen excess, the hypothesis of steady state gives: 2(1‐imide)k1u[POOH] = 2k6[POO●]²
The chain scission rate over the imide formation rate d[chain scission]/d[imide] is then: 2 2 (14) And since: d[chain scission]/d[imide] = d[COOH]/d[imide] ~ 0.5‐0.6 [5] then 1 ~ 0.70‐0.75. In other words, about 75 % of hydroperoxides yield to an imide, consistent with previous reports [37,57]. At moderate temperatures, imides may undergo hydrolysis [12‐15,37,38] which generates a supplementary chain scission. This reaction was neglected at the aging temperature (110°C).
When lowering the oxygen pressure, the termination between P● and POO● becomes competitive and even predominant over POO● + POO●. Two mechanisms can be a priori envisaged:
(5.1) P● + POO● POOP (coupling) (5.2) P● + POO● POOH + >C=C< (disproportionation) The disproportionation requires the abstraction of a hydrogen atom in position of the amide group. It seems it can be neglected for the same reasons based on difference in Bond Dissociation Energy as the propagation on hydrogen in or position. However, it remains to elucidate what these formed dialkylperoxides will become. According to [5], the ratios chain scission/imide and carboxylic acids/imides remain unchanged with oxygen pressure i.e. with irrespectively of the relative proportion of POO● + POO● and P● + POO● termination i.e. that both would generate imides and
carboxylic acids in the same proportion. The best explanation is that peroxides (POOP) are thermally unstable. A possible decomposition mechanism would be: POOP imide + hydroxyamide Or: POOP imide + carboxylic acid + chain scission kd1 According to Sagar [57], the rate constant of such a reaction would be slightly lower but very close to the value for the analogous hydroperoxide POOH. In the aim of simplicity, we will assume: kd1 = k1u.
The hydroxyamide and dialkylperoxide decompositions together with the alkoxy radical ‐scission generate random chain scission. In the case of an exclusive chain scission process, it can be shown that polydispersity index tends towards 2. However, the polydispersity index during PA11 thermal oxidation was observed to slightly increase meanwhile both Mn and Mw decrease. The explanation is the existence of a crosslinking phenomenon which is simultaneous with chain scission, the concentration in chain scissions being at least four times higher than crosslinks one (see Eq. 19 and Eq. 20).
Crosslinking is more noteworthy under air than under enhanced oxygen pressure atmosphere. Since the termination P● + P● tends to become predominant when oxygen concentration decreases towards 0, this observation suggests the species responsible for crosslinking would be alkyl radicals P●. Those latter can actually react: ‐ By disproportionation: P● + P● PH + >C=C< ‐ By coupling leading to crosslinking: P● + P● crosslinking In the absence of any quantitative information, we will consider that the yield of crosslinking g4 is an adjustable parameter (see equation 17).
Carboxylic acids (coming from hydroxyamide decomposition or initially present as unreacted chain ends) can react with free amine chain ends by SSP with an opposite effect to chain scission:
The order of magnitude of the rate constant of this reaction was estimated from papers dealing with the reversible hydrolysis of polyamide 11 [52]. However, the value to be used here in simulation can differ, in particular because of differences in catalysts systems used for polymer synthesis.
4.3. Simulation of experimental data
The numerical simulation approach is briefly described to skip the mathematical part published elsewhere [59,60]. The kinetic scheme was converted into a set of differential equations and these ones were numerically solved using the kinetic parameters recalled earlier in this article. The differential equations were resolved with MatLab® ode23s solver. Temperature and oxygen pressure are the input data of the kinetic model together with the initial conditions: The initial conditions were: [POOH]0 = 0.03 mol L‐1 ; [PH]0 = 5.5 mol L‐1 ; [P●]0 = [POO●]0 = 0 ; SO2 = 1.7 ∙ 10‐8 mol L‐1 Pa‐1 and XC = 0.22. Output data are the concentration of the reactive species: P●, POO●, POOH, POOP... from which a post treatment allows the simulation of stable product build ‐ up. For example: 1 ● ² (15) 1 (16) 1 ∙ ● ² (17) 1 (18) XC being the crystalline ratio. In other words, the term 1 – XC permits the calculation of the “overall” oxidation level in a semi‐crystalline polymer (to be compared with experimental measurements by FTIR for example) from the oxidation level in amorphous phase simulated by the model. 4 is the yield in crosslinking from P● + P● termination (see above). And the averaged molecular molar masses can also be estimated from the Saito’s relationships: (19) 2 (20)
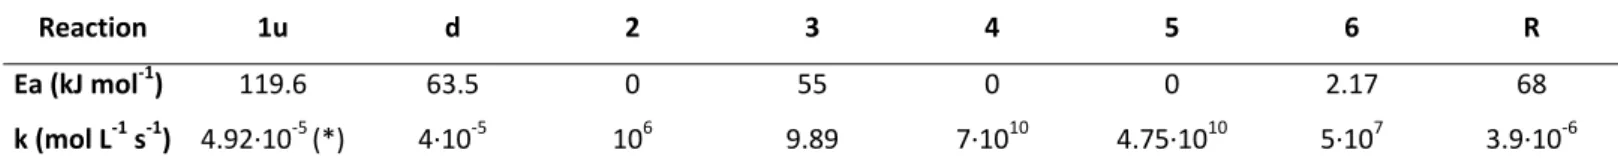
The experimental data (symbols: carbonyl build up, hydroperoxide concentration and molar mass changes) are plotted together with the kinetic model simulation (lines) at 110 °C under air and under oxygen (1.6 MPa) in Fig. 10. The value of the rate constants (of which values are equal or close to the estimations presented in the previous paragraphs) used for the simulation is given in Table 1 and the imide and the crosslinking yields were without temperature dependency: 1=0.77 and 4 = 0.05. Reaction 1u d 2 3 4 5 6 R Ea (kJ mol‐1) 119.6 63.5 0 55 0 0 2.17 68 k (mol L‐1 s‐1) 4.92∙10‐5 (*) 4∙10‐5 106 9.89 7∙1010 4.75∙1010 5∙107 3.9∙10‐6 Table. 1. Rate constants used for the simulation and determined by the numerical reverse method at 110 °C (except for k3 and kR) and the initiation rate constant k1 is in s‐1 (*) with d being the
decomposition of hydroxyamide and R the solid state polymerization during oxidation.
Figure 10. Simulation of experimental data at 110 °C under air and oxygen excess (1.6 MPa): Carbonyl build up (a), changes in hydroperoxide concentration with a dashed line corresponding to a
simulation that does not take into account the consumption of PH (b) and molar mass changes Mn (c) and Mw (d).
The results call for the following observations:
‐ Even though it seemed illusive the experimental constraints to be respected, the rate constants mainly complied with the physical constraints by the realistic hierarchy: k4 ~ k5 > k2 > k6 >> k3.
‐ The kinetic model generates satisfactory simulation for POOH concentration. To our knowledge, such kinetic model capable of simulating POOH concentration changes and carbonyl build up changes during polyamide thermal oxidation does not exist in literature. Because POOH are primary oxidation products they do not depend on any adjustable parameter which is not the case of carbonyl concentration that relies on 1. Therefore, the success of the simulation of POOH build‐up guarantees the validity of the model.
‐ The presence of a slight shift between simulation and experimental data is observed especially for the determination of [POOH]MAX under oxygen excess which is partially explained by the high instability of hydroperoxides.
‐ In Fig. 10, one simulation (dashed red line) was performed without PH consumption during PA11 oxidation at 110 °C under oxygen excess (1.6 MPa). It is noteworthy that the kinetic model simulates the decrease of POOH after [POOH]MAX (red line) by taking into account the consumption of the oxidation reactive site PH.
By determining the activation energies of all chemical reactions (Table. 1), the kinetic model simulates the experimental data at different temperatures (Fig. 11). Once again, the simulations generated are satisfactory confirming the promising kinetic model in predicting the polyamide durability.
Figure 11. Simulation (lines) of experimental data (symbols) under air at different temperature (90‐ 130 °C): carbonyl build up (a) and molar mass changes (b).
5. Conclusions
The classical kinetic model of thermal oxidation which was mainly implemented in the case of polyolefins up to now has been adjusted for PA11 thermal oxidation in the present article. It showed a good capability of simulating the changes at molecular level (carbonyl build up, POOH concentration), and at macromolecular one, taking into account oxidation events (chain scission and crosslinking) as well as solid state polymerization. It is noteworthy that [POOH] and average molar masses can undergo non monotonic variations depending on oxygen pressure. The model is able to simulate all these changes.
The absence of induction period for POOH and carbonyls kinetics can be attributed to the predominance of unimolecular initiation together with a relatively high value of rate constant of POOH decomposition. However, this intrinsic polyamide instability is partially compensated by the low yield of chain scission from POOH (~ 25%) and the occurrence of solid state polymerization reducing, at least temporarily, the drop of the molar mass, so that polyamide 11 can retain its mechanical properties at failure. By coupling the present model that simulates the molar mass changes whatever the exposure conditions and a physical criterion governing the ductile‐brittle transition as a function of molar mass, it will be possible to predict time to embrittlement.
Acknowledgements
Many thanks are addressed to ARKEMA’s experts for their valuable assistance in bringing out this article: Florence Churlaud, Christophe Degoulet and Frédérique Pery and to PIMM laboratory technical engineering for the microinjection moulding: Paulo Ferreira and Jerome Heiligenstein (Rheo Arts). French “Agence Nationale de la Recherche et de la Technologie” and ARKEMA are gratefully acknowledged for financial support.
Appendix: on the thermolysis of hydroperoxydes under inert atmosphere
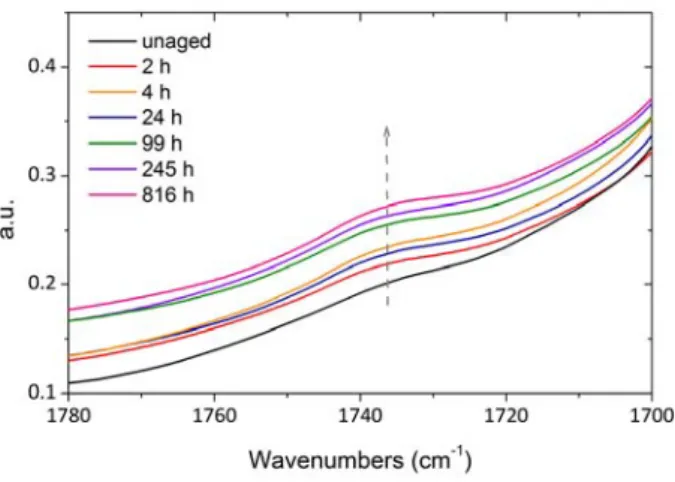
Fig. 12 depicts the changes of FTIR spectra in the carbonyl region for samples exposed under inert atmosphere. Figure 12. IR spectra (carbonyl area) for PA11 film samples aged under N2 (0.5 MPa) at 150 °C. The IR spectra did not reveal any change apart from the slight apparition of the band at 1734 cm‐1 after 2 hours suggesting the formation of imides [12] from the decomposition of the tiny amount of POOH initially present after processing. Some samples were exposed under N2 prior to ageing under air. Fig. 13 displays the carbonyl build ‐ up ascertained from the imide absorption band at 1734 cm‐1 as described in our previous article [5] for sample aged at 110 °C under air with or without exposure under N2 atmosphere (0.8 MPa N2 at 110 °C).
Figure 13. Carbonyl build up for samples aged at 110 °C: under air for in situ IR measurements (), and under air after 48 h under N2 at 110 °C ().
It seems that this “thermolysis” treatment involves a possible shift of carbonyl build up curves towards the longer exposure times. For example, the time to reach [carbonyl] = 0.02 mol L‐1 is ca 20 h for the untreated sample versus ca 30 h for the treated one. After an exposure duration equal to 100 h, carbonyl concentration is ca 0.055 mol L‐1 for untreated sample versus 0.045 for the sample treated under N2 atmosphere. In the case of PA12, Tcharkhtchi et al [16] observed that this initial oxidation rate depends on the exposure time at temperatures higher than 180°C under inert atmosphere prior to oxygen exposure, thus suggesting a possible initiation by direct polymer thermolysis. In the case of ageing at moderate temperature (here 110°C), the initial slope appears to be relatively low for the N2 exposed sample in comparison to the unexposed one (Fig. 11). This observation militates in favor of neglecting the direct thermolysis suggested by [16]. On the contrary, the initial amount of unstable species likely to initiate oxidation (POOH for example) seems to decrease during N2 exposure thus shifting the curves towards long times.
References
[1] Cerruti P, Carfagna C, Rychly J, Matisová‐Rychlá L. Chemiluminescence from polyamide 6,6. I. The oxidation of pure polyamide. Polym Degrad Stab 2003;82:477‐485.
[2] Forsström D, Terselius B. Thermo oxidative stability of polyamide 6 films. I. Mechanical and chemical characterisation. Polym Degrad Stab 2000;67:69‐78.
[3] Dong W, Gijsman P. Influence of temperature on the thermo‐oxidative degradation of polyamide 6 films. Polym Degrad Stab 2000;95:1054‐1062.
[4] Forsström D, Reitberger T, Terselius B. Thermo‐oxidative stability of polyamide 6 films. II. Chemiluminescence techniques. Polym Degrad Stab 2000;67:255‐261.
[5] Okamba‐Diogo O, Richaud E, Verdu J, Fernagut F, Guilment J, Fayolle B. Molecular and macromolecular structure changes in polyamide 11 during thermal oxidation. Polym Degrad Stab 2014;108:123–132
[6] Lyons BJ, Glover Jr LC. Radiolytic crosslinking and chain scission in aliphatic and alkyl‐aromatic polyamides Part I. Radiat Phys Chem 1990;35(1‐3):139‐147.
[7] Vasil’ev VA, Kudrjavtseva GA, Pavlov NN. Inhomogeneous thermo‐oxidative degradation during heat of aliphatic polyamides in bulk. Polym Sci USSR 1986;28(10):2373‐2376.
[8] Pavlov NN, Kudrjavtseva GA, Abramova IM, Vasiljeva Va, Zezina LA, Kazaryan LG. Structural and chemical changes in aliphatic polyamides during artificial ageing. Polym Degrad Stab 1989;24:389‐397.
[9] Fayolle B, Richaud E, Colin X, Verdu J. Review: degradation‐induced embrittlement in semi‐crystalline polymers having their amorphous phase in rubbery state. J Mater Sci 2008;43(22):6999‐7012.
[10] Oswald HJ, Turi E. Deterioration of polypropylene by oxidative degradation. Polym Eng Sci 1965;5:152‐158.
[11] Fayolle B, Verdu J, Bastard M, Piccos D. Thermooxidative ageing of polyoxymethylene Part 1: Chemical Aspects. J Appl Polym Sci 2008;107( 3):1783‐1792. [12] Tang L, Sallet D, Lemaire J. Photochemistry of polyundecanamides. 1. Mechanisms of photooxidation at short and long wavelengths. Macromolecules 1982;15(5):1432–1437. [13] Tang L, Sallet D, Lemaire D. Photochemistry of polyundecanamides. 2. Titanium dioxide‐ and zinc oxide‐ photocatalyzed oxidation. Macromolecules 1982;15(5):1437–1441. [14] Roger A, Sallet D, Lemaire J. Photochemistry of aliphatic polyamides. 3. Mechanisms of photooxidation of polyamides 6, 11, and 12 at short wavelength. Macromolecules 1985;18(9):1771–1775. [15] Roger A, Sallet D, Lemaire J. Photochemistry of Aliphatic Polyamides. 4. Mechanisms of Photooxidation of Polyamides 6, 11, and 12 at Long Wavelengths. Macromolecules 1986;19:579‐584.
[16] Tcharkhtchi A, Audouin L, Tremillon JM, Verdu J. Oxyluminescence of polyamide 12. Polym Degrad Stab 1994;44:335‐341.
[17] Oliveira MJ, Botelho G. Degradation of polyamide 11 in rotational moulding. Polym Degrad Stab 2008;93:139‐146.
[18] Karstens T, Rossbach V. Thermo‐oxidative degradation of polyamide 6 and 66. Kinetics of the formation and inhibition of UV/VIS‐active chromophores. Makromol Chem 1989;190(12) 3033‐3053.
[19]El Mazry C, Ben Hassine M, Correc O, Colin X. Thermal oxidation kinetics of additive free polyamide 6‐6. Polym Degrad Stab 2013;93:22‐36.
[20] Richaud E, Farcas F, Fayolle B, L. Audouin, J. Verdu. Hydroperoxide build‐up in the thermal oxidation of polypropylene – A kinetic study. Polym Degrad Stab 2007;92(1):118‐124.
[21] Richaud E, Okamba‐Diogo O, Fayolle B, Verdu J, Guilment J, Fernagut F. Review: Auto‐oxidation of aliphatic polyamides Review Article. Polym Degrad Stab 2013;98(9):1929‐1939.
[22] Begum F, Zhao H, Simon SL. Modeling methyl methacrylate free radical polymerization: Reaction in hydrophilic nanopores. Polymer 2012;53(15):3238‐3244. [23] Olaj OF, Kornherr A, Zifferer G. Chain‐length dependent termination in pulsed‐laser polymerization, 2. On the prospects of determining the bimolecular termination constant kt from the second moment of the chain‐ length distribution. Macromol Rapid Comm 1997;18(12):997–1007.
[24] Richaud E, Farcas F, Bartoloméo P, Fayolle B, Audouin L, Verdu J. Effect of oxygen pressure on the oxidation kinetics of unstabilised polypropylene. Polym Degrad Stab 2006;91(2):398‐405.
[25] Gardette J‐L. Heterogeneous photooxidation of solid polymers. Makromol Chem 1995;232(1): 85‐103.
[26] Celina MC. Review article. Review of polymer oxidation and its relationship with materials performance and lifetime prediction. Polym Degrad Stab 2013;98:2419‐2429.
[27] www.rheoart.com
[28] Lánská B, Matisová‐Rychlá L, Brozek J, Rychlý J. Chemiluminescence of polyamides II. Luminescence accompanying thermooxidation of lactam‐based polyamides related to the content of end‐groups of molecules. Polym Degrad Stab 1999;66:433‐444. [29] Lánská B, Matisová‐Rychlá L, Rychlý J. Chemiluminescence of polyamides. I. Luminescence accompanying autooxidation of lactams and thermolysis of lactams hydroperoxydes. Polym Degrad Stab 1998;64:119‐127.
[30] Achimsky L, Audouin L, Verdu J. Kinetic study of the thermal oxidation of polypropylene. Polym Degrad Stab 1997;57:231‐240.
[31] Audouin L, Girois S, Achimsky L, Verdu J. Effect of temperature on the photooxidation of polypropylene films. Polym Degrad Stab 1998;60:137‐143.
[32] Sinturel C, Lemaire J, Gardette J‐L. Photooxidation of fire retarded polypropylene II. Photooxidation mechanism. Eur Polym J 1999;35(10):1783‐1790.
[33] Salvaggio M, Baggatin R, Fornaroli M, Fanutti S, Palmery S, Battistel E. Multi‐component analysis of low‐ density polyethylene degradation. Polym Degrad Stab 2006;91(11):2775‐2785.
[34] Thanki PN, Singh RP. Photo‐oxidative degradation of nylon 66 under accelerated weathering. Polymer 1998;39(25):6363‐6367.
[35] Gonçalves ES, Poulsen L, Ogilby PR. Mechanism of the temperature‐dependent degradation of polyamide 66 films exposed to water. Polym Degrad Stab 2007;92:1977‐1985.
[36] Petrůj J, Zehnacker S, Sedlář J, Marchal J. Trace determination of hydroperoxydes in LDPE by spectrocolorimetry. Polym Degrad Stab 1986;15:193‐204.
[37] Lemaire J, Gardette JL, Rivaton A, Roger A. Dual photo‐chemistries in aliphatic polyamides, bisphenol A polycarbonate and polyurethanes – A short Review. Polym Degrad Stab 1986;15:1‐13.
[38] Fromageot D, Lemaire J, Sallet D. Photo‐oxydation de polyamides aliphatiques N‐substitués par des groupements alkyles. Eur Polym J 1990;26(12):1321‐1328. [39] Griskey R, Lee B. Thermally induced solid‐state polymerisation in nylon 66. J Appl Polym Sci 1996;10:105‐ 111. [40] Srinivasan R, Desai P, Abhiraman AS, Knorr RS. Solid‐state Polymerization Vis‐&Vis Fiber Formation of Step‐ Growth Polymers. 1. Results from a Study of Nylon 66. J Appl Polym Sci 1994;53:1731‐1743. [41] Xie J. Kinetics of the solid‐state polymerization of nylon‐6. J Appl Polym Sci 2002;84:616‐621.
[42] Gutiérrez G, Fayolle B, Régnier G, Medina J. Thermal oxidation of clay‐nanoreinforced polypropylene. Polym Degrad Stab 2010; 95( 9):1708–1715.
[43] Celina MC. Review of polymer oxidation and its relationship with materials performance and lifetime prediction. Polym Degrad Stab 2013;98(12):2419‐2429. [44] Rincon‐Rubio LM, Fayolle B, Audouin L, Verdu J. A general solution of the closed‐loop kinetic scheme for the thermal oxidation of polypropylene. Polym Degrad Stab 2001;74(1):177‐188. [45] Ahlbad G, Forsström D, Stenberg B, Terselius B, Reitberger T, Svensson LG. Oxidation profiles of polyamide 6,6 studied by imagind chemiluminescence and FTIR. Polym Degrad Stab 1997;55:287‐293. [46] Gardette J‐L, Lemaire J. Advantages and limits of hydroperoxide titration methods in solid polymers. Polym Photochem 1986 ;7(5):409‐416. [47] Richaud E, Farcas F, Fayolle B, Audouin L, Verdu J. Hydroperoxide build‐up in the thermal oxidation of polypropylene – A kinetic study. Polym Degrad Stab 2007;92(1):118‐124.
[48] Griskey RG, Lee BY. Thermally induced solid state polymerization in Nylon 66. J Appl Polym Sci 1966;10:105‐111.
[49] Gaymans R, Amirtharaj J, Kamp H. Nylon 6 polymerization in the solid state. J Appl Polym Sci 1982;27:2513‐2526.
[50] Gaymans R. Polyamidation in the solid phase in Polymerization reactors and processes, J.N. Henderson, C.T. Bouton (Eds.), ACS Symp Ser (1979).
[51] Srinivasan R, Almonacil C, Narayan S, Desai P, Abhiraman A. Mechanism, kinetics and potential morphological consequences of solid‐state polymerization. Macromol 1998;31(20):6813‐6821. [52] Jacques B, Werth M, Merdas I, Thominette F, Verdu J. Hydrolytic ageing of polyamide 11.1 . Hydrolysis kinetics in water. Polymer 2002;43:6439‐6447. [53] Ledieu B. Vieillissement en milieu antigel du polyamide 66 renforcé. Fibres de verre courtes pour l'appliction. Boite à eau de radiateur de refroidissement moteur. Arts et Metiers ParisTech, 2010. [54] Duan P, Dai L, Savage PR. Kinetics and mechanics of N‐subsituted amide hydrolysis in high‐temperature water. J Super Fluids 2010;51:362‐368. [55] Arrieta C, David E, Dolez P, Vu‐Kkankh T. Hydrolytic and photochemical aging studies of Kevlar®‐PBI blend. Polym Degrad Stab 2011;96(8):1411‐1419.
[56] Von White II G, Clough RL, Hochrein JM, Bernstein R. Application of isotopic labeling, and gas
chromatography mass spectrometry, to understanding degradation products and pathways in the thermal‐ oxidative aging of Nylon 6.6. Polym Degrad Stab 2013;98(12):2452‐2465.
[57] Sagar BF. Autoxidation of N‐alkyl‐amides. Part II. N‐Alkyl‐amide hydroperoxides and di‐N‐alkyl‐amide peroxides. J Chem Soc B 1967:428‐439.
[58] Lemaire J, Arnaud R, Gardette J‐L. Low temperature thermo‐oxidation of thermoplastics in the solid state. Polym Degrad Stab 1991;33(2):277‐294.
[59] Coquillat M, Verdu J, Colin X, Audouin L, Nevière R. Thermal oxidation of polybutadiene. Part 2: Mechanistic and kinetic schemes for additive‐free non‐crosslinked polybutadiene. Polym Degrad Stab 2007;92(7):1334‐1342.
[60] Gillen KT, Wise J, Clough RL. General solution for the basic autooxidation scheme. Polym Degrad Stab 1995;47:149‐161.
[61] Wise J, Gillen KT, Clough RL. Quantitative model for the time development of diffusion‐limited oxidation profiles. Polymer 1997;38(8):1929‐1944.
[62] Achimsky L, Audouin, L, Verdu J, Rychlá L, Rychlý J. The effect of oxygen pressure on the rate of polypropylene oxidation determined by chemiluminescence. Eur Pol J 1999;35:557‐563.
[63] Hernandez RJ. Effect of water vapor on the transport properties of oxygen through polyamide packaging materials. J Food Eng 1994;22(1‐4):495‐507.
[64] Koenig SH, Brown RD. H2CO3 as Substrate for Carbonic Anhydrase in the Dehydration of HCO3‐. Proceedings
of the National Academy of Sciences of the United States of America 1972;69(9): 2422–2425. [65] Vana P, Davis TP, Barner‐Kowollik C. Easy Access to Chain‐Length‐Dependent Termination Rate Coefficients Using RAFT Polymerization. Macromol Rap Comm 2002;23(16):952‐956. [66] Bowry VW, Ingold KU. Kinetics of nitroxide radical trapping. 2. Structural effects. Journal of the American Chemical Society 1992;114:4992–4996.
[67] de Sainte Claire P. Degradation of PEO in the solid state: a theoretical kinetic model. Macromol 2009;42:3469‐3482.
![Figure 4. Carbonyl build up from in situ IR and classical IR measurements from [5] under air between 110 °C and 150 °C.](https://thumb-eu.123doks.com/thumbv2/123doknet/7435011.220132/11.892.294.644.111.350/figure-carbonyl-build-from-classical-measurements-under-between.webp)