Science Arts & Métiers (SAM)
is an open access repository that collects the work of Arts et Métiers Institute of Technology researchers and makes it freely available over the web where possible.
This is an author-deposited version published in: https://sam.ensam.eu Handle ID: .http://hdl.handle.net/10985/6693
To cite this version :
Mohammad Ali MIRZAEI, JeanRémy CHARDONNET, Christian PÈRE, Frédéric MERIENNE -Test-bench for evaluating navigation and interaction in large virtual databases - 2012
CONFERE 2012 VENISE
5 – 6 JUILLET 2012,SAN SERVOLO, VENISE
TEST-BENCH FOR EVALUATING NAVIGATION AND
INTERACTION IN LARGE VIRTUAL DATABASES
Mohammad Ali MIRZAEI, Jean-Rémy CHARDONNET, Christian PERE, Frédéric MERIENNE
Arts et Métiers ParisTech, CNRS, Le2i, Institut Image 2 rue Thomas Dumorey, 71100 Chalon-sur-Saône, France
ABSTRACT
3D systems due to its complicated electronical, mechanical and vision accessories have enormous degree of complexity both in design and evaluation. Navigation system usually plays an important role in most 3D systems. Therefore, having an efficient navigation system and evaluation of the system has great deal of importance. 3D systems have a lot of parameters, inputs and outputs thus; evaluation process requires a complete test bench to collect and analyse maximum possible efficient parameters and variables. This paper will propose a test bench based on a tracker, navigation device status, and some biological and motion feedback from end-user to analyse a 3D system and associated navigation system performance. An original test procedure will be provided for evaluating navigation in 3D scenes by focusing on experimental aspects such as metric variable definition for measurement, case selection criteria and test-bed design. The novelty in our approach is the use of information given by the brain to understand the human perception in VE and to improve navigation in 3D scenes and interaction with virtual reality.
Key words: 3D system, Navigation, Biological feedback, Test-bench
1 INTRODUCTION
With the rapid increase in performance of high-end computer graphics systems and the transition of 3D graphics onto fast and inexpensive PC platforms, virtual environment (VE) interfaces have become feasible enough to be practically used in areas such as building construction, art demonstration, industrial design, data visualization, training, and others [Gödel, 1996]. Development of useful VE applications, however, needs appropriate user interfaces in real environment and requires optimization of the most basic interactions, in particular navigation, and moving inside 3D, so that users can concentrate on high-level tasks rather than on low level motor activities [Stanney, 1995]. However, recently some cognitive issues have been emerged in VE such as motion sickness, and effect of different metaphors on end-users.
Currently, there is little understanding of how interaction interfaces should be designed to maximize user performance in immersive virtual environments [Mine, 1995]. Research that systematically investigates the human factors and design implications of immersive manipulation tasks, 3D devices, interaction metaphors and techniques remains sparse [Stanney, 1995, Durlach, 1995, Brooks, 1988]; consequently, VE designers have had to rely on their intuition and common sense rather than on the guidance of established theory and research results. However, as Brooks [Zhai, 1993] has noted, the uninformed and untested intuition for metaphor design is almost always wrong.
Although traveling is among the most important interactions in VEs [Herndon, 1994], we are not aware of any formal experimental studies that systematically evaluate and categorize interaction techniques for immersive traveling inside VEs. Prior research relates primarily to assessment of user performance as a function of the properties of input and output devices [Watson, 1997, Foley, 1984]. In contrast, the focus of this study is on the human factor aspects of different mappings between user input (captured by input devices) and resulting actions in VEs — i.e., interaction techniques [Herndon, 1994]. A lot of interaction metaphors and their corresponding devices have been proposed during last
Travel is the motor component of the navigation task of performing the actions that move us from our current location to a new target location or in the desired direction. In addition, watching specific part of a 3D scene from different perspectives is demanding in almost all the 3D applications [Göbel, 1996, Mine, 1995]. In the physical environment, travel is often a no-brainer, or to be more precise, it involves unconscious cognition. Therefore, it is quite crucial that 3D scene moves with the same (perceivable) speed as human. There are many different reasons why a user might need to perform a 3D travel task. Understanding the various types of travel tasks is important because the usability of a particular technique often depends on the task for which it is used.
After a short introduction of objective system and surveillance over different parameters of the system in section 2, we will introduce a taxonomy and generic metaphor definition for navigation in VEs in section 3. We will also introduce few devices to make the metaphor application more clear. Of course, since device selection is more application dependent it is not possible to introduce a generic device. As a result just few of them will be selected to demonstrate the task definition in practice. Test-bench for evaluation will be discussed in section 4. This section will be followed by a discussion around the test bench in section 5. The paper will be ended by conclusion and references.
2 3D SYSTEM PARAMETES IDENTIFICATION AND MEASUREMENT
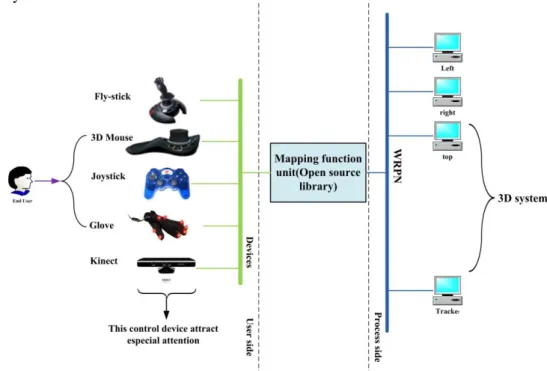
Figure 1 illustrates typical 3D environment (CAVE, car simulator, immersive room, etc.). 3D system almost will imply to 3D virtual reality in all the cases in this literature from now on. The environment consists of user in one side, 3D system at the other side, and navigation/interaction tools along with mapping interface. Therefore, three types of generic variables and parameters can be defined for this 3D environment:
- User
- Navigation/interaction tools (control devices and interfacing) - 3D system
Figure 1. Typical 3D system and its associate components
The movement process starts from stand still status by the user decision in the brain cortex. This signal will transmit to the navigation tool via neural system and muscular movement. After passing through mapping function the signal will be entered to the 3D system. To evaluate any interaction/navigation tools performance transfer function of navigation tools, feedback from user and 3D system are very important. Appropriate parameters and variable should be defined for evaluation in each part of 3D environment.
2.1 User
Biological feedback such as blood pressure, heart bit, brain signal (especially vision, sensation and movement, thalamus – for cyber sickness detection), pupil diameter, acceleration and speed of the user movement and totally some multi-sensory feedback (visual, vestibular, cardiac,…) have been considered by the researchers so far.
2.2 3D systems
The speed and acceleration of the 3D scene, frame rate of the images, delay between command and task initiation, scale of a 3D model, transportation delay of the images, size (number of the points)/resolution of the 3D model, lighting conditions, colour, contrast, accuracy for positioning can be measured in the 3D system side.
2.3 Control devices and infracting
Command duration, hardware/software adjusted resolution of scene movement, position tracking errors, DOF (degrees of freedom) of control devices, calibration of device and the system, tracker placement and orientation of the tracker are the most common interfacing parameters for measurement and evaluation.
Different control devices have their own extra parameter; however they have a lot of characteristics and parameters in common. Among control devices joystick, fly-stick, Kinect, gloves, 3D mouse and keyboard are very common.
3 NAVIGATION AND INTERACTION METAPHORS
By definition, metaphor is the way that a selected task is done. Traveling (navigation) is one of important tasks in virtual reality. Appropriate parameters and metaphors should be taken to do these tasks. A generic traveling and tracking metaphor can be well defined as follow;
The metaphor definition shows that departure, destination points, orientation and displacement with time (specifying position, velocity and acceleration) are the very basic parameters and variables of the generic traveling.
Traveling and manipulation metaphors can be explained in more detail. For example, the following velocity/acceleration definition elaborates more details on the traveling metaphor;
Not only target and traveling parameters but also navigation device mode is also important for the interaction. For example, stop and start button is used in some devices like joystick while in Kinect base application only the human gesture has control over the movement. Albeit, more flexible control
4 TEST BENCH
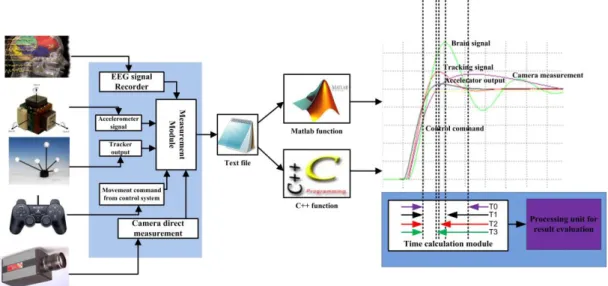
Figure 2 shows the evaluation test-bench of a navigation/interaction system. The test-bench will provide a test procedure for evaluating navigation in 3D scenes by focusing on experimental aspects such as metric variable definition for measurement, case selection criteria and test-bed design.
Performance criteria, i.e., completion time (the time taken to successfully accomplish each task) and perception time (the difference between command and end of 3D system movement) will be considered in this test-bench to develop an overall system that enables the shortest response time, thus the best navigation parameters. Subjective criteria, such as subject satisfaction, can be assessed through post-experimental questionnaires.
Parameters evaluation naturally leads to take into account human factors. Thus we will analyse the effect of several human criteria such as age, gender, ethnicity and personal characteristics on overall performance and motion sickness.
Figure 2. Navigation/interaction evaluation test-bench
Through the consideration of all these parameters, we will propose a new test bench for measurement and evaluation of tracking systems (see Figure 2). In fact in this test bench stimuli from navigation device (e.g., joystick), feedback from sensation/vision cortex (electro-encephalogram signal (EEG)), accelerometer and tracker signal can be measured to compare the amount of delay between each component from the other. These time differences (delay) between each pair of signals is a good metric for evaluation of tracker systems and also deducting some biological results such as motion sickness. Velocity of 3D movement and acceleration can be calculated by following a moving object (it is not necessarily an object; the object can be a patch in the image, for example a corner or an edge) in the sequence of images that were captured by OpenGL via virtual camera. However, if we measure direct data from 3D scene by an external camera it will help us to measure real acceleration of 3D movement and velocity independent from the virtual environment. Then these results can be compared with the motion information that we have already measured from the acceleration sensor. The difference of these two measurements leads to the evaluation of motion sickness.
Biological feedback plays an important role in this test bench. Since the brain signal can be used to extract information about the end user. Indeed, certain parts of the brain govern specific functions (see Figure 3). For example, the cerebellum is involved with coordination; the hippocampus with memory. Nerve cells (neurons) are the basic unit of communication in the brain. Information is relayed from one area of the brain to other areas through complex circuits of interconnected neurons. Information via electrical impulses transmitted from one neuron to many others is done through a process called “neurotransmission.” The visual cortex of the brain is the part of the cerebral cortex responsible for processing visual information. It is located in the occipital lobe, in the back of the brain (yellow area). The somatosensory system (blue area) is a diverse sensory system composed of the receptors and processing centers to produce the sensory modalities such as touch, temperature, proprioception (body position), and nociception (pain).
Figure 3. Brain map for different functions
The sensory receptors cover the skin and epithelia, skeletal muscles, bones and joints, internal organs, and the cardiovascular system. Vision and sensation region can be used to extract some feedback from the brain by EEG signal analysis. Simultaneous stimuli, brain signal, command from control module, accelerometer output can be very effective for tracking system performance evaluation since it is possible to extract the cyber sickness initiation from EEG signal. Thalamus in the brain is responsible for nausea and vomiting. EEG signal is analysed by ICA method (independent component analysis) and using brain mapping the source of signal can be localized in the brain. Thalamus condition can be continuously monitored by EEG signal. The vomiting level can be recorded by an analogue button on the control device too. In this test-bench EEG signal analysis and the user feedback can be verified with a post-experiment regular questionnaires. Many scholars have adopted a motion-sickness (MS) questionnaire by [Chen, 2010, Kennedy, 1993] and modified for cyber-sickness to measure susceptibility of subjects to MS.
5 DISCUSSION
As seen in Figure 2, different measurements are saved in *.txt file with time stamp for each sample and components. For example, forward, backward, rotation to the left and right, up, down movement and their associated mechanical and software resolution are recorded for navigation tool (joystick). X, y, z coordinates and rotation around x, y and z axis are stored in the same *.txt file but in the second line. The third line is used to save measurement of the acceleration sensor at the first moment (the first time stamp). Then, the third, fourth and sixth lines of the file are used to save the over mentioned variable of navigation, tracker and sensor for the second time (second time stamp) and so on. If our sampling time is millisecond and the first index of time stamp is 0.000s then the second index is 0.001. Therefore, the second line of *.txt file is “Tracker, 0.000, x0, y0, z0, θx0, θy0, θz0”.
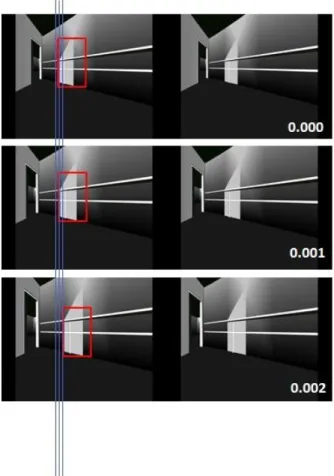
A couple of images are recorded by the virtual camera of OpenGL and the external camera for each location of tracker with the same time stamp as tracker, acceleration sensor and navigation tool. For instance, the second couple of images gets 0.001 time stamp. Figure 4 shows three couples of images for three time stamps. The selected patches for calculating acceleration and velocity are highlighted by red rectangles on the images. As seen in this figure, the location of the patch was changed in the x, y axes. Three vertical lines indicate the variation in the position of the patch on the x axis, the same for y axis. The scale of the patch is changing and this proves that patch is moving along the z axis as well.
6 CONCLUSION
The proposed test-bench derives benefit from user, navigation tools and 3D system in order to perform more complete analysis and evaluation of a 3D environment. Acceleration and velocity of a 3D scene, user movement, tracker, and the delay between different parts of a 3D system, among all the collected data, have great influence on the final evaluation of both a 3D system and navigation tools. These variables play an important role in emerging the motion sickness while hiddenly correlated with EEG signal comes out of thalamus area. The standard post-experiment questionnaires will help to partly verify the result of EEG analysis.
REFERENCES
Brooks F. (1988). Grasping reality through illusion—interactive graphics serving science. In
Proceedings of the ACM SIGCHI conference on Human factors in computing systems, pp. 1-11. Chen Y., Duann J., Chuang S., Lin C., Ko L., Jung T. and Lin C. (2010). Spatial and temporal EEG
dynamics of motion sickness. NeuroImage, 49(3), 2862-2870.
Durlach N. and Mavor A. (1995). Virtual reality: Scientific and technological challenges (National Academies Press).
Foley J., Wallace V. and Chan P. (1984). Human factors of computer graphics interaction techniques. IEEE Computer Graphics Applications, 4(11), 13-48.
Göbel M. (1996). Industrial applications of VES. IEEE Computer Graphics and Applications, 16(1), 10-13.
Herndon K., van Dam A. and Gleicher M. (1994). The challenges of 3D interaction: a CHI’94 workshop. ACM SIGCHI Bulletin, 26(4), 36-43.
Kennedy R., Lane N., Berbaum K. and Lilienthal M. (1993). Simulator sickness questionnaire: an enhanced method for quantifying simulator sickness. The international journal of aviation psychology, 3(3), 203-220.
Mine M. (1995). Virtual environment interaction techniques. UNC Chapel Hill Computer Science Technical Report TR95-018, 1: 507248–2.
Stanney K. (1995). Realizing the full potential of virtual reality: human factors issues that could stand in the way. In IEEE Virtual Reality Annual International Symposium, pp. 28-34.
Watson B., Spaulding V., Walker N. and Ribarsky W. (1997). Evaluation of the effects of frame time variation on VR task performance. In IEEE Virtual Reality Annual International Symposium, pp. 38-44.
Zhai S. and Milgram P. (1993). Human performance evaluation of manipulation schemes in virtual environments. In IEEE Virtual Reality Annual International Symposium, pp. 155-161.
![[PDF] Support du Cours Bases de Programmation Pascal | Cours informatique](data:image/gif;base64,R0lGODlhAQABAIAAAP///wAAACH5BAEAAAAALAAAAAABAAEAAAICRAEAOw==)