Brain white matter damage and its association with neuronal synchrony during 1
sleep 2
Erlan Sanchez1,2, Héjar El-Khatib1,3, Caroline Arbour1,4, Christophe Bedetti1,5, Hélène Blais1, 3
Karine Marcotte1,6, Andrée-Ann Baril1,7, Maxime Descoteaux8, Danielle Gilbert1, Julie 4
Carrier1,3, Nadia Gosselin1,3 5
6
1Research center of the Hôpital du Sacré-Coeur de Montréal, Qc, Canada. 7
2Département de Neurosciences, Université de Montréal, Qc, Canada. 8
3Départment de psychologie, Université de Montréal, Qc, Canada. 9
4Faculté de sciences infirmières, Université de Montréal, Qc, Canada 10
5Research center of the Institut universitaire de gériatrie de Montréal, Qc, Canada 11
6École d’orthophonie et d’audiologie, Université de Montréal, Qc, Canada 12
7Département de psychiatrie, Université de Montréal, Qc, Canada 13
8Département d’informatique, Université de Sherbrooke, Qc, Canada 14
15
Running head:Sleep synchrony and white matter 16
Published in: Brain 17
Number of words: 5391 18
Number of words (abstract) 341 19
Corresponding author: 20
Nadia Gosselin, Ph.D. 21
Center for Advanced Research in Sleep Medicine 22
Hôpital du Sacré-Cœur de Montréal 23
5400 boul. Gouin Ouest, local E-0330, Montréal, Québec, 24
H4J 1C5, Canada 25
Tel: 514-338-2222 ext. 7717; Fax: 514-338-3893 26
Email: nadia.gosselin@umontreal.ca 27
Abstract
29The restorative function of sleep partly relies on its ability to deeply synchronize cerebral 30
networks to create large slow oscillations observable with electroencephalography. 31
However, whether a brain can properly synchronize and produce a restorative sleep when 32
it underwent massive and widespread white matter damage is unknown. Here, we answered 33
this question by testing twenty-three patients with various levels of white matter damage 34
secondary to moderate to severe traumatic brain injuries (ages 18-56; 17 males, 6 females, 35
11-39 month post-injury) and compared them to twenty-seven healthy subjects of similar 36
age and sex. We used magnetic resonance imaging and diffusion tensor imaging metrics (e.g. 37
fractional anisotropy as well as mean, axial and radial diffusivities) to characterize voxel-38
wise white matter damage. We measured the following slow wave characteristics for all slow 39
waves detected in N2 and N3 sleep stages: negative and positive phase durations, peak-to-40
peak amplitude, negative-to-positive slope, and slow wave density. Correlation analyses 41
were performed in traumatic brain injury and control participants separately, with age as a 42
covariate. Contrary to our hypotheses, we found that greater white matter damage mainly 43
over the frontal and temporal brain regions was strongly correlated with a pattern of higher 44
neuronal synchrony characterized by slow waves of larger amplitudes and steeper negative-45
to-positive slopes during non-rapid eye movement sleep. The same pattern of associations 46
with white matter damage was also observed with markers of high homeostatic sleep 47
pressure. More specifically, higher white matter damage was associated with higher slow-48
wave activity power, as well as with more severe complaints of cognitive fatigue. These 49
associations between white matter damage and sleep were found only in our traumatic brain 50
injured participants, with no such correlation in controls. Our results suggest that, contrary 51
to previous observations in healthy controls, white matter damage doesn’t prevent the 52
expected high cerebral synchrony during sleep. Moreover, our observations challenge the 53
current line of hypotheses that white matter microstructure deterioration reduces cerebral 54
synchrony during sleep. Our results showed that the relationship between white matter and 55
the brain’s ability to synchronize during sleep is neither linear nor simple. 56
57 58
Keywords 59
White matter; Sleep; NREM sleep; Traumatic brain injury 60
61
Abbreviations 62
DTI, diffusion tensor imaging 63
EEG, electroencephalography 64
GCS, Glasgow Coma Scale 65
MRI, magnetic resonance imaging 66
NREM, non-rapid eye movement 67
PSG, polysomnography 68
TBI, traumatic brain injury 69 70 71 72 73 74 75 76 77 78 79 80 81 82 83 84 85 86 87 88 89
Introduction
90When the brain departs from wakefulness to enter into deep sleep, it shifts from a state of 91
desynchronized electroencephalographic (EEG) activity to an avalanche of spontaneous 92
slow (< 1 Hz) and large amplitude (> 75 μV) waves. These epiphenomena reflect slow 93
oscillations that occur at a cellular level where intense and synchronized neuronal firing 94
alternates with a period of silent state. Although cortically generated, slow waves are 95
thought to emerge from the dynamic interplay between thalamic nuclei and the cerebral 96
cortex (Murphy et al., 2009; Crunelli et al., 2015). They play crucial roles in the restorative 97
properties of sleep, being notably essential to synaptic plasticity underlying learning and 98
memory consolidation (Marshall et al., 2006; Steriade, 2006; Tononi and Cirelli, 2006; 99
Diekelmann and Born, 2010). Recent studies also implicate them with the clearance of 100
neurotoxic waste products accumulated during wakefulness, a process thought to be 101
compromised in some neurodegenerative diseases (Xie et al., 2013; Mander et al., 2015; 102
Morawska et al., 2016). 103
104
Current hypotheses suggest that the structural properties of white matter tracts affect how 105
brain networks will synchronize themselves to produce slow oscillations during non-rapid 106
eye movement (NREM) sleep. In one study, inter-individual differences of the corpus 107
callosum volume explained 38% of NREM EEG slow-wave activity variability (Buchmann et 108
al., 2011). More specifically, larger volumes were associated with higher slow-wave activity
109
power, supporting the hypothesis that large interhemispheric white matter tracts increase 110
EEG synchronicity. In a second study, a steeper rising slope of the sleep slow waves, 111
suggestive of a better cortical synchrony, was associated with a higher axial diffusivity in 112
major frontal bundles, which the authors have associated with better white matter integrity 113
(Piantoni et al., 2013). Taken together, these results support the idea that healthier white 114
matter tracts correlate with higher cerebral synchronicity during sleep. 115
116
However, these previous studies on cerebral white matter and sleep slow waves have been 117
performed in young, healthy adults who probably have very little inter-individual variability 118
in their white matter tracts. The question remains as to whether a brain can properly 119
synchronize its networks to produce large sleep slow waves and a restorative sleep when it 120
underwent massive white matter damage, as seen in some neurological conditions. This 121
question can be answered by testing patients with extensive white matter damage months 122
after a moderate to severe traumatic brain injury (TBI). In fact, this population is particularly 123
interesting to study, as most of these patients have visible white matter damage on magnetic 124
resonance imaging (MRI) and up to 70% of them develop severe fatigue and chronic sleep 125
disturbances, including increased sleep needs and reports of non-restorative sleep (Duclos 126
et al., 2014; Ouellet et al., 2015). The inability of the brain to synchronize its local neuronal
127
networks during sleep could be a key element to explain these complaints. 128
129
Here we investigated morphological characteristics of NREM sleep slow waves in individuals 130
with various degrees of white matter damage secondary to moderate to severe TBI 131
compared with healthy controls. We also performed correlational analyses between white 132
matter structural properties in TBI subjects and sleep slow wave characteristics that are 133
typically associated with neuronal synchrony. We tested the hypothesis that more severe 134
white matter damage is associated with reduced neuronal synchrony during sleep (e.g. 135
reduced slow wave amplitudes and slopes), which could impede the restorative function of 136
sleep, and in doing so, generate the often observed fatigue and sleep disturbances. 137
138
Chronic TBI patients and controls completed daily sleep diary and wore an actimetric device 139
the week preceding testing in order to monitor total sleep time the week before the MRI 140
scanning and the PSG recording. All participants underwent a 3 Tesla MRI followed by a full 141
night of in-laboratory polysomnography (PSG) the same day. The next morning, a 142
comprehensive neuropsychological assessment was performed, and participants filled out 143
questionnaires on mood, fatigue and sleep. To characterise white matter structure, we used 144
diffusion tensor imaging (DTI), a technique that measures the diffusion of water molecules 145
in the brain. Due to the clear directionality of white matter tracts, water diffusion is greater 146
along the axis of the fibers and lower perpendicular to them, which allows inferring on 147
axonal and myelin damage. We used four diffusion metrics namely fractional anisotropy, 148
mean, axial and radial diffusivities to infer whole-brain voxel-wise white matter structure. 149
In the case of severe damage to the white matter, as seen in chronic TBI patients, it is 150
expected to observe an increased diffusivity along axial and radial axes and a reduced 151
fractional anisotropy(Kraus et al., 2007; Kennedy et al., 2009; Kumar et al., 2009; Pitkonen 152
et al., 2012; Haberg et al., 2015). To characterize NREM sleep slow waves, we used an
153
automatic detection on a full night of PSG recording. We measured slow wave density and 154
morphological characteristics, including amplitude, frequency, slope, and phase duration. 155
We hypothesized that the extent of white matter damage (reflected by increased diffusivities 156
and reduced fractional anisotropy) predicts lower neuronal synchrony during sleep 157
(reflected by waves of lower amplitude and slopes). 158 159
Methods
160 Participants 161Twenty-three participants aged between 18 and 56 years old and diagnosed with a moderate 162
to severe TBI were recruited for this prospective study and were compared to twenty-seven 163
age- and sex-matched healthy controls. All TBI patients were previously admitted to the 164
Hôpital du Sacré-Coeur de Montréal, a tertiary trauma center, in the acute stage of their injury
165
and they were all recruited based on their hospital chart. During testing, TBI patients were 166
in the chronic phase of the injury, at least 11 months following the trauma (average: 23.4 167
months, range 11-39 months, see Table 1 for demographic and clinical characteristics). 168
Diagnosis of TBI, defined as an alteration in brain function, or other evidence of brain 169
pathology, caused by an external force (Menon et al., 2010), was performed by a licensed 170
neurosurgeon according to standard established criteria for moderate to severe TBI 171
(Teasdale and Jennett, 1974): a Glasgow Coma Scale (GCS) score between 3 and 12, a post-172
traumatic amnesia longer than 1 h, a loss of consciousness longer than 30 min, and positive 173
brain scans. All participants presenting any of the following conditions were excluded from 174
the study: (1) a history of psychiatric, neurologic, sleep (before the injury), or substance use 175
disorders; (2) sleep medication and inability to cease medication use prior to testing; (4) 176
history of single (for control subjects) or multiple TBI (for TBI patients); (5) quadriplegia; 177
(6) obesity, defined by a body mass index over 30; (7) pregnancy; (8) jetlag due to a recent 178
trans-meridian trip; (9) night shift work leading to an atypical sleeping schedule; (10) MRI 179
contraindications (often in the form of metallic implants left by surgeries). Eight TBI 180
participants were taking psychoactive medication prior to recruitment (see Supplementary 181
Table I for detailed data). Of those, three ceased the intake several days before the testing. 182
The medicated patients, when compared to the rest of the group, showed no significant 183
differences in either slow waves, sleep quality, or fatigue scores and were therefore included 184
in analyses. The study was approved by the Hôpital du Sacré-Coeur de Montréal Research 185
Ethics Board and written consent was obtained from each participant or the immediate 186
family (for inapt participants), compliant with the Declaration of Helsinki. 187
188
Overview of the Protocol 189
One week before the lab visit, participants wore an activity monitor device (Actiwatch-L or 190
Actiwatch-Spectrum, Philips Healthcare, Andover, MA) and filled out a daily sleep diary to 191
document their sleep-wake cycle. Participants then underwent a brain MRI followed by a full 192
night of in-laboratory PSG the same day. A comprehensive neuropsychological assessment 193
was performed the morning after PSG to measure executive functions, processing speed, 194
attention, language, working memory, and global functioning. We collected clinical data 195
related to the injury from their hospital charts. Participants also filled out several 196
questionnaires: the Pittsburgh Sleep Quality Index (Buysse et al., 1989), the Fatigue Severity 197
Scale (Krupp et al., 1989), the Epworth Sleepiness Scale (Johns, 1991), the Beck Anxiety 198
Inventory (Beck et al., 1988), and the Beck Depression Inventory-II (Beck et al., 1996). 199
200
Polysomnography 201
Bedtime and wake time were determined according to the participant’s usual schedule. The 202
recording montage comprised nineteen EEG derivations (FP1, FP2, Fz, F3, F4, F7, F8, Cz, C3, 203
C4, Pz, P3, P4, O1, O2, T3, T4, T5, T6), bilateral electrooculogram, chin and tibia 204
electromyogram, and electrocardiogram. Nasal and oral airflows were measured using a 205
pressure transducer, a thoracic belt, and an abdominal belt. Blood oxygen saturation was 206
measured with a pulse oximeter on the finger. Sleep stages and events were scored according 207
to criteria from the American Academy of Sleep Medicine scoring manual and sleep cycles 208
according to the criteria of Aeschbach and Borbely (Aeschbach and Borbely, 1993). 209
210
Slow waves detection and analysis 211
Slow waves were detected automatically on selected frontal and central derivations (F3, F4, 212
Fz, C3, C4, Cz) during NREM N2 and N3 sleep stages for all sleep cycles. Epochs containing 213
artefacts were excluded by automatic and visual detection. These data were analyzed using 214
an in-house software package combined with an acquisition software (Harmonie Stellate 215
Systems, Montreal, Canada). EEG data were initially band pass filtered between 0.3 and 4.0 216
Hz with a linear phase finite impulse response filter (-3 dB). The criteria used for slow wave 217
detection were: (1) negative peak lower than -40 µV; (2) peak-to-peak amplitude higher than 218
75 µV; (3) negative phase duration between 125 and 1500 ms; and (4) positive phase 219
duration lower than 1000 ms (Carrier et al., 2011). The following morphological 220
characteristics were then identified for each slow wave detected: amplitude (voltage 221
difference between the negative and positive peaks in µV), frequency (oscillation speed in 222
Hz), slope (velocity of the change between the negative and positive peaks in µV/s), negative 223
phase duration (in s), positive phase duration (in s), and density (number of slow waves per 224
minute). A visual representation of these characteristics can be seen in Supplementary Fig. 225
1. 226 227
Slow-wave activity power 228
Quantitative EEG analysis was performed on the frontal derivations during NREM N2 and N3 229
sleep stages of the entire night and for sleep cycles 1 to 3 separately. Epochs containing 230
artefacts were excluded by automatic and visual detection. These data were analyzed using 231
an in-house software package combined with an acquisition software (Harmonie Stellate 232
Systems, Montreal, Canada). Fast Fourier Transform was carried out on epochs of 5 seconds, 233
and the absolute and relative (delta / (theta+alpha+beta)) power for the delta frequency 234
band (0.5 – 4 Hz) was then calculated. 235
236
MRI acquisition 237
Magnetic resonance imaging of the brain was performed on a 3.0 T scanner (Siemens 238
Magnetom Trio) at the Unité de Neuroimagerie Fonctionnelle of the Institut universitaire de 239
gériatrie de Montréal. The MRI protocol consisted of a pulsed spin echo diffusion-weighted
240
imaging sequence (echo-planar imaging) (64 non-collinear directions, image resolution = 2 241
x 2 x 2 mm3, 72 slices, RT = 9500 ms, ET = 93 ms, b-value = 1000 s/mm2, duration = 648 s) 242
with additional gradient field maps and AP/PA b0 sequences, a T1-weighted sequence 243
(image resolution = 1 x 1 x 1 mm3, RT = 2530 ms, ET = 1.64 ms, duration = 363 s), a T2-244
weighted sequence and a FLAIR sequence. A licensed neuroradiologist inspected all MRI. 245
246
DTI preprocessing and analysis 247
Diffusion data were preprocessed using the Toolkit for Analysis in Diffusion MRI (http://unf-248
montreal.ca/toad/). The pipeline involves the following steps: (1) parcellation using the 249
Freesurfer (https://surfer.nmr.mgh.harvard.edu/) recon-all pipeline v5.3.0; (2) denoising; 250
(3) motion and distortion correction; (4) upsampling and registration with the parcelled 251
anatomical images and atlases; (5) FSL tensor reconstruction; and (6) extraction of tensor 252
metrics including fractional anisotropy and mean, axial and radial diffusivity. 253
254
Data were then prepared for the voxel-wise statistical analysis using TBSS (Smith et al., 255
2006) from the FSL diffusion toolbox (https://fsl.fmrib.ox.ac.uk/) (Smith et al., 2004). First, 256
all subjects' fractional anisotropy data were affine-aligned to the MNI152 1mm standard 257
space using the nonlinear registration tool FNIRT. Next, the mean fractional anisotropy 258
image was created and thinned with a threshold of FA > 0.2 to create a mean fractional 259
anisotropy skeleton which represents the centres of all tracts common to the group. Each 260
subject's aligned fractional anisotropy data was then projected onto this skeleton. Similar 261
steps were subsequently performed to project the mean, axial, and radial diffusivity data 262
onto this skeleton as well. 263
264
Statistical analyses 265
The TBI and control groups were first compared on demographic characteristics, 266
questionnaires, neuropsychological tests, and sleep macro-architecture using two-tailed 267
Student t-tests or Chi-square. For slow wave analysis, in order to reduce the number of 268
variables and because no hemisphere effect was observed, we pooled frontal electrodes 269
together (frontal cluster: F3, F4, Fz) and central electrodes together (central cluster: C3, C4, 270
Cz). For three participants, one electrode had to be removed due to artefacts, and we 271
therefore used the two remaining electrodes only. One participant had all central electrodes 272
removed, and was excluded from this analysis. To characterize slow waves in TBI and control 273
subjects, we performed repeated measure ANOVAs with one inter-subject factor (group: TBI 274
versus control) and one repeated measure (electrode: frontal and central clusters), with age 275
as a covariate to account for its effect on slow waves. These statistical analyses were carried 276
out with SPSS Statistics version 20 (IBM Corp., 2011), with statistical significance set at 277
p<0.05. 278
279
DTI statistics were performed using Randomise (Winkler et al., 2014), a tool from the FSL 280
diffusion toolbox. It uses nonparametric Monte Carlo permutation inference to perform 281
voxel-wise statistics on the white matter images processed previously by TBSS. For each 282
contrast of interest in our models, 10 000 permutations were done, giving us a confidence 283
limit of ± 0.0044 for p=0.05. Threshold-free cluster enhancement was used as a thresholding 284
method (Smith and Nichols, 2009; Winkler et al., 2014). This method takes the raw statistic 285
image and produces an output image in which the voxel-wise values represent the amount 286
of cluster-like local spatial support. The family-wise error rate was accounted for by the 287
Monte Carlo permutation test and the threshold-free cluster enhancement. Group 288
comparisons were performed for fractional anisotropy, as well as for mean, axial, and radial 289
diffusivities. Group correlations were performed on all four diffusion metrics for the 290
following regressors with age as a confound variable: injury severity (Glasgow Coma Scale 291
score, length of posttraumatic amnesia), slow wave characteristics from the frontal pool of 292
electrodes (amplitude, slope, negative phase duration, positive phase duration, frequency, 293
density), slow-wave activity power for F3 electrode (both relative and absolute, for sleep 294
cycles 1 to 3 separately) and questionnaire scores. Regression analyses were performed in 295
the TBI and the control groups separately. The significant clusters were labelled according 296
to the ICBM-DTI-81 white matter atlas (Mori et al., 2008). T-values of significant clusters 297
were presented in the figures by masking the original t-value images to only show significant 298
clusters (p<0.05 corrected for multiple comparisons). While all analyses were performed on 299
the mean fractional anisotropy skeleton, significant clusters in the presented figures were 300
filled from the thin fractional anisotropy skeleton to the mean fractional anisotropy image to 301
better represent actual white matter. 302
303
Data availability 304
Relevant data that support the findings of this study are available from the corresponding 305
author upon reasonable request. 306 307
Results
308 Participant characteristics 309Demographic characteristics as well as questionnaire, neuropsychological and sleep macro-310
architecture results for both groups are presented in Table 1. The TBI group reported 311
significantly more fatigue and worse sleep quality than controls. Additionally, these patients 312
presented impairments in several cognitive domains, as evidenced by poorer performances 313
than controls on neuropsychological tests. TBI patients’ sleep macro-architecture was not 314
different from controls despite their subjective evaluation of poor sleep quality and daytime 315
fatigue. No group difference was found in the total sleep time measured with sleep diaries 316
and actigraphy in the week preceding the PSG. 317
318
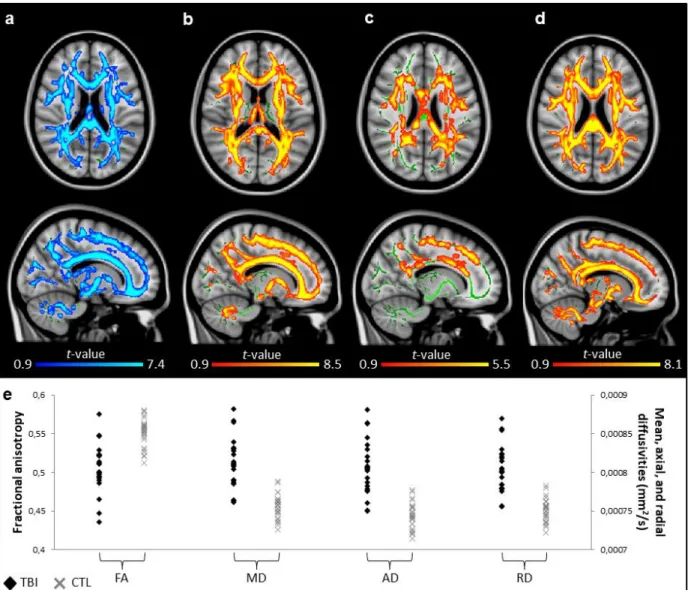
A voxel-wise statistical analysis (using Tract-Based Spatial Statistics from the FMRIB 319
Software Library diffusion toolbox) of the preprocessed DTI scans showed extensive white 320
matter damage in the TBI group (Fig. 1). Decreased fractional anisotropy and increased 321
mean, axial and radial diffusivities were evident across almost all major white matter tracts 322
in the brain, from the cerebral hemispheres to the brainstem. Furthermore, the TBI group 323
was very heterogeneous in terms of white matter damage, with some individuals showing 324
no difference from controls and others showing important sequelae. This extensive white 325
matter damage was strongly correlated with markers of TBI severity, most notably the 326
Glasgow Coma Scale scores upon hospital admission and post-traumatic amnesia duration 327
(Supplementary Fig. 2). 328
329
Sleep slow waves in TBI participants compared to healthy controls 330
We first performed ANOVAs with Group and one repeated measure (EEG electrodes: frontal 331
and central clusters) with age as a covariate on slow wave characteristics. We found no 332
Group X EEG electrode interaction for any of the slow wave characteristics, but we observed 333
several significant group effects (Table 2). TBI participants had slightly longer negative and 334
positive phase duration than control participants. As expected by the latter result, slow wave 335
frequency was lower in TBI compared to control subjects. Finally, the negative-to-positive 336
slope was lower in the TBI group compared to the control group. No significant main group 337
effect was found for either slow wave amplitude or density. 338
339
Sleep slow waves and white matter damage 340
The analysis of white matter with voxel-wise statistics (using TBSS and Randomise from the 341
FSL diffusion toolbox) revealed a pattern of strong associations with slow waves’ 342
morphology involving the amplitude, slopes, and negative phase duration. While no 343
relationship was found in the control group, DTI metrics generally associated with a more 344
damaged white matter predicted higher cortical synchrony during sleep in the TBI group. 345
346
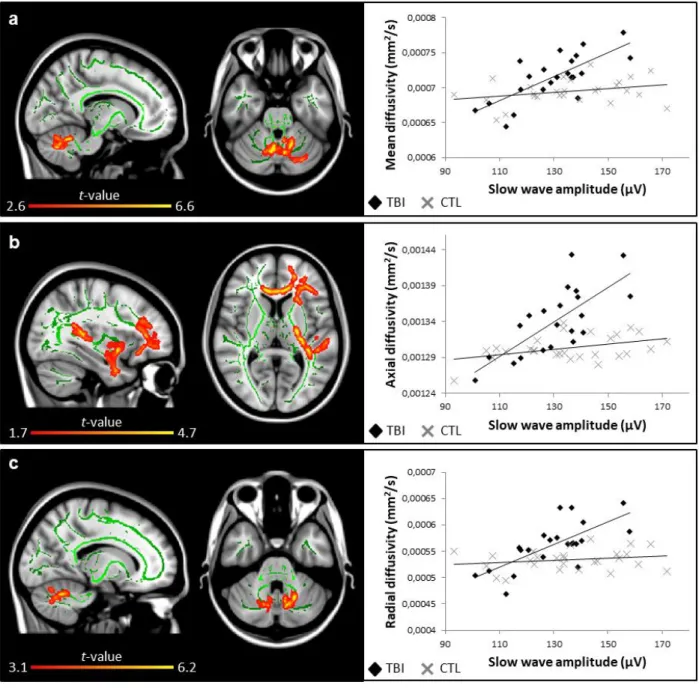
Higher slow wave amplitude correlated with more severe white matter damage in TBI 347
patients (Fig. 2), and more specifically with higher axial diffusivities in multiple voxel 348
clusters in the frontal and temporal regions, involving the genu of the corpus callosum, the 349
anterior and posterior limbs of the internal capsule, the retrolenticular part of the internal 350
capsule, the anterior, posterior, and superior corona radiata, the posterior thalamic 351
radiation, the inferior longitudinal and fronto-occipital fasciculus, the external capsule, the 352
fornix, and the uncinate fasciculus (Fig. 2b). Higher slow wave amplitude also correlated with 353
both higher radial diffusivities and higher mean diffusivities in the inferior, middle, and 354
superior cerebellar peduncles (Fig. 2a,c). 355
356
Steeper slow wave slope was also correlated with more severe white matter damage in TBI 357
patients. Namely, the negative-to-positive slope was steeper when axial diffusivity was 358
higher in clusters located over the frontal and temporal regions that were previously 359
detailed (Fig. 3). 360
361
The negative phase duration of the slow wave was also positively correlated with white 362
matter damage in TBI patients (Fig. 4). More specifically, longer negative phases correlated 363
with lower fractional anisotropy in multiple voxel clusters once again scattered in a fronto-364
temporal manner and involving the splenium of the corpus callosum, the cerebral peduncle, 365
the posterior limb of the internal capsule, the retrolenticular part of the internal capsule, the 366
anterior and posterior corona radiata, the posterior thalamic radiation, the inferior 367
longitudinal and fronto-occipital fasciculus, the external capsule, the fornix, the uncinate 368
fasciculus, and the tapetum (Fig. 4a). Longer negative phases were also associated with 369
higher mean diffusivities in the genu and body of the corpus callosum, and the anterior 370
corona radiata (Fig. 4b). 371
372
In summary, in TBI patients, widespread white matter damage in various regions containing 373
short and long-range white matter tracts was associated with a pattern of higher neuronal 374
synchrony in which the sleep slow waves are of higher amplitude and steeper slopes. Longer 375
negative phase duration was also associated with the same observed white matter damage. 376
377
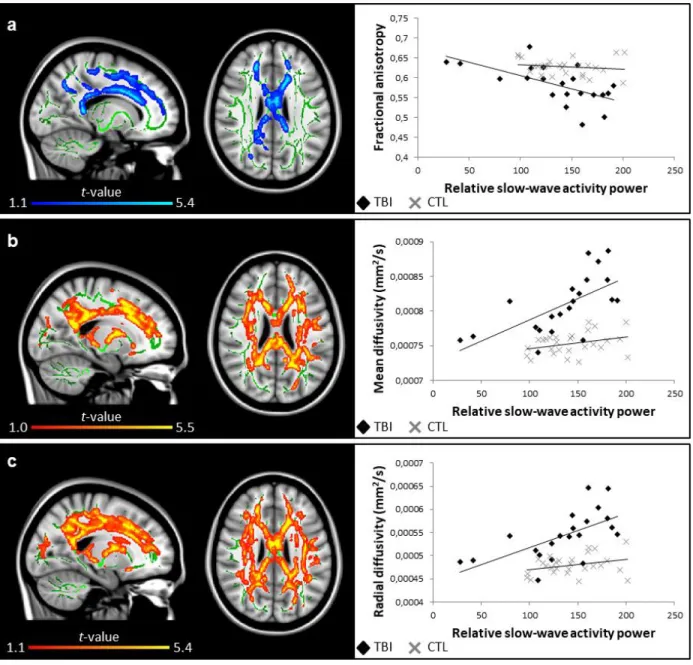
Sleep slow-wave activity and white matter damage 378
To further investigate the association between cortical synchrony during sleep and white 379
matter structure, we analyzed the NREM slow-wave activity power (0.5 to 4 Hz frequency 380
band). We measured the absolute and relative slow-wave activity power for each sleep cycle. 381
No group difference was found for NREM slow-wave activity power between TBI patients 382
and controls for any of the sleep cycles. However, the voxel-wise correlations with DTI 383
metrics showed very strong associations in the TBI group only, similar to what was found 384
with slow waves voxel-wise analyses. More specifically, white matter damage was positively 385
correlated with relative slow-wave activity power in the first sleep cycle only (Fig. 5) and 386
with absolute slow-wave activity power in the second (Supplementary Fig. 3) and third sleep 387
cycles (Supplementary Fig. 4). In these cases, higher relative and absolute slow-wave activity 388
power correlated with higher mean diffusivities, higher radial diffusivities, and lower 389
fractional anisotropy in regions mostly overlapping with what was found with slow waves’ 390
morphology analysis. 391
392
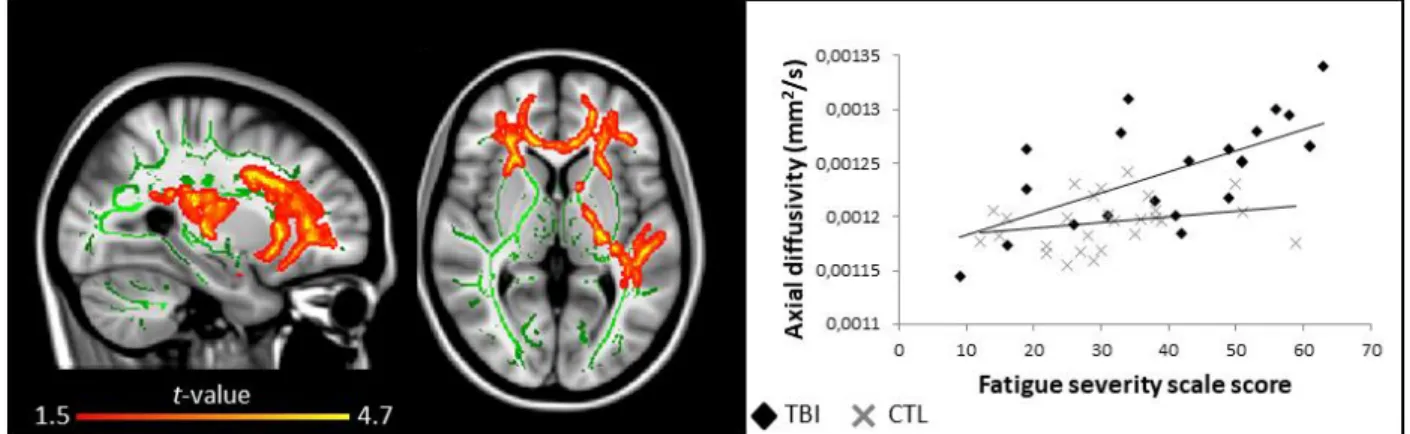
Subjective sleep quality, fatigue, and white matter damage 393
Finally, we set out to see if the variability in white matter structure had any relationship with 394
self-reported measures of sleep and fatigue. In the TBI group, while sleep quality and 395
daytime sleepiness did not correlate with white matter characteristics, fatigue was positively 396
correlated with white matter damage. Indeed, higher self-reported fatigue strongly 397
correlated with higher axial diffusivities in the same pattern of voxel clusters mentioned 398
previously (Fig. 6). No such associations were found for the control group. For both groups, 399
no significant associations were found between any of the self-reported measures of sleep 400
and fatigue and slow wave characteristics. 401
402
Discussion
403In the present study, patients with moderate to severe TBI had widespread white matter 404
damage throughout the brain, from all cortical tracts to the brainstem, which is consistent 405
with the literature showing white matter damage in chronic TBI (Benson et al., 2007; Kraus 406
et al., 2007; Kennedy et al., 2009; Kinnunen et al., 2011; Spitz et al., 2013; Haberg et al., 2015).
407
Our DTI results suggest significant demyelination, axonal injury and white matter 408
degeneration consecutive of moderate to severe TBI. Not surprisingly, the extent of white 409
matter damage correlated with more severe TBI in our sample. Our most important result 410
was that this white matter damage was strongly associated with signs of better neuronal 411
synchrony during NREM sleep: EEG slow waves were of higher amplitude and had steeper 412
slopes in participants with more damaged brains. These results are in opposition with our 413
hypotheses, as we expected that a loss of white matter would have decreased neuronal 414
synchrony and consequently, decreased slow wave slopes and amplitudes. Our results also 415
showed that white matter damage correlated positively with longer slow wave negative 416
phase, higher NREM sleep slow-wave activity power and more severe fatigue during the day. 417
These results challenge our understanding of what represents healthy NREM sleep slow 418
waves. 419
420
The complex relationship between cortical synchrony during sleep and white matter 421
integrity 422
During NREM sleep, the brain is highly synchronized locally and spontaneously produces 423
slow waves on the EEG. These epiphenomena reflect slow oscillations that occur at a cellular 424
level, where periods of silent state (negative phase) alternate with intense synchronized 425
neuronal firing (positive phase). The slow wave N-to-P slope represents the rate of transition 426
between the negative and the positive phases; steeper slopes are the result of a more 427
synchronous transition between the silent phase to the depolarization phase. Slow wave 428
amplitude, on the other hand, most likely represents the extent of the synchronal neuronal 429
firing. The more cortical neurons are simultaneously depolarized, the larger the measured 430
amplitude should be on the EEG. Slow oscillations occur across the cortex, originating mostly 431
near the insula and the medial cingulate gyrus (Murphy et al., 2009) from the dynamic 432
interplay between thalamic nuclei and the cerebral cortex (Crunelli et al., 2015), and 433
propagate along the anterior-posterior axis of the brain through the cingulate pathways and 434
parts of the default-mode network (Massimini et al., 2004; Murphy et al., 2009). Short- and 435
long-range connections are therefore considered crucial for slow wave generation and 436
propagation, and as such, a strong association with white matter is to be expected. 437
438
In line with this hypothesis, a previous study found that a steeper rising slope of slow waves 439
was associated with higher axial diffusivity in major frontal bundles and temporal lobe 440
fascicles (Piantoni et al., 2013). This was found in fifteen young, healthy adult males with 441
little variability in their white matter characteristics. In the present study, we failed to 442
replicate these findings in our healthy control group. Factors explaining the discrepancy 443
between studies could be sex difference in the control groups (77% males in the present 444
study vs. 100% males in the study by Piantoni et al.), the age difference in the control groups 445
(30.3 ± 13.4 years vs 25.4 ± 4.8 years, respectively), and the age-correction applied to our 446
analyses. However, further studies with larger sample of healthy control subjects are 447
necessary to clearly identify the association between individual differences in healthy white 448
matter and slow wave characteristics. 449
450
Slow waves’ morphology has also been studied in aging. Older adults showed a decline in 451
slow wave amplitude and slope (Carrier et al., 2011). These modifications in slow wave 452
characteristics could be linked with the white matter loss observed with advancing age 453
(Peters, 2002; Yap et al., 2013) and were found to be associated with the thinning of specific 454
cortical regions (Dube et al., 2015). 455
By opposition with these previous studies in healthy young and older adults, our patients 457
with widespread white matter damage had higher slow wave amplitudes and steeper slopes. 458
Although we may have expected to see changes mirroring those seen in aging individuals, 459
due to the documented loss of white matter in the aging brain, we did not find such results. 460
Our results combined with these previous observations raises the possibility that the 461
relationship between sleep slow waves and white matter structure is neither linear nor 462
simple. To understand the association between white matter loss and slow waves observed 463
in our TBI participants, we may refer to studies on partial cortical deafferentation. In vivo cat 464
experiments in which a portion of the cortex is undercut have been performed to study the 465
mechanisms of trauma-induced epilepsy (Avramescu and Timofeev, 2008; Avramescu et al., 466
2009; Timofeev et al., 2013). In these studies, the authors recorded enhanced slow-wave 467
activity in the undercut hemisphere up to 16 weeks after the injury (Timofeev et al., 2013). 468
They hypothesized that this increased synchrony was caused by the increased network 469
excitability observed chronically after partial deafferentation. Indeed, homeostatic plasticity 470
in the brain works to maintain network excitability through changes in the balance of 471
excitatory and inhibitory synapses and regulation of intrinsic neuronal excitability 472
(Turrigiano et al., 1998; Turrigiano, 2011). After partial deafferentation, network activity is 473
acutely decreased, which engages upregulatory mechanisms to increase cortical excitability 474
(Avramescu and Timofeev, 2008; Avramescu et al., 2009). This concept is evidenced by 475
another study in which they showed an acute reduction of slow-wave activity power in 476
partially deafferentated cats, followed by a time-dependent recovery of slow-wave activity 477
along with cortical excitability (Lemieux et al., 2014). Although the models used in these 478
studies are more crippling than what is observed in human TBI, these observations may 479
partly explain the association we observed between white matter and NREM sleep slow 480
waves in the present study. Diffuse white matter damage may acutely engage these 481
homeostatic mechanisms to upregulate network excitability in the long term and cause part 482
of the increase in neuronal synchrony we described. One study in humans has investigated 483
cortical excitability changes after mild to moderate TBI (Nardone et al., 2011). They found 484
that a subset of patients, more specifically those with excessive daytime sleepiness, 485
presented patterns of motor cortex hypoexcitability when compared to controls. However, 486
the large majority of patients showed no such hypoexcitability. These measures were also 487
taken during wakefulness and on patients with minor brain damage only three months 488
following the TBI. As such, this question remains open until more comprehensive 489
experiments are performed. 490
491
On the other hand, it may also be that physical disconnection by diffuse white matter damage 492
in TBI brings the cortex closer to its default state. Many argue that the default emergent 493
activity patterns of the cortical network are highly synchronous slow waves (Sanchez-Vives 494
et al., 2017). Indeed, spontaneous slow waves emerge in states where the cortex is either
495
physically or functionally disconnected from outside stimulation, such as deep sleep 496
(Steriade et al., 2001), anesthesia (Chauvette et al., 2011), or in-vitro cortex slices (Sanchez-497
Vives and McCormick, 2000). Thalamo-cortical connections are especially vulnerable to TBI 498
in humans, effectively bringing the cortex slightly closer to an isolated state. This may as well 499
play a role in the large slow waves we observed in patients with important white matter 500
damage. 501
502
Finally, we cannot exclude that this association between white matter damage and slow 503
wave characteristics be due to the homeostatic sleep pressure (Borbely, 1982; Borbely and 504
Achermann, 1999). An increase in slow-wave activity power at the beginning of the sleep 505
period is the standard physiological marker of homeostatic sleep pressure (Borbely, 1982). 506
Our TBI subjects with more severe white matter damage had higher slow-wave activity for 507
all sleep cycles. Furthermore, steeper slow oscillation slopes and higher amplitude, the 508
pattern observed in our TBI participants who had more white matter damage, were 509
previously associated with a rise in homeostatic sleep pressure (Riedner et al., 2007; 510
Vyazovskiy et al., 2007; Bersagliere and Achermann, 2010; Vyazovskiy et al., 2011; 511
Rodriguez et al., 2016). Chronic white matter damage may cause TBI patients to accumulate 512
need for sleep faster. Indeed, white matter damage due to TBI has very consistently been 513
associated with impaired cognition (Kraus et al., 2007; Kumar et al., 2009; Palacios et al., 514
2013; Spitz et al., 2013; Arenth et al., 2014; Kim et al., 2014), and TBI patients have been 515
shown to exert more mental effort for the same task than healthy subjects (Belmont et al., 516
2009). A study using fMRI has also observed that while performing a cognitive task, TBI 517
patients have increased brain activity compared to healthy subjects in several brain regions 518
believed to be involved in mental fatigue, which is thought to represent higher mental effort 519
(Kohl et al., 2009). In the present study, we found that TBI patients with more white matter 520
damage also had more severe subjective fatigue. Similar results were observed in other 521
studies (Clark et al., 2017 ;Schonberger et al., 2017). Taken together, these findings suggest 522
that chronic white matter damage causes TBI patients to accumulate mental fatigue faster 523
during the day, which may increase homeostatic sleep pressure and enhances sleep 524
synchrony during subsequent sleep. A valid concern would be that these patients were under 525
sleep deprivation, causing the aforementioned phenomena. However, as mentioned 526
previously all patients completed daily sleep agendas and wore an activity monitor device 527
the week preceding testing, all of which confirm that these patients had similar total sleep 528
time when compared with controls. Still, protocols specifically assessing the evolution of 529
fatigue throughout the day in relation with sleep homeostatic pressure need to be performed 530
to adequately verify this hypothesis. 531
532
Conclusion 533
This study represents the first to explore the association between sleep slow waves and 534
white matter structure in adults with white matter damage. Our results showed strong 535
associations between white matter and slow waves occurring during NREM sleep. More 536
damaged brains were associated with markers of higher brain synchrony during sleep, and 537
these associations could be caused by cerebral disconnection or by elevated homeostatic 538
sleep pressure in TBI patients. White matter damage does not seem to impede the 539
restorative function of sleep as we first thought. These results bring new insight to 540
understand the pathophysiology of sleep disturbances and fatigue observed after TBI as well 541
as factors influencing brain synchrony during sleep. Moreover, this study challenges the 542
current hypotheses regarding the role of white matter structure on the brain ability to 543
synchronize its cortical regions during sleep and produce restorative sleep. 544
545
Acknowledgements
546For their support in data acquisition, the authors wish to thank Catherine Duclos, Solenne 547
Van der Maren, Caroline D’Aragon, Julien Lauzier, Carollyn Hurst, and André Cyr. 548
549
Funding
550This study was funded by government granting agencies by grants to NG as a principal 551
investigator: Canadian Institutes of Health Research (CIHR) and Fonds de Recherche Santé-552
Québec (FRQS). ES and AAB received scholarships from the CIHR and FRQS. NG received a 553
salary award from the FRQS. JC received a salary award from the CIHR. MD holds a 554
Université de Sherbrooke Research Chair in Neuroinformatics. 555
556
Author contributions
557ES and NG participated in study conception and design. ES, HEK, CA, HB, and DG 558
participated in data acquisition. ES, CB, and KM participated in data analysis. ES, AAB, MD, 559
JC, and NG participated in data interpretation. ES wrote the manuscript. NG assisted in 560
writing the manuscript. All authors critically revised the manuscript and approved the final 561 version. 562 563
Competing interests
564The authors declare no competing interests. 565
566
References
567568
Aeschbach D, Borbely AA. All-night dynamics of the human sleep EEG. Journal of sleep 569
research 1993; 2(2): 70-81. 570
Arenth PM, Russell KC, Scanlon JM, Kessler LJ, Ricker JH. Corpus callosum integrity and 571
neuropsychological performance after traumatic brain injury: a diffusion tensor imaging 572
study. The Journal of head trauma rehabilitation 2014; 29(2): E1-e10. 573
Avramescu S, Nita DA, Timofeev I. Neocortical post-traumatic epileptogenesis is associated 574
with loss of GABAergic neurons. Journal of neurotrauma 2009; 26(5): 799-812. 575
Avramescu S, Timofeev I. Synaptic strength modulation after cortical trauma: a role in 576
epileptogenesis. The Journal of neuroscience : the official journal of the Society for 577
Neuroscience 2008; 28(27): 6760-72. 578
Beck AT, Epstein N, Brown G, Steer RA. An inventory for measuring clinical anxiety: 579
psychometric properties. Journal of consulting and clinical psychology 1988; 56(6): 893. 580
Beck AT, Steer RA, Brown GK. Beck depression inventory-II. San Antonio 1996; 78(2): 490-581
8. 582
Belmont A, Agar N, Azouvi P. Subjective fatigue, mental effort, and attention deficits after 583
severe traumatic brain injury. Neurorehabilitation and neural repair 2009; 23(9): 939-44. 584
Benson RR, Meda SA, Vasudevan S, Kou Z, Govindarajan KA, Hanks RA, et al. Global white 585
matter analysis of diffusion tensor images is predictive of injury severity in traumatic brain 586
injury. Journal of neurotrauma 2007; 24(3): 446-59. 587
Bersagliere A, Achermann P. Slow oscillations in human non-rapid eye movement sleep 588
electroencephalogram: effects of increased sleep pressure. Journal of sleep research 2010; 589
19(1 Pt 2): 228-37. 590
Borbely AA. A two process model of sleep regulation. Human neurobiology 1982; 1(3): 195-591
204. 592
Borbely AA, Achermann P. Sleep homeostasis and models of sleep regulation. Journal of 593
biological rhythms 1999; 14(6): 557-68. 594
Buchmann A, Kurth S, Ringli M, Geiger A, Jenni OG, Huber R. Anatomical markers of sleep 595
slow wave activity derived from structural magnetic resonance images. Journal of sleep 596
research 2011; 20(4): 506-13. 597
Buysse DJ, Reynolds CF, 3rd, Monk TH, Berman SR, Kupfer DJ. The Pittsburgh Sleep Quality 598
Index: a new instrument for psychiatric practice and research. Psychiatry research 1989; 599
28(2): 193-213. 600
Carrier J, Viens I, Poirier G, Robillard R, Lafortune M, Vandewalle G, et al. Sleep slow wave 601
changes during the middle years of life. The European journal of neuroscience 2011; 33(4): 602
758-66. 603
Chauvette S, Crochet S, Volgushev M, Timofeev I. Properties of slow oscillation during slow-604
wave sleep and anesthesia in cats. The Journal of neuroscience : the official journal of the 605
Society for Neuroscience 2011; 31(42): 14998-5008. 606
Clark AL, Delano-Wood L, Sorg SF, Werhane ML, Hanson KL, Schiehser DM. Cognitive fatigue 607
is associated with reduced anterior internal capsule integrity in veterans with history of mild 608
to moderate traumatic brain injury. Brain imaging and behavior 2017; 11(5): 1548-54. 609
Crunelli V, David F, Lorincz ML, Hughes SW. The thalamocortical network as a single slow 610
wave-generating unit. Current opinion in neurobiology 2015; 31: 72-80. 611
Diekelmann S, Born J. The memory function of sleep. Nature reviews Neuroscience 2010; 612
11(2): 114-26. 613
Dube J, Lafortune M, Bedetti C, Bouchard M, Gagnon JF, Doyon J, et al. Cortical thinning 614
explains changes in sleep slow waves during adulthood. The Journal of neuroscience : the 615
official journal of the Society for Neuroscience 2015; 35(20): 7795-807. 616
Duclos C, Dumont M, Wiseman-Hakes C, Arbour C, Mongrain V, Gaudreault PO, et al. Sleep 617
and wake disturbances following traumatic brain injury. Pathologie-biologie 2014; 62(5): 618
252-61. 619
Haberg AK, Olsen A, Moen KG, Schirmer-Mikalsen K, Visser E, Finnanger TG, et al. White 620
matter microstructure in chronic moderate-to-severe traumatic brain injury: Impact of 621
acute-phase injury-related variables and associations with outcome measures. Journal of 622
neuroscience research 2015; 93(7): 1109-26. 623
Johns MW. A new method for measuring daytime sleepiness: the Epworth sleepiness scale. 624
Sleep 1991; 14(6): 540-5. 625
Kennedy MR, Wozniak JR, Muetzel RL, Mueller BA, Chiou HH, Pantekoek K, et al. White matter 626
and neurocognitive changes in adults with chronic traumatic brain injury. Journal of the 627
International Neuropsychological Society : JINS 2009; 15(1): 130-6. 628
Kim J, Parker D, Whyte J, Hart T, Pluta J, Ingalhalikar M, et al. Disrupted structural 629
connectome is associated with both psychometric and real-world neuropsychological 630
impairment in diffuse traumatic brain injury. Journal of the International 631
Neuropsychological Society : JINS 2014; 20(9): 887-96. 632
Kinnunen KM, Greenwood R, Powell JH, Leech R, Hawkins PC, Bonnelle V, et al. White matter 633
damage and cognitive impairment after traumatic brain injury. Brain : a journal of neurology 634
2011; 134(Pt 2): 449-63. 635
Kohl AD, Wylie GR, Genova HM, Hillary FG, Deluca J. The neural correlates of cognitive fatigue 636
in traumatic brain injury using functional MRI. Brain injury 2009; 23(5): 420-32. 637
Kraus MF, Susmaras T, Caughlin BP, Walker CJ, Sweeney JA, Little DM. White matter integrity 638
and cognition in chronic traumatic brain injury: a diffusion tensor imaging study. Brain : a 639
journal of neurology 2007; 130(Pt 10): 2508-19. 640
Krupp LB, LaRocca NG, Muir-Nash J, Steinberg AD. The fatigue severity scale. Application to 641
patients with multiple sclerosis and systemic lupus erythematosus. Archives of neurology 642
1989; 46(10): 1121-3. 643
Kumar R, Husain M, Gupta RK, Hasan KM, Haris M, Agarwal AK, et al. Serial changes in the 644
white matter diffusion tensor imaging metrics in moderate traumatic brain injury and 645
correlation with neuro-cognitive function. Journal of neurotrauma 2009; 26(4): 481-95. 646
Lemieux M, Chen JY, Lonjers P, Bazhenov M, Timofeev I. The impact of cortical 647
deafferentation on the neocortical slow oscillation. The Journal of neuroscience : the official 648
journal of the Society for Neuroscience 2014; 34(16): 5689-703. 649
Mander BA, Marks SM, Vogel JW, Rao V, Lu B, Saletin JM, et al. beta-amyloid disrupts human 650
NREM slow waves and related hippocampus-dependent memory consolidation. Nature 651
neuroscience 2015; 18(7): 1051-7. 652
Marshall L, Helgadottir H, Molle M, Born J. Boosting slow oscillations during sleep potentiates 653
memory. Nature 2006; 444(7119): 610-3. 654
Massimini M, Huber R, Ferrarelli F, Hill S, Tononi G. The sleep slow oscillation as a traveling 655
wave. The Journal of neuroscience : the official journal of the Society for Neuroscience 2004; 656
24(31): 6862-70. 657
Menon DK, Schwab K, Wright DW, Maas AI. Position statement: definition of traumatic brain 658
injury. Archives of physical medicine and rehabilitation 2010; 91(11): 1637-40. 659
Morawska MM, Buchele F, Moreira CG, Imbach LL, Noain D, Baumann CR. Sleep Modulation 660
Alleviates Axonal Damage and Cognitive Decline after Rodent Traumatic Brain Injury. The 661
Journal of neuroscience : the official journal of the Society for Neuroscience 2016; 36(12): 662
3422-9. 663
Mori S, Oishi K, Jiang H, Jiang L, Li X, Akhter K, et al. Stereotaxic white matter atlas based on 664
diffusion tensor imaging in an ICBM template. NeuroImage 2008; 40(2): 570-82. 665
Murphy M, Riedner BA, Huber R, Massimini M, Ferrarelli F, Tononi G. Source modeling sleep 666
slow waves. Proceedings of the National Academy of Sciences of the United States of America 667
2009; 106(5): 1608-13. 668
Nardone R, Bergmann J, Kunz A, Caleri F, Seidl M, Tezzon F, et al. Cortical excitability changes 669
in patients with sleep-wake disturbances after traumatic brain injury. Journal of 670
neurotrauma 2011; 28(7): 1165-71. 671
Ouellet MC, Beaulieu-Bonneau S, Morin CM. Sleep-wake disturbances after traumatic brain 672
injury. The Lancet Neurology 2015; 14(7): 746-57. 673
Palacios EM, Sala-Llonch R, Junque C, Roig T, Tormos JM, Bargallo N, et al. White matter/gray 674
matter contrast changes in chronic and diffuse traumatic brain injury. Journal of 675
neurotrauma 2013; 30(23): 1991-4. 676
Peters A. Structural changes in the normally aging cerebral cortex of primates. Progress in 677
brain research 2002; 136: 455-65. 678
Piantoni G, Poil SS, Linkenkaer-Hansen K, Verweij IM, Ramautar JR, Van Someren EJ, et al. 679
Individual differences in white matter diffusion affect sleep oscillations. The Journal of 680
neuroscience : the official journal of the Society for Neuroscience 2013; 33(1): 227-33. 681
Pitkonen M, Abo-Ramadan U, Marinkovic I, Pedrono E, Hasan KM, Strbian D, et al. Long-term 682
evolution of diffusion tensor indices after temporary experimental ischemic stroke in rats. 683
Brain research 2012; 1445: 103-10. 684
Riedner BA, Vyazovskiy VV, Huber R, Massimini M, Esser S, Murphy M, et al. Sleep 685
homeostasis and cortical synchronization: III. A high-density EEG study of sleep slow waves 686
in humans. Sleep 2007; 30(12): 1643-57. 687
Rodriguez AV, Funk CM, Vyazovskiy VV, Nir Y, Tononi G, Cirelli C. Why Does Sleep Slow-Wave 688
Activity Increase After Extended Wake? Assessing the Effects of Increased Cortical Firing 689
During Wake and Sleep. The Journal of neuroscience : the official journal of the Society for 690
Neuroscience 2016; 36(49): 12436-47. 691
Sanchez-Vives MV, Massimini M, Mattia M. Shaping the Default Activity Pattern of the Cortical 692
Network. Neuron 2017; 94(5): 993-1001. 693
Sanchez-Vives MV, McCormick DA. Cellular and network mechanisms of rhythmic recurrent 694
activity in neocortex. Nature neuroscience 2000; 3(10): 1027-34. 695
Schonberger M, Reutens D, Beare R, O'Sullivan R, Rajaratnam SMW, Ponsford J. Brain lesion 696
correlates of fatigue in individuals with traumatic brain injury. Neuropsychological 697
rehabilitation 2017; 27(7): 1056-70. 698
Smith SM, Jenkinson M, Johansen-Berg H, Rueckert D, Nichols TE, Mackay CE, et al. Tract-699
based spatial statistics: voxelwise analysis of multi-subject diffusion data. NeuroImage 2006; 700
31(4): 1487-505. 701
Smith SM, Jenkinson M, Woolrich MW, Beckmann CF, Behrens TE, Johansen-Berg H, et al. 702
Advances in functional and structural MR image analysis and implementation as FSL. 703
NeuroImage 2004; 23 Suppl 1: S208-19. 704
Smith SM, Nichols TE. Threshold-free cluster enhancement: addressing problems of 705
smoothing, threshold dependence and localisation in cluster inference. NeuroImage 2009; 706
44(1): 83-98. 707
Spitz G, Maller JJ, O'Sullivan R, Ponsford JL. White matter integrity following traumatic brain 708
injury: the association with severity of injury and cognitive functioning. Brain topography 709
2013; 26(4): 648-60. 710
Steriade M. Grouping of brain rhythms in corticothalamic systems. Neuroscience 2006; 711
137(4): 1087-106. 712
Steriade M, Timofeev I, Grenier F. Natural waking and sleep states: a view from inside 713
neocortical neurons. Journal of neurophysiology 2001; 85(5): 1969-85. 714
Teasdale G, Jennett B. Assessment of coma and impaired consciousness. A practical scale. 715
Lancet (London, England) 1974; 2(7872): 81-4. 716
Timofeev I, Sejnowski TJ, Bazhenov M, Chauvette S, Grand LB. Age dependency of trauma-717
induced neocortical epileptogenesis. Frontiers in cellular neuroscience 2013; 7: 154. 718
Tononi G, Cirelli C. Sleep function and synaptic homeostasis. Sleep medicine reviews 2006; 719
10(1): 49-62. 720
Turrigiano G. Too many cooks? Intrinsic and synaptic homeostatic mechanisms in cortical 721
circuit refinement. Annual review of neuroscience 2011; 34: 89-103. 722
Turrigiano GG, Leslie KR, Desai NS, Rutherford LC, Nelson SB. Activity-dependent scaling of 723
quantal amplitude in neocortical neurons. Nature 1998; 391(6670): 892-6. 724
Vyazovskiy VV, Cirelli C, Tononi G. Electrophysiological correlates of sleep homeostasis in 725
freely behaving rats. Progress in brain research 2011; 193: 17-38. 726
Vyazovskiy VV, Riedner BA, Cirelli C, Tononi G. Sleep homeostasis and cortical 727
synchronization: II. A local field potential study of sleep slow waves in the rat. Sleep 2007; 728
30(12): 1631-42. 729
Winkler AM, Ridgway GR, Webster MA, Smith SM, Nichols TE. Permutation inference for the 730
general linear model. NeuroImage 2014; 92: 381-97. 731
Xie L, Kang H, Xu Q, Chen MJ, Liao Y, Thiyagarajan M, et al. Sleep drives metabolite clearance 732
from the adult brain. Science (New York, NY) 2013; 342(6156): 373-7. 733
Yap QJ, Teh I, Fusar-Poli P, Sum MY, Kuswanto C, Sim K. Tracking cerebral white matter 734
changes across the lifespan: insights from diffusion tensor imaging studies. Journal of neural 735
transmission (Vienna, Austria : 1996) 2013; 120(9): 1369-95. 736
TABLE 1. Demographic characteristics, questionnaires, neuropsychological assessment and sleep macro-architecture
TBI (n = 23) Controls (n= 27) t-value (p-value)
Age (years) 30.5 (11.1) 30.3 (13.4) 0.1 (0.95)
Sex (nb. of male/female) 17/6 21/6 0.3 (0.75)
Education (years) 13.0 (3.3) 15.2 (2.1) 2.9 (0.006)
GCS at hospital admission 8.5 (3.3) - -
Length of posttraumatic amnesia (days) 17.0 (17.6) - -
Time after injury (months) 23.4 (9.4) - -
Return to work/school (%) 60 - -
Questionnaires
Fatigue Severity Scale 40.1 (16.1) 30.7 (11.1) 2.4 (0.02)
Epworth Sleepiness Scale 8.4 (5.7) 6.5 (4.1) 1.3 (0.19)
Pittsburgh Sleep Quality Index 6.7 (3.2) 4.2 (2.5) 2.9 (0.005)
Beck Anxiety Inventory 9.3 (10.0) 4.6 (6.3) 2.1 (0.04)
Beck Depression Inventory II 17.4 (10.7) 4.9 (6.0) 5.2 (<0.001)
Neuropsychological assessment
Trail Making Test A time (sec) 30.8 (13.1) 25.6 (9.2) 1.6 (0.13)
Trail Making Test B time (sec) 84.0 (35.0) 63.8 (26.3) 2.2 (0.03)
Color-Word interference 1 time (sec) 31.6 (6.1) 27.4 (4.6) 2.6 (0.01)
Color-Word interference 3 time (sec) 60.0 (13.4) 50.0 (12.6) 2.7 (0.01) Color-Word interference 4 time (sec) 68.5 (19.7) 50.3 (8.3) 4.3 (<0.001) Hopkins Verbal Learning Test (total learning) 23.6 (5.3) 26.1 (3.7) 1.9 (0.07) Sleep macro-architecture on PSG
Sleep latency (min) 16.1 (16.7) 20.3 (29.1) 0.6 (0.53)
REM sleep latency (min) 106.0 (90.7) 114.1 (62.6) 0.4 (0.72)
Total sleep time (min) 465.7 (59.4) 441.0 (59.5) 1.5 (0.15)
Number of awakenings 33.8 (13.3) 27.8 (10.8) 1.7 (0.09)
Wake after sleep onset (min) 57.8 (46.1) 48.0 (33.7) 0.8 (0.41)
Apnea-hypopnea index (events/hour) 2.6 (3.5) 2.2 (2.5) 0.5 (0.63)
Sleep efficiency (%) 88.6 (9.7) 90.2 (6.8) 0.7 (0.52)
Stage N1 sleep (%) 11.7 (6.2) 10.5 (5.2) 0.7 (0.48)
Stage N2 sleep (%) 53.7 (7.1) 52.5 (6.4) 0.6 (0.53)
Stage N3 sleep (%) 16.4 (9.7) 17.9 (8.9) 0.6 (0.56)
REM sleep (%) 18.3 (4.4) 19.1 (5.4) 0.6 (0.55)
Data are presented as mean (standard deviation), when applicable. TBI: Traumatic brain injury, GCS: Glasgow Coma Scale, PSG: Polysomnography, REM: Rapid eye movement
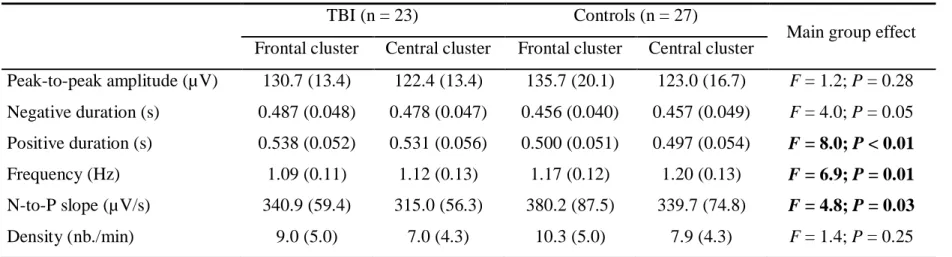
TABLE 2. Results of the Group X Electrode cluster ANOVAs on slow wave characteristics
TBI (n = 23) Controls (n = 27)
Main group effect Frontal cluster Central cluster Frontal cluster Central cluster
Peak-to-peak amplitude (µV) 130.7 (13.4) 122.4 (13.4) 135.7 (20.1) 123.0 (16.7) F = 1.2; P = 0.28 Negative duration (s) 0.487 (0.048) 0.478 (0.047) 0.456 (0.040) 0.457 (0.049) F = 4.0; P = 0.05 Positive duration (s) 0.538 (0.052) 0.531 (0.056) 0.500 (0.051) 0.497 (0.054) F = 8.0; P < 0.01 Frequency (Hz) 1.09 (0.11) 1.12 (0.13) 1.17 (0.12) 1.20 (0.13) F = 6.9; P = 0.01 N-to-P slope (µV/s) 340.9 (59.4) 315.0 (56.3) 380.2 (87.5) 339.7 (74.8) F = 4.8; P = 0.03 Density (nb./min) 9.0 (5.0) 7.0 (4.3) 10.3 (5.0) 7.9 (4.3) F = 1.4; P = 0.25
No interaction or cluster effects were observed. Data are presented as mean (standard deviation). TBI: Traumatic brain injury, N-to-P: Negative to positive
FIGURE 1. Group differences on diffusion metrics. TBSS voxel-wise contrasts between traumatic brain injury (TBI) and control (CTL) groups (blue, TBI < CTL; red to yellow, TBI > CTL) for (a) fractional anisotropy (FA), (b) mean diffusivity (MD), (c) axial diffusivity (AD), and (d) radial diffusivity (RD). Significant results are overlaid over the MNI152 T1 1mm brain and the mean fractional anisotropy skeleton (in green). Significant increases in the TBI group compared to the Control group are shown in the red to yellow scale and significant decreases are shown in light blue. The mean value of all significant clusters is represented on the graph for each subject. Significant results were thresholded at p<0.05 controlled for age and corrected for multiple comparisons.
FIGURE 2. Slow wave amplitude and white matter damage. Areas in traumatic brain injury (TBI) group where slow wave amplitude is positively correlated (red to yellow colored areas) with (a) mean diffusivity (r = 0.81), (b) axial diffusivity (r = 0.74), and (c) radial diffusivity (r = 0.78). Significant results are overlaid over the MNI152 T1 1mm brain and the mean fractional anisotropy skeleton (in green). The correlation between the mean value of all significant clusters and slow wave amplitude is represented on the graphs. No area of negative correlation was found in the TBI group and no significant correlation was found for the control group. Results are thresholded at p<0.05, adjusted for age and corrected for multiple comparisons.
FIGURE 3. Slow wave slope and white matter damage. Areas in traumatic brain injury (TBI) group where slow wave negative-to-positive slope is correlated (red to yellow, positive correlation) with axial diffusivity (r = 0.64). Significant results are overlaid over the MNI152 T1 1mm brain and the mean fractional anisotropy skeleton (in green). The correlation between the mean value of all significant clusters and slow wave N-to-P slope is represented on the graph. No area of negative correlation was found in the TBI group and no significant correlation was found for the control group. Results are thresholded at p<0.05, adjusted for age and corrected for multiple comparisons.
FIGURE 4. Slow wave negative phase duration and white matter damage. Areas in traumatic brain injury (TBI) group where slow wave negative phase duration is correlated (blue, negative correlation; red to yellow, positive correlation) with (a) fractional anisotropy (r = -0.69) and (b) mean diffusivity (r = 0.73). Significant results are overlaid over the MNI152 T1 1mm brain and the mean fractional anisotropy skeleton (in green). The correlation between the mean value of all significant clusters and slow wave negative phase duration is represented on the graphs. No significant correlation was found for the control group. Results are thresholded at p<0.05, adjusted for age and corrected for multiple comparisons.
FIGURE 5. Relative slow-wave activity power in the 1st sleep cycle and white matter damage. Areas in traumatic brain injury (TBI) group where slow wave activity power is correlated (blue, negative correlation; red to yellow, positive correlation) with (a) fractional anisotropy (r = -0.63), (b) mean diffusivity (r = 0.70), and (c) radial diffusivity (r = 0.65). Significant results are overlaid over the MNI152 T1 1mm brain and the mean fractional anisotropy skeleton (in green). The correlation between the mean value of all significant clusters and relative slow-wave activity power is represented on the graphs. No significant correlation was found for the control group. Results are thresholded at p<0.05, adjusted for age and corrected for multiple comparisons.
FIGURE 6. Self-reported fatigue and white matter damage. Areas in traumatic brain injury (TBI) group where fatigue is correlated (red to yellow, positive correlation) with axial diffusivity (r = 0.66). Significant results are overlaid over the MNI152 T1 1mm brain and the mean fractional anisotropy skeleton (in green). The correlation between the mean value of all significant clusters and fatigue is represented on the graph. No area of negative correlation was found in the TBI group, and no significant correlation was found for the control group. Results are thresholded at p<0.05, adjusted for age and corrected for multiple comparisons.
SUPPLEMENTARY TABLE I. Prescribed medication intake of participants with traumatic brain injury
Patient ID Name of medication Dose (mg) Frequency of intake Additional comments 1 Methyphenidate (Ritalin®) Escitalopram (Cipralex®) Quetiapine (Seroquel®) Ibuprofen (Advil®) 20 20 25 200 2 / day 2 / day 1 / day 3 / day
Ceased Ritalin 3 days before testing
2 Methyphenidate (Concerta®) Methyphenidate (Concerta®) 27 18 1 / day 1 / day
Ceased all 7 days before testing
3 Venlafaxine (Effexor®) Trazodone (Apo-Trazodone®) Methyphenidate (Concerta®) 37.5 50 36 1 / day 2 / day 2 / day
4 Venlafaxine (Effexor®) 75 1 / day
5 Divalproex (Epival®) 500 2 / day
6 Methyphenidate (Concerta®) 54 1 / day
7 Amitriptyline (Elavil®) Ibuprofen (Advil®) 15 200 1 / day 1 / day
Ceased all 3 days before testing
8 Lisdexamfetamine (Vyvance®) 60 1 / day Ceased all 4 days before testing Participants with no medication intake are not represented in this table
SUPPLEMENTARY FIGURE 1. Representative morphological characteristics of a slow wave. This slow wave represents the average (and standard deviation, in dotted lines) of every individual slow wave detected for all 27 healthy controls on selected frontal and central derivations (F3, F4, Fz, C3, C4, Cz). The detection occurred during the NREM N2 and N3 sleep stages for all sleep cycles of the night. The following characteristics can be seen on this figure: peak-to-peak amplitude (voltage difference from B to D), frequency (oscillation speed), negative-to-positive slope (slope from B to D), negative phase duration (time from A to C), and positive phase duration (time from C to E).
SUPPLEMENTARY FIGURE 2. Markers of traumatic brain injury severity and white matter damage. Areas in traumatic brain injury (TBI) group where markers of severity are correlated (blue, negative correlation; red to yellow, positive correlation) with (a) fractional anisotropy (r = 0.77), (b) mean diffusivity (r = 0.93), (c) radial diffusivity (r = -0.77), and (d) axial diffusivity (r = 0.83). Significant results are overlaid over the MNI152 T1 1mm brain and the mean fractional anisotropy skeleton (in green). The correlation