All-weather vision for automotive safety: which spectral band?
N. Pinchon
1, M. Ibn-Khedher
1, O. Cassignol
2, A. Nicolas
2, F. Bernardin
3, P. Leduc
4, J-P. Tarel
5,
R. Brémond
5, E. Bercier
6, G. Julien
71: VALEO, 34 rue Saint André 93012 Bobigny Cedex, France 2: SAGEM, 21 Avenue du Gros chêne 95610 Éragny Sur Oise, France 3: CEREMA, 8-10 rue Bernard Palissy 63017 Clermont-Ferrand Cedex 2, France
4: CEA / Léti - 17 rue des Martyrs - 38054 Grenoble cedex 9, France
5: IFSTTAR / LEPSIS, 14-20 Boulevard Newton, Cité Descartes, 77447 Marne la Vallée Cedex 2, France 6: ULIS, 364 Route de Valence - ZI Les Iles Cordées BP 27 - 38113 Veurey-Voroize, France
7: NEXYAD, 95 Rue Pereire 78100 Saint-Germain-en-Laye, France
Abstract: The AWARE (All Weather All Roads Enhanced vision) French public funded project is aiming at the development of a low cost sensor fitting to automotive and aviation requirements, and enabling a vision in all poor visibility conditions, such as night, fog, rain and snow.
In order to identify the technologies providing the best all-weather vision, we evaluated the relevance of four different spectral bands: Visible RGB, Near-Infrared (NIR), Short-Wave Near-Infrared (SWIR) and Long-Wave Infrared (LWIR). Two test campaigns have been realised in outdoor natural conditions and in artificial fog tunnel, with four cameras recording simultaneously.
This paper presents the detailed results of this comparative study, focusing on pedestrians, vehicles, traffic signs and lanes detection.
Keywords: vision, visibility, bad weather, fog, infrared
1. Introduction
In the automotive industry, New Car Assessment Programs are increasingly pushing car manufacturers to improve performances of Advanced Driver Assistance Systems (ADAS), and especially autonomous emergency braking on vulnerable road users (VRU). For instance the 2018 Euro Ncap roadmap is moving towards pedestrians and pedal cyclists detection in day and night conditions.
This trend matches accidentology figures, like those provided by French Road Safety Observatory [1]:
Injury casualties Fatalities
Night 32% 41%
Wet road 20% 20%
Adverse weather 21% 23%
Table 1: 2014 French accidentology data in adverse conditions
In the longer term, after automated parking and highway driving, all weather and city driving will be the main technical challenges in the automated driving roadmap.
Current ADAS sensors as visible cameras or Lidars are fitting functional requirements of VRU and obstacle detection in normal conditions (day or night). However, these technologies show limited performances in adverse weather conditions such as fog or rain.
Automotive industry is thus facing this new challenge of detecting vehicle environment in all conditions, and especially in poor visibility conditions, such as night, fog, rain and snow.
This topic has been addressed in the framework of the AWARE French public funded project, aiming at the development of a sensor enabling a vision in all poor visibility conditions. This paper presents an experimental comparative study of four different spectral bands: Visible RGB, Near-Infrared (NIR), Short-Wave Infrared (SWIR) and Long-Wave Infrared (LWIR). Sensors and field tests are described in section 2 and 3. Experimental results are detailed in section 4, focusing on pedestrians, vehicles, traffic signs and lanes detection.
2. Sensors
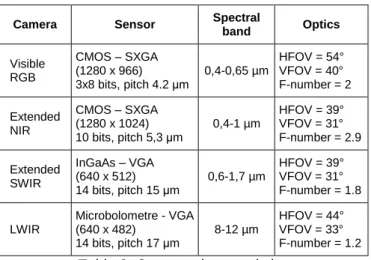
In this project, we only focus on cameras technologies, and not on distance measurement systems like LIDARs or RADARs. But it is well-known that both technologies are complementary and necessary to bring redundancy and complementary characteristics for improving the detection system’s reliability and accuracy [2]. Four cameras were tested during the project. The Table 2 shows their characteristics.
The visible RGB CMOS camera is used here as a reference for the test.
Camera Sensor Spectral band Optics Visible RGB CMOS – SXGA (1280 x 966) 3x8 bits, pitch 4.2 μm 0,4-0,65 µm HFOV = 54° VFOV = 40° F-number = 2 Extended NIR CMOS – SXGA (1280 x 1024) 10 bits, pitch 5,3 μm 0,4-1 µm HFOV = 39° VFOV = 31° F-number = 2.9 Extended SWIR InGaAs – VGA (640 x 512) 14 bits, pitch 15 μm 0,6-1,7 µm HFOV = 39° VFOV = 31° F-number = 1.8 LWIR Microbolometre - VGA (640 x 482) 14 bits, pitch 17 μm 8-12 µm HFOV = 44° VFOV = 33° F-number = 1.2 Table 2: Camera characteristics
Extended NIR camera uses monochrome CMOS photodiodes with a cut-off wavelength close to 1 µm. It detects the reflective visible and NIR light from the scene. It thus requires an illumination by sun, moon or night glow or an illuminator positioned on the vehicle.
Extended SWIR camera is based on InGaAs III-V material and extends from a wavelength of 0.6 µm, red to human eye, to 1.7 µm in the SWIR infrared band. SWIR spectral band is typically used for active (reflective) vision in very dark condition with a good contrast as SWIR light is generally more reflective than visible light.
LWIR sensor is an array of microbolometers. It detects the thermal radiation in the spectral band extending from 8 µm to 14 µm. Any object emits radiations which depend on its temperature. For a human or an animal at ambient temperature, the maximum of emission corresponds to a wavelength close to 10µm. LWIR is used for the detection of a temperature contrast and do not require an illuminator.
Mid-Wave Infrared (MWIR) has not been added in the study for reasons of cost and compacity, due to the cooling system required for the detectors.
3. Field tests 3.1 Outdoor test campaign
The four cameras were installed during one month in 2015 along the French motorway A75/E11 at the site La Fageole. A weather station located near the cameras was equipped with a diffusometer (meteorological visibility), a rain gauge, a luxmeter (ambient light) and a temperature and humidity sensor (ambient air).
Figure 1: Outdoor test campaign
More than 33 different scenarios have been set depending on weather conditions (rain type and intensity, ambient temperature), ambient light, and human eye visibility distance. Table 3 shows the most interesting scenarios, with a class 3 fog (visibility distance < 100 m):
Scenario Weather Visibility distance Ambient light Tempe-rature 7 Day, heavy
fog, light snow 75 m 5032 lux -1°C
11 Day, heavy
fog and snow 69 m 1096 lux -1°C
22
Day low light, heavy fog and snow
75 m 104 lux -0.8°C
26 Night, heavy
fog 99 m 0 lux +1.5°C
Table 3: Most interesting outdoor scenarios
3.2 Tunnel test campaign
The tests were carried in the CEREMA fog tunnel (30m length, 5.5m width and 2.5m height). Artificial fog and rain are reproduced and controlled: fog and rain drop size, meteorological visibility of fog and rain intensity. Two fog classes are available: unimodal drop size distribution (DSP) centred around 1 micron and bimodal DSP centred around 1.5 and 10 microns. 74 scenarios were performed by varying the type of adverse weather conditions (fog and rain), scene illumination (night, day, automotive lighting, aircraft lighting) and glare (front vehicle). The scene in front of the cameras contained road pavement, road marking, pedestrians and lights (see Figure 2).
4. Experimental results
In this section, we describe the detection and recognition range performances that were measured in this study. It is important to keep in mind that these results reflect not only the intrinsic characteristics of the spectral bands but also the capability of the chosen cameras. The cameras were selected to be representative of the typical current state-of-the-art.
In order to prevent any detection algorithm artefact, a visual analysis has been performed by two different human observers. As expected, exact detection range values differed from one observer to the other, but the relative values were consistent. In all cases, brightness and contrast were carefully tuned in order to optimize ranges.
With respect of each camera’s channels created by the four spectral bands, a video database has been created to remotely record videos of relevant scenes for each listed scenario. The Figure 3 provides a sample of the video database (outdoor campaign):
Figure 3: Example of video records by LWIR (top left), Visible (top right), SWIR (bottom left) and NIR
(bottom right) cameras 4.1 Pedestrian detection
Pedestrian detection tests have been performed into Cerema fog tunnel using real human bodies, as illustrated in the Figure 4.
Objects moving in the fog generate important transmission inhomogenities. In order to avoid errors due to this effect, we recorded films of human test subjects standing still at the end of the tunnel while the fog cleared over time. Detection was declared successful when the outline of the chest of the test subject became visible against the background. This way, detection ranges were measured at the height at which the transmission meter was set. The test subjects were ~ 25 m away from the cameras. One of the test subjects wore a high visibility jacket and another one wore dark clothes. As expected, Visible, NIR and SWIR detection performances were better
for the subject wearing the high visibility jacket (even though this improvement less pronounced for thicker fog). For this study, the case of the subject in dark clothes was deemed more relevant.
Figure 4: Pedestrian detection test setup into Cerema fog tunnel, LWIR (top left), Visible (top right), SWIR (bottom left) and NIR (bottom right)
cameras
The following table gives the fog density, expressed as standard visibility ranges, at which the pedestrian becomes visible. A reduced visibility range indicates a successful pedestrian detection in a thicker fog, and hence a better capability to see through fog. Cases with glare are not included.
Camera Fog density for pedestrian detection Visible RGB Moderate (visibility range = 47 ± 10 m) Extended NIR High (visibility range = 28 ± 7 m) Extended SWIR High (visibility range = 25 ± 3 m) LWIR Extreme (visibility range = 15 ± 4 m) Table 4: Fog thickness for pedestrian detection at
25 m with the different cameras
Error bars mostly reflect the dispersion between the different scenarios used in the study.
Conclusions are the following:
The LWIR camera has a better capability to see through fog than the NIR and SWIR ones. The visible camera has the lowest fog piercing capability.
The LWIR camera is the only one that allows pedestrian detection in full darkness.
The LWIR camera also proved more resilient to glare caused by facing headlamps in the fog. Other cameras sometimes missed a pedestrian because she or he was hidden by the glare.
Figure 5: example of images recorded in the fog tunnel with the four different cameras 4.2 Vehicle detection and recognition
Vehicle detection ranges were measured in the outdoor test campaign.
Similarly to military range performance tests, we define two tasks of interest: detection and recognition. Detection means the presence of an object on the road can been acknowledged, even if the type of object cannot be assessed. Recognition means that the detected object can be classified into a category such as: truck, car, motorcycle, bicycle, pedestrian, animal, static obstacle… In particular, VRU can be distinguished from other vehicles. The next figure illustrates detection and recognition in two different spectral bands (images are from different scenarios).
Detection
Recognition
Task VIS LWIR
Figure 6: examples of detection and recognition Distances were calibrated within the cameras’ field of view using the road markings (which are clearly visible for all cameras in images recorded on a sunny day) and an aerial map of the area. That method gives a distance measurement precision on the order of a few meters simply by noting the vehicle position within an image. The maximal distance that could be reliably assessed by this method was on the order of 150 m.
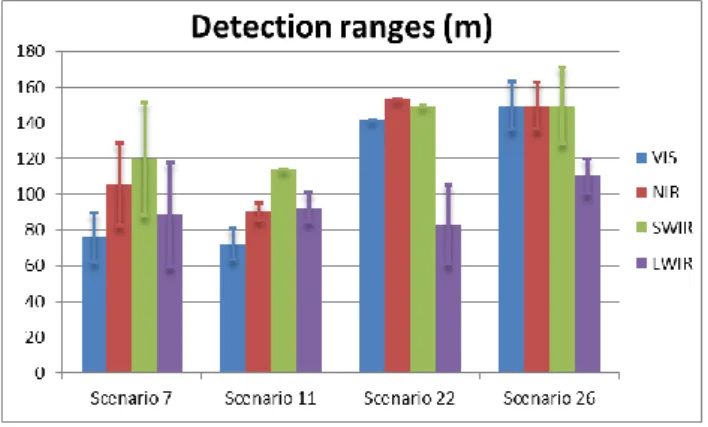
Figure 7: Reference of range based on site map analysis and T1 lanes type of road marking Average detection and recognition ranges are given in the following figures for the different spectral bands and for each of the four scenarios of interest. A total of 22 vehicles were observed. Error bars give the dispersion between the different vehicles observed within a given scenario.
Figure 8: Vehicle detection ranges
Figure 9: Vehicle recognition ranges (except cases with vehicle hidden by glare)
In VIS, NIR or SWIR, detection was performed using the vehicle headlamps. The case of a vehicle driving with headlamps off while in adverse conditions was not encountered in this study. Should it happen, however, detection ranges in VIS, NIR and SWIR
would be on the order of the recognition ranges. In LWIR, detection relied on the observation of hot vehicle parts: the wheels, the motor or the exhaust system.
In some foggy instances, recognition proved difficult or even impossible in VIS, NIR or SWIR because the vehicle remained entirely hidden by the glare of its own headlamps. This was particularly frequent in the SWIR band for facing vehicles. When this happened, the vehicles were not taken into account in the average ranges given in Figure 9. Images illustrating this phenomenon are given in the next figure. It is an intrinsic characteristic of the spectral band and it does not depend on the particular camera technology used.
VIS NIR SWIR LWIR
Figure 10: Images showing the glare effect in the VIS, NIR and SWIR spectral bands.
The visual observation of the videos also confirmed the well-known fact that the exploitation of movement by the human visual system greatly increases detection capabilities: the success of the detection task is much higher when performed while watching a film than when performed by observing still images taken from the very same film. This is due to the human visual cortex implementing advanced spatiotemporal denoising algorithms and should inspire detection software developers.
In some recordings, wild animals are visible on the side of the road in the LWIR band. These animals are visible in none of the other spectral bands. The conclusions are the following:
For vehicles with headlights on in adverse conditions, detection is better in SWIR. NIR comes next and then VIS and LWIR.
For the recognition task in the same conditions, the conclusions are opposed.
The SWIR band is extremely sensitive to glare in foggy conditions, making the recognition task impossible in many cases.
For both tasks, the LWIR camera gives much more reproducible results than all the others. In particular, its performance is independent of the vehicle’s headlights being on or off.
The LWIR camera was also the only one allowing the detection of hot blooded animals on the side of the road in adverse conditions.
4.2 Road marking detection
Road markings ranges were evaluated in the outdoor test campaign by using the road lines of the highway. The same calibration as for vehicle detection was used to measure the distances. The following table gives the average maximal detection distance for the four scenarios of interest:
Sce-nario Visibi-lity [m] Ambi-ent light [Lux]
Maximal detection range [m]
VIS NIR SWIR LWIR
Road Marking detection
7 75 5032 53 63 66
-77 69 1096 50 60 63
-22 75 104 53 60 63
-26 99 0 53 53 53
-Table 5: Road lines detection ranges Conclusions are the following:
Observation in the LWIR spectral band is only depending on road marking thermal emissivity. In 15 of the 21 scenarios recorded in LWIR, road markings are not visible. The visibility depends on the weather: rain is cleaning the lines while sun exposure enhances them (see Figure 11). Thus road marking observation in the LWIR spectral band is not relevant.
Visible, NIR and SWIR all required additional lighting to detect road marking at night. Detection in NIR and SWIR are equivalent, and slightly better than VIS. This is due in part to: a broader overall spectral band, monochromaticity (no RGB filter), larger pixels and a higher bit depth.
Figure 11: Road marking observation in the LWIR spectral band during day sunny condition (left) and
day rainy condition (right)
4.4 Traffic signs recognition
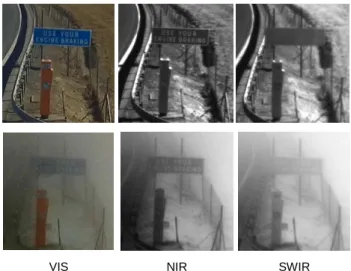
The traffic sign located at 38 m from the cameras on La Fageole test site has been used to realize the comparative study. The Figure 12 shows the sign in two different weather conditions.
Conclusions of the analysis of all the scenarios are the following:
The SWIR sensor does not allow the identification of the traffic sign, even during daylight. This is due to the fact that the difference of reflectivity between the letters and the background is very low in the SWIR band. Traffic signs are indeed designed for visible spectrum and not for the other bands.
The NIR camera provides a good vision and a better SNR than the RGB visible camera, especially in adverse weather conditions. This is due to the same reasons as for road markings detection.
As expected, the traffic sign is never identifiable in the LWIR band. Letters and background have indeed the same temperature and emissivity.
VIS NIR SWIR
Figure 12: Images of traffic sign acquired in different spectral bands. First line conditions is a sunny day and second line is from scenario 7 (fog class 3 with
snow) 4. Conclusion
As they are complementary to other distance measurement systems like LIDARs or RADARs, the AWARE project only focused its experiments on cameras technologies that are necessary to bring redundancy and complementary characteristics for improving ADAS detection system’s reliability and accuracy.
In order to detect pedestrian, vehicle, road marking or recognize traffic signs, the relevance of four different spectral bands has been evaluated under adverse weather conditions: Visible RGB, Near-Infrared (NIR), Short-Wave Near-Infrared (SWIR) and Long-Wave Infrared (LWIR).
The Table 13 and Table 14 compare performances of ADAS function for the four different cameras.
ADAS FUNCTION
Camera Spectral band Night Fog, using headlights
VIS NIR SWIR LWIR
Pedestrian, Bicycles, Animals detection + ++ ++ ++++ Vehicle shape recognition - - -- ++ Vehicle lights detection + ++ +++ -- Traffic signs recognition + ++ - -- Road marking detection + ++ ++ -
Table 13: Comparison of performances of ADAS functions using Visible, NIR, SWIR or LWIR camera
technologies, Night fog, headlights
ADAS FUNCTION
Camera Spectral band Day Fog, using headlights
VIS NIR SWIR LWIR
Pedestrian, Bicycles, Animals detection + ++ ++ ++++ Vehicle shape recognition + ++ ++ ++ Traffic signs recognition + ++ - -- Road marking detection + ++ ++ -
Table 14: Comparison of performances of ADAS functions using Visible, NIR, SWIR or LWIR camera
technologies, Day fog, headlights Results of experiment clearly state that:
- In addition to the visible spectral band, only the LWIR spectral band provides outstanding interests. Targets can be detected with or without additional light. LWIR detection is not sensitive to any dazzle, - NIR and SWIR provide equivalent performances, mainly due to the fact that experiments used extended visible to NIR and visible to SWIR cameras,
- Visible RGB extended to NIR (or Red-Clear sensors) combined with LWIR provide the best spectral bands combination to improve ADAS performances of detection such as vehicle, pedestrian, bicycle, animals or road marking, and recognition such as traffic signs.
Caution shall be considered while using LED headlight technology to provide additional light. LED
pulsed technology could reduce detection reliability of system based on Visible, NIR and SWIR cameras.
5. Acknowledgement
The authors acknowledge the contribution of their colleagues to this work: P. Morange, J-L. Bicard and all the pedestrians from CEREMA, A. Picard from Sagem and B. Yahiaoui from Nexyad.
7. References
[1] French Road Safety Observatory (ONISR): "Les
accidents corporels de la circulation 2014 – Recueil de données brutes", May 2015.
[2] C. Premebida, O. Ludwig, and U. Nunes: “Lidar and vision-based pedestrian detection system,” Journal of Field Robotics, vol. 26, no. 9, pp. 696–711, 2009
8. Glossary
ADAS: Advanced Driver Assistance Systems AWARE: All Weather All Roads Enhanced vision LIDAR: LIght Detection And Ranging
LWIR: Long-Wave Infrared
NCAP: New Car Assessment Programs NIR: Near Infrared
RADAR: RAdio Detection And Ranging RGB: Red-Green-Blue
SWIR: Short-Wave Infrared VRU: Vulnerable Road User