CENTER FOR INTERDISCIPLINARY RESEARCH ON MEDICINES
Included spectral range (cm-1) Preprocessing
NIR A [930-7500] [6200-5736] SNV; Mean center
NIR B [937-1584] Savitzky-Golay 1st Derivative (order: 2, window: 17); SNV; Mean center
Application of vibrational spectroscopy and chemometrics to assess the
quality of locally produced antimalarial medicines in the Democratic Republic
of Congo.
1University of Liege (ULiege), CIRM, Vibra-Santé Hub, Department of Pharmacy, Laboratory of Pharmaceutical Analytical Chemistry, Liege, Belgium; 2University of Kinshasa, Faculty of Pharmaceutical Sciences, LACOMEDA, Lemba, 212 Kinshasa XI, DR. Congo;
3Pharmakina, Agro-industrial and pharmaceutical enterprise, Bukavu, South Kivu, DR. Congo;
4University of Yaoundé I, Faculty of Medicine and Biomedical Sciences and National Drug Control and Valuation (LANACOME), Cameroon; 5University of Kisangani, Department of Pharmacy, Kisangani, DR. Congo.
1
.
Introduction
5
.
Conclusion
4
.
Results and discussion
References
P.H. Ciza
1,2, P.-Y. Sacre
1, M. Kanyonyo
3, C. Waffo
1,4, M. Borive
5, L. Coïc
1, J.K. Mbinze
2, Ph Hubert
1E. Ziemons
1, R.D. Marini
1Check our publications
The developed method was successfully validated using the total error approach with acceptance limits of ± 10 %. The opportunity to use gravimetric data as reference allowed obtaining quantitative performances comparable to HPLC methods.
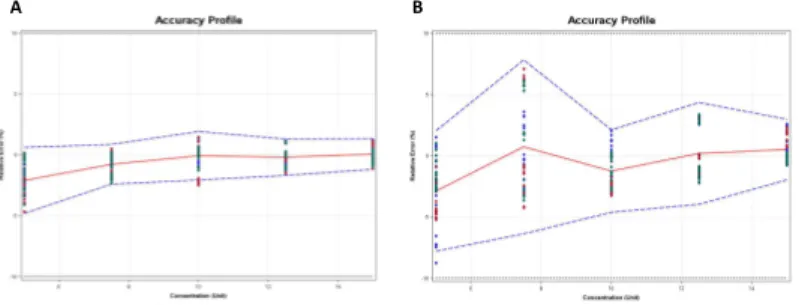
Considering the accuracy profile, NIR based on PLS regression model was
successfully developed and validated using the total error approach with acceptance limits fixed at 10% at the 5 levels of the target concentration with both benchtop and low-cost handheld NIR transmission spectrophotometers.
A comparison of developed methods showed that both could be used to verify the
quality of quinine samples. 20 samples collected in the Congolese pharmaceutical market were analyzed by both techniques. All samples were conform since their quinine content was within in ± 10% of the theoretical value.
This study constitutes the first step for the implementation of a field quality control
method for quinine based medicines.
3.Material and Methods
The objective was to develop and validate PLS regression models using NIR spectroscopy data to replace the high solvent consuming techniques such as HPLC. Indeed, routine HPLC analyses are difficult to perform in low- and middle-income countries due to the supply and price of reagents and solvents.
Furthermore, liquid chromatography devices often suffer from technical issues needing specialized technicians. The driven idea for the development of the quantitative method was the ease of implementation and use by low skilled staff together with the possibility to analyze different formulations of quinine; whether it is sulphate or hydrochloride salts.
The method is considered as valid within the acceptance limits as shown in Fig 2. This approach gives the guarantee that the analytical error of each further measurement of unknown samples is included within the tolerance limits at the +/-10% acceptance limits with a 5.0 % risk level.
A B
2. Objectives
In recent decades, more than 15% of antimalarials marketed in low- and middle-income countries were of poor quality, in which quinoline derivatives and quinine-based formulations represent 21%. These molecules are used for severe and/or cerebral malaria, as well as for falciparum-resistant malaria treatment [1,2]. This research work deals with the opportunity of using vibrational spectroscopy techniques combined with chemometrics for the quality control of local production of antimalarial drugs. Near Infrared (NIR) spectroscopy was chosen for its low-cost and rapid testing properties as well as the possibility to transfer calibrations to handheld devices to control medicines directly on field [3,4].
Figure 2. (a) Accuracy profile of the NIR-A quantitative PLS model and (b) Accuracy profile of the NIR-B quantitative PLS model. The plain red, dashed blue and dashed black lines represent the relative bias, the β-expectation tolerance limits (β=95%) and the acceptance limits; respectively.
Multivariate analysis methods based on NIR spectroscopy have been developed and validated for the quality control of quinine based formulations manufactured and marketed in the Democratic Republic of Congo (DRC).
The samples are prepared by dissolution in an aqueous HCl 1N solution that is a cheap and easily available medium in low- and middle-income countries.
Calibration and validation samples were prepared by dissolving reference quinine sulfate and quinine hydrochloride in the presence of excipients using gravimetric data as reference. The final target concentration was 10 % w/v. Three series of validation were realized with five concentration levels. A background was measured between each series for the NIR A while the NIR B was shut down, restarted and warmed-up during 1 hour between each series.
After being validated, the method was used to analyze commercial quinine tablets and oral drops and intravenous solutions collected in the local market.
Table 1 : Characteristics of NIR spectrophotometers - Instrumentation:
- Methodology: Table 3. Results of quantification of 10 samples with NIR-A and NIR-B PLS models. Results arepresented as predicted content of the label claimed (%) of the active ingredient.
Twenty samples collected in the local market were analyzed with the two validated PLS models. As shown in Table 3, the two methods generally predicted each sample correctly.
Thus demonstrating that the developed NIR methods could be applied on field by using handheld spectrometers.
B A
Code
name spectroscopy ManufacturerVibrational Model measured (nm) data points Weight (kg)spectral range price (k€)
NIR A FT-NIR Bruker OpticsMPA (internaltransmission) 800 - 2500 2203 benchtop ~ 100
NIR B dispersive NIR Innospectra NIR-M-T1 900-1700 256 0.14 ~ 2
Table 2. Figure of merits of PLS models.
Figure 1. (A) NIR-A predicted PLS model; (B) NIR-B predicted PLS model.
These results show that the developed models could quantitatively be used to analyze most of quinine formulations. The advantage of dissolving quinine is the possibility to analyze with the same PLS model both tablets, oral drops and intravenous solutions. This is not surprising since the liquid samples are constituted mainly of quinine dihydrochloride and water, whereas the excipients are less than 1% (W/V). Nevertheless, the present method is not applicable to the analysis of syrups.
90 92 94 96 98 100 102 104 106 108 0 5 10 15 20 25 Pr ed ic te d pe rc en ta ge o f l ab el c la im ed (% ) Sample ID NIR-A NIR-B
Samples Dosage forms NIR-A NIR-B
1 Tablets 300 mg 97.58 95.18 2 Tablets 300 mg 99.99 91.58 3 Tablets 300 mg 100.32 94.44 4 Tablets 300 mg 97.57 96.87 5 Tablets 300 mg 96.46 93.5 6 Tablets 500 mg 94.7 95.86 7 Tablets 500 mg 99.23 96.78 8 Tablets 500 mg 100.66 98.73 9 Tablets 500 mg 96.78 96.85 10 Tablets 500 mg 99.97 96.57 11 Oral drops 20% 103.15 100.76 12 Oral drops 20% 104.63 98.07 13 Oral drops 20% 103.81 99.06 14 Oral drops 20% 101.83 100.74 15 Oral drops 20% 104.64 101.77 16 Solution 500mg/2ml 105.17 103.21 17 Solution 500mg/2ml 105.33 99.43 18 Solution 500mg/2ml 105.6 99.01 19 Solution 500mg/2ml 105.77 102.33 20 Solution 500mg/2ml 105.12 99.35
Figure 3. Comparison of NIR-A and NIR-B predictions for local market samples
• 1.Local Production and Access to Medicines in Low-and Middle-Income Countries A literature review and critical analysis [Internet]. Available from: https://medeor.de/images/themen/konferenz/Local_Production_Literature_Review.pdf
• 2. Grech J, Robertson J, Thomas J, Cooper G, Naunton M, Kelly T. An empirical review of antimalarial quality field surveys: the importance of characterizing outcomes. J Pharm Biomed Anal. 2018
• 3. Mbinze JK, Sacré P-Y, Yemoa A, Mavar Tayey Mbay J, Habyalimana V, Kalenda N, et al. Development, validation and comparison of NIR and Raman methods for the identification and assay of poor-quality oral quinine drops. J Pharm Biomed Anal. 2015 • 4. Ciza PH, Sacre P-Y, Waffo C, Coïc L, Avohou H, Mbinze JK, et al. Comparing the qualitative performances of handheld NIR and