Tu P05 01
Thermal Response Test in Borehole Heat
Exchangers Equipped with Fiber Optics
G. Radioti* (University of Liège), R. Charlier (University of Liège), F. Nguyen (University of Liège) & J.P. Radu (University of Liège)
SUMMARY
Four double-U borehole heat exchangers (BHEs) of 100m long were installed on the campus of the University of Liège (Liège, Belgium). The installation procedure and technical difficulties are presented. Fiber optic cables are attached along the length of one pipe loop in each BHE. Temperature is measured along the fibers based on the fiber optic distributed temperature sensing (DTS) technique. Thermal response test (TRT) is conducted in order to determine the rock thermal properties. The DTS instrument records the temperature evolution along the pipe loop during the TRT. Rock thermal conductivity through depth can be estimated based on the recorded data. A 3D model is developed using the finite element code LAGAMINE in order to simulate the TRT. The accuracy of the numerical model is improved by
Introduction
In order to study the far-field behavior and the interaction between heat exchangers for shallow (~100m) closed-loop geothermal systems, four double-U borehole heat exchangers (BHEs) of 100m long were installed on the campus of the University of Liège (Liège, Belgium) over a surface area of 32m². Fiber optic cables are attached along the whole length of one pipe loop in each BHE. Different grouting materials will be placed in the boreholes to evaluate their efficiency. Thermal response test (TRT) is conducted and the temperature evolution along the pipe loop is measured based on the fiber optic distributed temperature sensing (DTS) technique and analyzed using analytical methods and finite-element modeling.
Experimental procedure
Each BHE contains two U-pipes (PE100, 32x2.9 mm, SDR11) and the diameter of the boreholes is 13cm. The boreholes are backfilled with the following grouting materials: two of them with a silica sand-based commercial material (Geosolid 235), one with a bentonite-based commercial material (Füllbinder H-hs) and one with a homemade admixture with graphite.
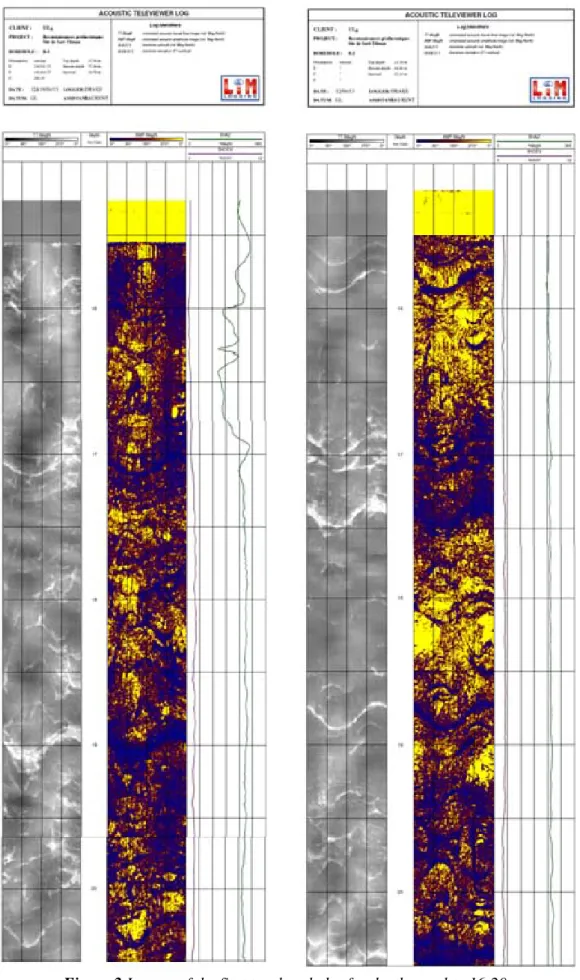
The distance between them is four meters. Three different drill bits are used according to the type of the formation to be drilled: blade bit for soft soil, tricone bit for soft rock formations and hammer bit for hard rock formations. Blade bit is used until 3.5 m depth and hammer bit for the rest 97.5 m for the first borehole (B1). Tricone bit is used until 13.5 m depth and hammer bit for the rest 87.5 m for the second borehole (B2). The boreholes are supported with casing to keep loose soil and altered rock from collapsing into the borehole (until 15.5 m depth for B1 and 13.5 m depth for B2). Afterwards an ultrasonic borehole imager, an instrument that acts as an ultrasonic transducer and receiver, is lowered into the two boreholes until a depth of 75 m in B1 and 100 m in B2 to obtain high-resolution images of the local geology and fracturation. The deviation of the boreholes is shown in Figure 1 and borehole wall images with 360° coverage are shown in Figure 2. Then, double-U pipe is lowered down into the borehole and fiber optic cable is attached by using tape along the length of one pipe loop. Two RTD probes are also attached to verify the fiber optic measurements. The remaining parts of the cables are inserted into the pipes and the grouting material is injected. Afterwards the casing is removed.
Technical difficulties were faced during drilling B2. Water was coming out from B1 while drilling B2. The phenomenon was more intense to a drilling depth of about 75m, where a water column more than 10 m high carried away pieces of altered rock. Rock pieces collapsed into B1 making impossible to lower the ultrasonic borehole imager deeper than 35m. B1 was re-drilled and the imaging was repeated. The imaging data of B2 indicate an extended fractured zone between 75-80m depth, probably quite permeable. Given the relatively small distance between the two boreholes, the high air pressure applied during drilling and the high degree of fracturation of the rocks (see Figure 2) the two boreholes are probably connected at depth.
Temperature is measured along the fibers based on Raman optical time domain reflectometry. A laser pulse is injected into the optical fiber and the light is scattered and reemitted from the observed point. The backscattered light is spread across a range of wavelengths. The Raman backscatter signal, which is temperature sensitive, is interpreted by the DTS instrument. The temperature along the fiber is determined by the intensity of Raman stokes and anti-stokes signals. The position of the temperature reading is determined by the arrival time of the reemitted light pulse.
In order to obtain reliable temperature measurements an offset and gain calibration process for each optical fiber is carried out. Each fiber optic cable used in this experiment consists of two optical fibers. Both ends of the fibers are connected to the DTS instrument (dual-ended configuration). A relatively long cable section (more than 20 m) is placed in water bath at known temperature 11°C. A pump is circulating the water inside the bath to retain a constant temperature. Two Resistance Temperature Detector probes are also placed inside the bath and connected to the DTS instrument. During the measurement the temperature was recorded along the fiber as well as by the two RTD probes. The procedure was repeated for water bath at 45°C temperature. The calibration is carried out based on the two temperature traces (for 11°C and 45°C) and the reference values (RTD probes measurements).
TRT is conducted in order to determine the rock thermal properties (Gehlin 2002). During the TRT water is circulated by a pump at constant flow rate and constant heat is injected in the pipes. The DTS instrument records the temperature evolution along the pipe loop.
Numerical modelling
In parallel, we developed a 3D model using the finite element code LAGAMINE (Charlier et al. 2001, Collin et al. 2002) in order to simulate the TRT using the distributed measurements of temperature. An important advantage of a 3D model is the simulation of the circulating fluid flow along the pipe loop. Moreover layers of rock and soil with different thermal properties and the ground underneath the BHE can be simulated. The initial temperature gradient can be imposed as well as the time-dependent surface temperature. A 2D mesh is created and generated for a depth of 150 m, including 50 m of the rock underneath the BHE. In the radial direction 50 m of rock around the BHE are simulated. We apply as boundary condition constant heat flux at the entrance surface of the pipes. In order to simulate forced convection we apply an equivalent thermal conductivity at the fluid elements. The value of the equivalent thermal conductivity is calibrated according to the measured temperature difference between the entrance and the exit of the pipes.
Example
In the presented case 5kW are constantly injected in the pipes. The surrounding rock is considered homogeneous with saturated thermal conductivity equal to 3.6 W/mK and initial temperature equal to 12°C. Lithological logs of the area (Calembert et al. 1975) and observation of the cuttings during the drillings indicate the bedrock depth at approximately 13m. It probably consists mainly of red and grey sandstones interlayered with shales. The rock thermal conductivity is calculated as geometric mean value regarding a composition of 75% sandstone and 25% shale. The thermal properties of saturated sandstone are taken from Smolarczyk (2003) and that of saturated shale from Nguyen and Lanini
(2012). Figure 3 shows the fluid temperature profile after 50h of operation resulting from the numerical 3D model.
Figure 3 Fluid temperature profile along the pipe loop after 50h of operation (3D numerical model) .
Conclusions
Temperature is recorded only at the entrance and the exit of the pipes during a conventional TRT. In the presented experiment we record the temperature along the pipe loop based on the fiber optic DTS technique. The rock thermal conductivity through depth can be estimated based on the recorded data. The accuracy of the numerical model is improved by simulating the potential variation of the rock thermal conductivity. Moreover, the installation procedure of the BHEs is presented as well as technical difficulties faced during installation.
References
Calembert, L., Monjoie, A. and Polo-Chiapolini, Cl. [1975] Carte géotechnique prototype du Sart Tilman. Gand, Belgium.
Charlier, R., Radu, J.-P. and Collin, F. [2001] Numerical modelling of coupled transient phenomena. Revue Française de Génie Civil 5(6): 719-741.
Collin, F., Li, X.L., Radu, J.-P. and Charlier, R. [2002]. Thermo-hydro-mechanical coupling in clay barriers. Engineering Geology 64: 179-193.
Gehlin, S. [2002] Thermal response test – method development and evaluation. Doctoral Thesis 2002:39. Luleà University of Technology, Sweden.
Nguyen, D. and Lanini, S. [2012] Projet Solargeotherm: modélisations numeériques de transferts thermiques dans le dispositif souterrain d’échange de chaleur-BRGM/RP-59697-FR. 91 p., 63 ill, 5 ann., don’t ann. 5 sur DVD.