UNIVERSITÉ DE MONTRÉAL
Dumping of
Structural Tubes
Injury Analysis of the Canadian Industry
Elena Sanguino
Département de Sciences Économiques
Faculté des Arts et des Sciences
Research Director
Abraham J. Hollander
Contents
INTRODUCTION ... 3
DEFINITON OF CONCEPTS ... 5
Dumping ... 5
Normal value and margin of dumping. ... 6
Material injury ... 7
CASE SUMMARY ... 9
MEASUREMENT OF THE INJURY. ... 14
Effects of the volume of dumped goods ... 14
Effects of dumped goods on prices ... 16
COUNTER ARGUMENTS ... 17
Increase in the price of the hot-rolled steel sheets ... 17
Market Participation of Imports ... 20
WELFARE DISCUSSION ... 26 CONCLUSION ... 27 BIBLIOGRAPHY ... 30 ANNEX ... 31 Figure 1...18 Figure 2...19 Figure 3...20 Figure 4...21 Figure 5...22 Figure 6...23 Figure 7...24 Figure 8...25
INTRODUCTION
In the normal course of trade sometimes products from specific countries are considered to be traded unfairly. This paper will focus on a real case where dumping was pleaded and antidumping measures were implemented. The aim is to examine a decision made by the Canadian International Trade Tribunal in the case of “Certain structural tubing originating in or exported from the Republic of Korea, The Republic of South Africa and the Republic of Turkey”1.
This paper debates the arguments set out by the Tribunal to establish a connection between dumping and the injury suffered by the Canadian market of structural tubing. Also, an analysis in certain aspects of the industry that might have caused losses even in the absence of competition will be presented. The methodology used for this regard is basically the use of comparison of elements such as market size. Finally, it will be proven that dumping was not the cause of the injury during the period of concern.
Other articles have been written about injury measurement in cases of dumping. Grossman2 (1986) suggests a methodology for conducting the analysis to determine
whether imports were the most significant cause of injury to the U.S. steel industry during the late 1970’s and early 1980’s. He estimates a reduced-form equation for steel industry employment. The resulting estimated coefficients are used to perform counter factual simulations, which allow us to attribute changes in industry employment to their proximate causes. The problem with Grossman’s methodology is that it assumes that the supply of imports is infinitely price elastic, an assumption that is extreme and unrealistic.
1 Inquiry No. NQ-2003-001
2 Grossman, Gene M."Imports as a Cause of Injury: The Case of the U.S. Steel Industry," Journal of
Pindyck and Rottemberg3 (1987) also worked on injury measurement. Their paper sets
forth a straightforward economic and statistical framework for use in Section 201 cases4. This framework is based on the fact that if the domestic industry is
competitive, injury can arise from one or more of three broad sources: adverse shifts in market demand, adverse shifts in domestic supply, or increased imports. Pindyck and Rottemberg show how these sources of injury can be distinguished in theory, and statistically evaluated in practice. They apply the framework to the case of the copper industry.
The problem arises when industries and their workers find themselves overwhelmed by rapidly increasing imports which may flow from a number of factors having nothing to do with international price discrimination5, they can seek temporary relief that
would restrain and limit competition. Shortly speaking, the problem is that antidumping protection can be “abused” to shelter uncompetitive domestic industries from more efficient rather than “unfair” foreign importers (Shin 1998)6.
Konings and Vandenbusshe (2008)7 using first level panel data, estimate the effect of
antidumping duties on the productivity of domestic firms in import-competing industries. Two key results emerge from their analysis. First, while the productivity of the average firm is moderately improved during antidumping protection, it always remains below the productivity of firms never involved in antidumping cases. The gap is never closed between protected and non protected firms. Second, when firm heterogeneity is introduced they find that domestic firms with relatively low initial
3 Pindyck, Robert S. and Julio J. Rotemberg. "Are Imports to Blame?: Attribution of Injury Under the
1974 Trade Act," Journal of Law and Economics, April 1987.
4 It is a section of the United States Trade Act of 1974. If a domestic industry is either seriously injured
or threatened with increased imports a substantial cause of the injury, the law calls for the U.S. International Trade Commission to recommend to the President relief designed to prevent or remedy the injury and assist the industry in adjusting to import conditions.
5 Price discrimination is a strategy to capture more surplus from consumers than is obtainable with
linear uniform pricing
6 H. J. Shin (1998),”Possible Instances of Predatory Pricing in Recent US Antidumping cases” in R.
Lawrence (ed.), Brookings Trade Forum 1998, Brookings Institute Press, pp. 81-88.
7J. Konings and H. Vandenbussche (2008),”Heterogeneous Responses of Firms to Trade Protection”,
productivity have productivity gains during antidumping protection, while firms with high initial productivity experience productivity losses.
At the end of the paper, it will be analyzed whether the implementation of antidumping duties is welfare improving.
The current study is divided in four parts, a definition of concepts which is essential to clarify the terms and to present the terminology to the reader, then a case summary to have a global understanding of the situation, followed by an explanation on how the Tribunal measured the injury and the arguments it gave; finally, I will present my investigation which seeks to prove that factors other than dumping caused the injury suffered by the Canadian industry.
DEFINITON OF CONCEPTS
As we shall see further on, one of the mayor challenges for the accurate determination of dumping is to have well defined concepts. This is fundamental because some terms have wide interpretations that could result in misleading conclusions.
In order to have a broader understanding and clarity of the subject, definitions of the main concepts will be provided hereafter.
Dumping
Dumping as defined in GATT8 occurs when:
“(…) products of one country are introduced into the commerce of another country at less than the normal value of the products,” in the exporting country.
Dumping is conceived as price discrimination which by definition occurs when a firm sells identical products for different prices in different markets. When this practice takes place internationally it is called dumping if the lower price is charged in the export market. Nevertheless, dumping can be viewed as well as below-cost sales. This is also hard to analyze because it could be caused by market conditions or reasons other than harming the export market. In the practice, both concepts (price discrimination and below-cost sales) are taken into account.
Under the WTO dumping may give rise to antidumping measures if it causes or threatens material injury to an established industry in the territory of a contracting party or materially retards the establishment of a domestic industry. The concept of injury will be deeper treated further on.
Normal value and margin of dumping.
Normal value is defined by the World Trade Organization as the comparable price for an import, in the ordinary course of trade, when destined for domestic consumption in the exporting country9. “A product is to be considered as being introduced into the
commerce of an importing country at less than its normal value, if the price of the product exported from one country to another
(a) is less than the comparable price, in the ordinary course of trade, for the like product when destined for consumption in the exporting country, or,
(b) in the absence of such domestic price, is less than either
(i) the highest comparable price for the like product for export to any third country in the ordinary course of trade, or
9 United States Department of Agriculture. Glossary.
(ii) the cost of production of the product in the country of origin plus a reasonable addition for selling cost and profit.”10
The margin of dumping is computed by subtracting “Export sales price” from “Home market sales price11” and divided by “Export sales price”12. If the margin is greater
than zero then there is dumping in the conventional sense. Its importance lies in the fact that “in order to offset or prevent dumping, a contracting party may levy on any dumped product an anti-dumping duty not greater in amount than the margin of dumping in respect of such product”13
Material injury
The definition of this concept is essential because it justifies the execution of legal sanctions that otherwise would not be legal. In strict sense, the Code14 does not
define the term but it is widely understood as “injury widespread in the industry”15
and “seriously negative evolution of at least one of the main factors considered in the injury”16.
In order to implement antidumping duties17, it must be proven that dumping “…causes
or threatens material injury… or materially retards the establishment of a domestic industry18”. Briefly, to allow antidumping duties there must be four components19:
first, there must be injury; second, the injury has to be material; third, the injury 10 See General Agreement of Tariffs and Trade, Article VI. October 30, 1947.
11 This is in other words, normal value.
12 ( Export sales price – Home market sales)/ Export sales price = Margin of dumping (%) 13 See General Agreement of Tariffs and Trade, Article VI. October 30, 1947.
14 Read as 1979 Anti dumping Code that resulted from The Tokyo Round (1973-1979).
15 Angelos PANGRATIS and Edwin VERMULST, Injury in Anti-Dumping procedures, in
http://www.vvgb-law.com/publications/Edwin%20Vermulst/Injury%20in%20Anti-Dumping%20Proceedings.pdf
16 Ibid.
17 Seek to offset injurious dumping. They usually charge extra import duty on the specific product from
the specific exporting country in order to bring its price closer to normal value or to remove the injury to domestic industry in the importing country.
18 Described, in part, as "the domestic producers as a whole of the like goods or those domestic
producers whose collective production of the like goods constitutes a major proportion of the total domestic production of the like goods".
must also be a result from the dumping and not from any other causes and finally the national industry must be injured.
Since there is no precise definition for “material injury”, to prove that the injury is material, Authorities should evaluate the effect of dumped imports in the industry20,
this means the volume of dumped imports on domestic prices and the volume of dumped imports. They also may assess all the economic factors that influence the industry such as actual and potential decrease of input, sales, profits, productivity, employment, wages, development, and market share, among other aspects.
Once it is demonstrated that the injury was not caused by factors other than dumping, a connection between the injury suffered by the industry and the dumped imports should be established. If there is no relation between injury and dumped imports then process initiated by the Tribunal is over. In case the damage can be explained by dumping, it is important to determine its contribution to material injury which should not be negligible21 in order to proceed to formally implement
antidumping duties or other measures.
The Code does not set standard procedures to establish any of the formerly mentioned causalities. Hence, the importance of well defined concepts is that they will lead to satisfactory results. Regardless of the methodology used, it is up to the Tribunal in Canada or the equivalent elsewhere to determine whether dumping caused genuine injury.
Summarizing, dumping must be the cause of the material injury suffered by the domestic industry in order to proceed to implement anti dumping duties, which 20 Ibid.
21 The concept of negligible was introduced by the 1979 Anti dumping code. “The negligible injury is to
be understood as a part of the injurious effect, the later being wider than the former. Indeed, nowhere in the new Code is it argued that the injury is either negligible or material. (…) if the injury caused by dumping is obviously negligible, then the investigation should be terminated. If the injury caused by dumping is not obviously negligible and there is material injury overall (due also to causes other than dumping) then the investigating authority should proceed to a further examination of causation”. Angelos PANGRATIS and Edwin VERMULST, Injury in Anti-Dumping procedures
should not be greater than the margin of dumping. The difficulty of this proof relies in an inexistent standard methodology or sometimes well-defined concepts that do not give room for confusion or inaccuracy.
CASE SUMMARY
The claim that structural tubing was being dumped in the Canadian industry and that was causing injury was presented for the first time to the Canadian International Trade Tribunal (the Tribunal) in 2003. The Tribunal opened an inquiry under the provisions of section 42 of the Special Import Measures Act22 (SIMA), to determine
whether the dumping of structural tubing caused injury to the domestic industry. The data collected by the Tribunal in this case covered a three-and-a-half-year period from January 2000 to June 2003. The following is a description of the evidence presented to the Tribunal and of the results that were reached at the time.
“For the purposes of the Canada Customs and Revenue Agency (CCRA’s) investigation, the subject goods were defined as "structural tubing known as hollow structural sections (HSS)23. The Commissioner's dumping investigation covered imports of certain
HSS originating in or exported from the three subject countries that were released into Canada during the period of investigation from April 1, 2002, to March 31, 2003”24.
The product subject to investigation by the mentioned inquiry is structural tubing. The HSS can be made of carbon and alloy steel, welded, in sizes up to and including 22 The Canadian legislation that deals with subjects such as dumping.
23 From now on “the subject goods”
24 See CERTAIN STRUCTURAL TUBING ORIGINATING IN OR EXPORTED FROM THE REPUBLIC OF KOREA,
16.0 inches (406.4 mm) in outside diameter (O.D.) for round products and up to and including 48.0 inches [(1,219.2 mm)] in periphery for rectangular and square products, commonly but not exclusively made to ASTM A500, ASTM A513, CSA G.40.21-87-50W and similar specifications25.
The goods are used in general construction for structural elements in buildings and bridges, as protective structures on heavy equipment and for other purposes such as highway railings and barriers and outdoor lighting. The goods may also be applied to non-structural uses in manufactured products, such as agricultural implements, trailers and racking and storage systems. The HSS are not used for such things as automotive tubing.26
The domestic producers presented that the subject goods produced material injury to the domestic industry throughout the period of inquiry (April 2002 – March 2003) and that they also threatened to cause material injury. “They argued that the subject goods were imported into Canada in large volumes and at low prices and that they were the direct cause of injury to the domestic industry that began in the last quarter of 2002 and escalated in the first quarter of 2003. They noted that the Canadian market, sales by Canadian producers, for HSS declined between the first half and second half of 2002. However, during this period, sales of imports of the subject goods increased from 1,400 tons in the first half of 2002 to 21,200 tons in the second half of 2002. In a declining market, imports of the subject goods increased due to price undercutting, causing a considerable decline in the volume of domestic shipments”27.
Barloworld one of the only three foreign producers that answered the Tribunal’s questions, argued that imports of the subject goods from South Africa have not caused injury to the domestic industry. “Barloworld stated that 50 percent of its exports to Canada were ASTM A500 grade A, a grade of HSS that is not offered by the 25 Ibid.
26 Ibid.
domestic industry. It alleged that grade A is a lighter gauge than both grade C and CSA grade 350W and is, therefore, less expensive.”28This is relevant because, if their
production costs of making ASTM A500 grade A were lower than producing grade C, then it would mean that Barloworld is not selling below cost (which is a form of dumping already mentioned); therefore, it would not be dumping.
Barloworld also argued that these goods were shipped to Canada from South Africa on a regular schedule and were not substitutable for Canadian products nor did they compete with them, mainly because the specifications for each grade (A, B or C) and the market applications are different in general. However, Barloworld did not provide any evidence concerning the particular specifications of the grade A goods that it shipped to Canada, nor did it specify what market applications its product supplied. Given that, Barloworld defense was weak as it tried to prove that its product (ASTM 500 grade A) was not like goods with the tubes in Canada but it never provided enough evidence to prove it.
The Tribunal found that domestically produced HSS, of the same description as the subject goods, constitutes like goods to the subject goods. Additionally, the evidence indicated that, during the period of investigation, the subject goods from South Africa competed directly with the subject goods from the other subject countries at specific accounts, as well as with the like goods. The Tribunal found this result because it could establish the fungibility of the subject goods. According to the Merriam-Webster Dictionary29, fungible, as an adjective, means “being of such a nature that
one part or quantity may be replaced by another equal part or quantity in the satisfaction of an obligation”, it also means “interchangeable”. The Tribunal noted that if subject goods are fungible will compete with each other in the domestic market, without considerable distinction. Nonetheless, differences in the physical characteristics of the subject goods from one subject country may differentiate them
28 Ibid.
from the other subject goods in the way in which they compete in the domestic market.
As it was mentioned before, Barloworld argued that the goods that it exported from South Africa, ASTM 500 grade A, were different in composition and served to different market applications than the other grades that are predominantly sold by the domestic producers and the other subject countries. However, Barloworld did not provide the evidence to sustain its arguments and the Tribunal found that the HSS produced domestically competed directly with the subject goods. Barloworld’s products, closely resembled and is "like goods" to domestic HSS. “Over 80% of all respondents to the Tribunal's questionnaires on market characteristics reported that domestic goods and the subject goods were fully physically interchangeable”. Also, the evidence did not show that the subject goods from South Africa did not closely look a lot like the subject goods from Korea and Turkey30.
Even more, specific evidence from purchasers of HSS in Canada indicated no differences between the subject goods. In addition, the evidence showed that domestic producers were capable of producing grade A, Barloworld’s main product in Canada, if there was a demand for it.
It should be noted that the subject goods from South Africa and Turkey were not present in the Canadian market in 2000 and 2001, while imports from Korea were present only in small volumes. Throughout this period, the Canadian industry operated at profitable levels. The Canadian industry was also profitably in 2002. In effect, 2002 as a whole was the most profitable year for the industry according to the three-and-a-half-year (January 2000 to June 2003) data examined by the Tribunal. Nonetheless, as will be discussed below, signs of severe difficulties began to materialize towards the end of the year.
30 See CERTAIN STRUCTURAL TUBING ORIGINATING IN OR EXPORTED FROM THE REPUBLIC OF KOREA,
As mentioned before, 2002 was a turbulent year with significant shifts in costs and market forces that affected the industry's performance. Hot-rolled steel sheet (HR) costs went up in the first half of the year. This is issue is important for the development of the cause. Hot-rolled steel sheet is the main component (80%) of HSS. If the price of HR increases, an augmentation in selling price of HSS will be produced at some point.
In addition to the increase of hot-rolled steel sheet (HR), HSS prices increased in the last 6 months of 2002, and the subject goods came in large volumes, in particular in the last quarter of the year. According to the evidence, HSS prices originally rose more rapidly than costs and, as a result, the industry's margins expanded and its profitability augmented. Additionally, profits increased by robust margins on current sales of low-cost inventory that had been accumulated earlier in 2002. This allowed the industry to achieve solid profitability for the year. However, the yearly and half-yearly data during the period of the test hides that, as the effect of the imports began to be increasingly felt in the last three months of 2002, the industry started to experience a setback in performance and some of the major producers reported negative operating income.
This descending tendency accelerated through the first half of 2003 and, by the second quarter of 2003, all the major producers were experiencing remarkable losses in net income. In the case of two producers, their performance deteriorated so drastically that they were not even able to reach positive gross margins. Altogether, in the first half of 2003, the industry lost more than $3 million in operating income in contrast with profits of $7,2 million over the first six months of 2002. These losses were the direct consequence of declining unit sales values that fell more rapidly than costs, thus creating a "cost-price squeeze" on the industry.
The cost decline formerly mentioned could be explained because after peaking late in the summer of 2002, hot-rolled steel sheets (HR) leveled off and then began to
decline towards the end of the same year which means that by 2003 the price of HR should had been on its usual level.
The predominance of the evidence determines that the importation of the subject goods was the central explanation the industry performed so poorly and was incapable to obtain the revenues required to regain its costs of doing business, mainly in the first half of 2003. For the previous reasons, the Tribunal establishes that the injury suffered by the dumping of certain HSS cause material injury to the domestic industry.
To sum up, the first half of 2002 was profitable for the industry. By that same period the price of hot-rolled steel sheet (HR) which is the main component of HSS went up. By the second half of 2002, the subject goods penetrated the Canadian market, during a moment where the price of the domestic goods was elevated, possible due to the increase of HR in the first period of the year, among other factors. Finally, the presence of the subject goods was felt in the first half of 2003 when national producers could not compete with the prices of the subject goods and an important overall loss was produced on the national industry.
MEASUREMENT OF THE INJURY.
The following section will present the two main arguments31 presented by the
Tribunal that led to determine material injury. Because of the arguments presented hereafter, the implementation of antidumping duties is permitted.
Effects of the volume of dumped goods
In this first segment, the effects of the volume of dumped goods on domestic production and sales will be examined.
31 See CERTAIN STRUCTURAL TUBING ORIGINATING IN OR EXPORTED FROM THE REPUBLIC OF KOREA,
Period of inquiry: from mid-2002 to mid-2003
• 43,000 tones of the subject goods entered to Canada during the period of the inquiry.
o Imports of the subject goods were often in excess of 3,000 to 4,000 tons every month.
o This rate of imports represented, in several months, more than 20 percent of domestic producers' monthly HSS shipments
o From December 2002 to January 2003 they peaked at a level of over 10,000 tons. This represented over 30 percent of the domestic producers' monthly shipments.
• HSS imports from Korea doubled in volume during the period of the inquiry.
• Imports from South Africa and Turkey entered the market for the first time and rose to volumes that surpassed those from Korea.
o The monthly Statistics Canada data show a relatively close correlation between the entrance of the subject goods and the diminished shipments by the producers in the 12-month period commencing in mid-2002.
• Their collective market share surged from 1% to 9%
o The initial 1% was comprised almost entirely of imports from Korea that supplied Western Canada.
o The extra market share was gained by the sudden entrance to the market of the subject good coming from South Africa and Turkey. o The Tribunal notes that the 9% of market share held by the three
subject countries in 2003 correspond to the nine points of market share lost by the domestic industry between the first half of 2002 and the first half of 2003
To conclude this part, the Tribunal found that, over the last year of the period of inquiry (mid 2002 to mid 2003), there was a rush in the volume of imports of the subject goods. It was palpable that the subject goods competed with the like goods of the national producers and caused a significant turn down in domestic production and sales.
Effects of dumped goods on prices
In this segment the effect of the volume of dumped goods on domestic prices will be analyzed.
Period of inquiry: from mid-2002 to mid-2003
• At some point during the second half of 2002, steel service centers were faced with the prospect of trying to sell the domestic product at $900 per ton when competing steel service centers were selling the subject goods at $650 per ton.
o Facing such underpricing the industry had little choice but to lower its prices.
• As domestic mills lowered their prices, the prices of the subject goods fell even more
o The average unit selling prices of the subject imports in the
second half of 2002 was $675 per ton.
o In the first half of 2003 the average price fell 9% or $56 per ton, to $619 per ton
• The evidence indicates that prices would not have declined as steeply and rapidly as they did, if it was not for the dumped subject goods
o In about six to eight months, domestic mill prices declined, on average, by over 10%, or $100 per ton. In some particular cases, the price declined 20% on average
It was evident that despite the frequent price reductions the domestic mills made over the period, the ongoing spreads presented continuing competitive difficulties for its members.
In the Tribunal's opinion, the low prices of the subject goods undercut and destabilized prices in the market. The Tribunal also found that price is the key driving factor behind the rush in imports from the three subject countries.
COUNTER ARGUMENTS
The past section presented the arguments given by the Canadian International Trade Tribunal to justify the implementation of anti dumping duties. These arguments led to the conclusion that dumped imports of the subject goods were the cause of genuine (“material”) injury to the domestic industry. Therefore, it was allowed by the law to take measures to offset the injury.
This section of counter arguments starts by assuming that the practice of dumping took place. However, clarifications and possible explanations for the arguments provided by the Tribunal will be presented in order to prove that in spite of the occurrence of dumping, the injury suffered by the domestic industry was not caused by it. Therefore, antidumping measures were not in order.
Increase in the price of the hot-rolled steel sheets
HSS prices are extremely responsive to changes in the price of hot-rolled steel sheet (HR). This happens because, usually, about 80% of the production cost of HSS is consisted of the cost of the HR that goes into the production of HSS. Consequently,
HSS prices will usually tend to rise and fall in relation to movements in the price of HR.
In the course of the first half of 2002, HR prices in Canada augmented sharply and quickly. As said by one witness during the audience32, HR prices continued to rise in
the second half of 2002, peaking late that summer, before leveling off and then starting to decline towards the end of the year. This tendency is seen in the following figure.
Figure 1
Hot-rolled steel sheet prices
Industry price indexes (index, 1997=100)
Primary metal products and metal fabricating products
Source: Statistics Canada, CANSIM table 329-0044
As it can be seen in figure 1, since the first trimester of 2000 the price trend was downward but during 2001 it remained stable with little fluctuations. Finally, it can be appreciated that, as mentioned before, throughout the first half of 2002, HR prices augmented significantly but by the end of 2002 to the first half of 2003, HR prices started to fall and this could have also caused some analogous decrease in prices since, as argued previously, HR and HSS prices follow each other, subject to time lags Figure 2 makes evident the variation of the price tendency in the period of enquiry (January 2000 to June 2003) and clearly demonstrates how the significant increase on the price of HR occurred during the first three quarters of 2002.
Figure 2
Percentage variation in the price of HR Industry price indexes (index, 1997=100)
Primary metal products and metal fabricating products
Source: Statistics Canada, CANSIM table 329-0044
As mentioned earlier, the sharp rise in HR prices that began in the first six months of 2002 consistently worked its way into a correspondingly sharp increase in HSS prices.
Specifically, from the first six months to the second six months of 2002, the average unit value of domestic sales increased from $702 to $867 per ton, an augmentation of almost 25%. The price levels attained by the domestic industry in the second half of 2002 correspond to the highest levels reported by the industry over the Tribunal's three-and-a-half year (January 2000 to June 2003) period of investigation.
Nonetheless, the velocity and extent of the HR and related HSS price increases in North America were not equaled in other places of the world. In Europe or Asia, HR prices did not rise as they did in North America during the concerned period. As a result, during 2002, a growing spread started to develop between HR/HSS prices in North America and those in Europe and Asia. On the word of a number of witnesses, the increasing HSS prices in Canada and the rising spreads between the domestic prices and those existing in other places of the world made some Canadian buyers of HSS to start seeking sources of supply overseas.
This leads us to the conclusion that even in the absence of dumped imports, the sales by domestic firms would have fallen anyway because of the increment in their production costs.
Market Participation of Imports
Figure 3 shows the participation in the market of pipes, tubes, iron and steel imports of different countries. Data is given in thousands of dollars33.
Figure 3
Market participation of imports by country
Source: CANSIM - Imports, by summary import groups (SIG) and other aggregations, by countries or areas of origin, customs basis not seasonally adjusted, monthly (dollars) (data in thousands) - Table 226-0002
Figure 4
Market Participation of South Africa
On one hand, figure 3 clearly illustrates how the United States has the biggest share with approximately 65%. The European Union also has a notorious position with almost 11% of the market which means that basically these two players are the main competitors for the local producer. On the other hand, South Africa is not a main player as the same graphic noticeably states. Figure 4 corroborates how its market participation is less than 1% and with such a low portion changes in imports coming from this country are not likely to affect the market in general.
In figure 5 it is clearly shown how imports of the subject goods visibly increased during the inquiry period. However, was this increment important enough to affect the industry? As it was mentioned before, most likely it was not because of the small fraction South Africa has of the Canadian market. Therefore, it is important to analyze the behavior of the other participants which have more relevance because of the volume they trade, as well as the contribution of South African imports.
Figure 5
Imports from South Africa trend. Data in thousands of dollars.
Source: CANSIM - Imports, by summary import groups (SIG) and other aggregations, by countries or areas of origin, customs basis not seasonally adjusted, monthly (dollars) (data in thousands) - Table 226-0002
Even though imports from other countries did not augment in the same percentage as imports from South Africa during the concerned period, they also increased. Rise that was more significant because Other Countries’ imports represent a larger volume (almost 20% of the market) and their increase was produced for a longer period of time.
The former argument is reaffirmed by figure 6. It illustrates how while from October to December 2002 there was a general fall in imports of almost 23% (from $110.000.000 to $85.000.000 approximately) or $25.000.000 in absolute values, imports from South Africa grew as shown in figure 5. However, the large increase of 52% of South African imports corresponds to $769.00034. The later amount is not
representative enough to be claimed as injurious for this specific industry given the volume it trades.
Figure 6
Imports from all the participant countries in the market excluding South Africa Data in thousands of dollars.
Source: CANSIM - Table 226-0002
One partial conclusion can be made at this point: It has been proven and reinforced that the subject imports are not sufficiently large to produce genuine injury to the Canadian market.
Further on, it will be analyzed if dumped imports from South Africa had a negative impact on sales. This analysis is important to determine whether the subject imports caused material injury to the industry.
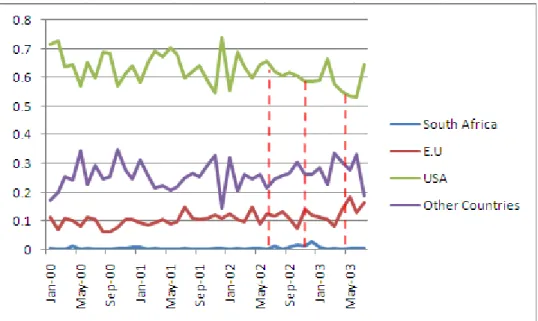
Figure 7 demonstrates a negative correlation between the variation of imports from United States and from other countries and from South Africa. Therefore, when imports from US decreased during July 2002 to January 2003, imports from South Africa augmented capturing 1% to 2.6%35 of the total market. However, imports from
all the countries augmented as well during the mentioned period capturing up to 30%36
of the market which corresponds to a increment of 5% because the usual market share of other countries fluctuates around 25%. Imports from the EU also rose capturing 14% which represents an increase of 4% approximately.
Figure 7
Imports by origin. Data in percentage.
35 See Annex 36 Ibid.
Source: CANSIM - Imports, by summary import groups (SIG) and other aggregations, by countries or areas of origin, customs basis not seasonally adjusted, monthly (dollars) (data in thousands) - Table 226-0002
The last mentioned increments in absolute values were more significant and could have certainly produced a more harmful effect for the industry due to the bigger market participation held by the mentioned players.
Finally, sales effectively suffered a reduction throughout the first months of 2003 but as figure 8 clearly demonstrates it was not during the same period that dumped imports from South Africa penetrated the Canadian market in a relative large volume. Moreover, during the sales reduction in 2003, imports of subject goods where not present in the market appreciably but imports from other countries augmented during period in question.
Figure 8 Sales
Source: CANSIM - Table 226-0002
Briefly, the fall in sales of HSS did not correspond to the period of dumping from the subject country. On the contrary, it corresponded to a phase of increase in imports coming from other countries. This fact that could have had a more profound negative effect on the industry because of the larger volume represented by imports from the alternative suppliers. Moreover, as it was shown in several different figures, the market contribution of subject goods is so little that it could not effectively cause an injury to the industry in spite of dumping.
WELFARE DISCUSSION
This section presents a discussion on the implementation of antidumping (AD) duties. Economic results view will be presented in order to analyze whether the AD duties are to the detriment of welfare.
Different authors have studied the effect on social welfare of third-degree price discrimination. Richard Schmalensee’s (198137) most important result defines an
increase in output as a necessary (even though not sufficient) condition for social welfare38 increase. His results also show that, in general, when price discrimination
(PD) is allowed, both, output and welfare may increase or decrease. The net gain thus can be positive only if total output expands, in other words, only if the increase in sales to the weak market exceeds the drop in sales to the strong market
. Therefore, unless output increases, monopolistic third degree PD generates a net efficiency loss.
Varian (1985)39 supports Schmalensee’s results and adds that in the case of one good
sold in n different markets and produced at constant marginal cost, when the profitability of the new output exceeds the profitability of the old output, valued at the new prices, then welfare must have risen at the discriminatory equilibrium. Varian’s argument is basically a revealed preference relationship.
In our case is difficult to prove lessen in aggregate output because only imports (which are the main concern of this paper) were analyzed. However, the arguments provided by Schmalensee and Varian show how price discrimination under certain conditions can actually be welfare improving which leads us to conclude that the implementation of AD duties instead of preventing negative effects can actually cause them.
CONCLUSION
37Richard Schmalensee, Output and welfare implications of monopolistic third-degree price discrimination, American Economic Review. http://dspace.mit.edu/bitstream/handle/1721.1/1956/SWP-1095-15503913.pdf? sequence=1
38 Social welfare considered as consumers’ plus producers’ surplus.
39 Hal R Varian, Price discrimination and social welfare, The American Economic Review, Vol. 75, No. 4 (Sep.,
Hollow structural sections (HSS) are an essential product for the construction industry due to their multiple uses. From bridges to highway railings, HSS may also be applied to non-structural uses in manufactured products, such as agricultural implements. During the period of inquiry the Canadian industry of HSS suffered significant losses. By the same period, similar goods coming from countries such as the Republic of Korea, South Africa and Turkey penetrated the market in what was called “large volume”. Both facts drove the national producers of HSS to accuse the entrant merchandise to be the cause of their losses. According to the national producers, the mentioned countries were dumping the products which were selling at very low prices making the competition unsustainable for local mills.
The Canadian International Trade Tribunal fund that the subject goods were actually being dumped into Canada and most importantly for this paper, the Tribunal fund that the dumped goods were the cause of the injury suffered by the industry during the period of April 2002, to March 2003. The Tribunal also stated that the low prices of the subject goods undercut and destabilized prices in the market.
Throughout this paper mainly the role of South Africa was taken into account and several reasons were presented to prove that other situations influenced the market in order to provoke a worsening in its levels. This means that even if dumping took place, it was not the main cause of the injury suffered by the Canadian industry of HSS.
The continuous increment in the price of hot-rolled steel sheet (HR) which is the main component of HSS and which has a positive correlation with its price provoked an increment in the price of locally produced HSS. The velocity and extent of the HR and related HSS price increases in North America were not equaled in other markets of the world. In Europe or Asia, HR prices did not rise as they did in North America during the concerned period. This put Canadian mills in disadvantage compared with
imports of HSS not only coming from the subject countries but from any other country producing HSS.
Moreover, it was demonstrated how the market participation of imports from South Africa was too small to affect the overall Canadian market. United States and the European Union have a participation of almost 65% which gives them a preponderant position and makes them the main competitors of the local mills. Besides, an intensive analysis showed how the reduction in sales of HSS did not match the period of entrance of dumped imports coming from South Africa. It is clear that even in the absence of dumped imports, domestic mills’ sales would have fallen because of the increase in their production costs.
In spite of the increase in the volume of imports of the subject goods, we can deduce from the market portion of South African sales that the volume of the imports was neither big nor important enough to cause a sensitive impact on the industry. So, even if the spread between domestic prices and import’s prices was wide, the local demand was not satisfy by the low-price-imports. Therefore, dumped imports were not the cause of the injury of the Canadian industry during the period of concern.
BIBLIOGRAPHY
i. Certain structural tubing originating in or exported from the Republic of Korea, the Republic of South Africa and the Republic of Turkey. Inquiry No.
NQ-2003-001
ii. Grossman, Gene M."Imports as a Cause of Injury: The Case of the U.S. Steel Industry," Journal of International Economics, Vol. 20, No. 3/4, pp.201-22 4, May 1986.
iii. Pindyck, Robert S. and Julio J. Rotemberg. "Are Imports to Blame?: Attribution of Injury Under the 1974 Trade Act," Journal of Law and Economics, April 1987.
iv. H. J. Shin (1998),”Possible Instances of Predatory Pricing in Recent US Antidumping cases” in R. Lawrence (ed.), Brookings Trade Forum 1998, Brookings Institute Press, pp. 81-88.
v. J. Konings and H. Vandenbussche (2008),”Heterogeneous Responses of Firms to Trade Protection”, Journal of International Economics, forthcoming. CEPR Discussion Paper 6724
vi. General Agreement of Tariffs and Trade, Article VI. October 30, 1947
vii. Angelos PANGRATIS and Edwin VERMULST, Injury in Anti-Dumping procedures viii. Richard Schmalensee, Output and welfare implications of monopolistic
third-degree price discrimination, American Economic Review.
ix. Hal R Varian, Price discrimination and social welfare, The American Economic Review, Vol. 75, No. 4 (Sep., 1985), pp. 870-875.
ANNEX
IMPORTS
South
Africa %of Total EU %of Total USA %of Total
Other Countrie
s %of Total Totals
Jan-00 203 0.19% 11,767 11% 75,183 71% 18,168 17% 105,321 Feb-00 181 0.16% 7,943 7% 82,280 73% 22,638 20% 113,042 Mar-00 76 0.06% 13,467 11% 80,222 64% 31,856 25% 125,621 Apr-00 1,119 1.09% 10,543 10% 66,201 64% 24,976 24% 102,839 May-00 213 0.18% 9,917 8% 68,919 57% 41,542 34% 120,591 Jun-00 535 0.52% 11,744 11% 66,884 65% 23,386 23% 102,549 Jul-00 69 0.07% 9,637 10% 55,829 60% 27,516 30% 93,051 Aug-00 208 0.18% 7,344 6% 81,415 69% 29,164 25% 118,131 Sep-00 2 0.00% 6,318 6% 69,681 68% 25,911 25% 101,912 Oct-00 329 0.26% 9,539 8% 71,508 57% 43,519 35% 124,895 Nov-00 547 0.45% 12,805 10% 74,965 61% 33,827 28% 122,144 Dec-00 603 0.59% 10,833 11% 65,160 64% 25,049 25% 101,645 Jan-01 905 0.68% 12,637 10% 77,634 58% 41,836 31% 133,012 Feb-01 101 0.09% 9,387 9% 70,954 65% 28,311 26% 108,753 Mar-01 215 0.20% 10,188 9% 75,589 69% 23,483 21% 109,475 Apr-01 118 0.12% 10,219 11% 65,138 67% 21,688 22% 97,163 May-01 2 0.00% 8,262 9% 64,889 70% 19,254 21% 92,407 Jun-01 0 0.00% 10,042 10% 70,146 68% 22,811 22% 102,999 Jul-01 344 0.35% 14,457 15% 58,392 60% 24,506 25% 97,699 Aug-01 169 0.15% 12,331 11% 70,443 62% 30,318 27% 113,261 Sep-01 13 0.01% 11,170 11% 67,925 64% 26,815 25% 105,923 Oct-01 193 0.17% 12,917 11% 69,226 59% 34,560 30% 116,896 Nov-01 285 0.25% 14,096 12% 62,899 55% 37,735 33% 115,015 Dec-01 532 0.55% 10,727 11% 71,971 74% 14,249 15% 97,479 Jan-02 98 0.09% 14,117 12% 63,600 56% 36,532 32% 114,347 Feb-02 253 0.28% 9,586 10% 62,801 69% 18,747 21% 91,387 Mar-02 170 0.17% 9,529 10% 62,549 64% 25,623 26% 97,871 Apr-02 240 0.24% 14,744 15% 59,647 60% 24,769 25% 99,400 May-02 354 0.35% 9,083 9% 65,483 64% 26,698 26% 101,618 Jun-02 168 0.18% 11,459 12% 61,433 66% 20,255 22% 93,315 Jul-02 1,111 1.21% 10,843 12% 57,126 62% 22,752 25% 91,832 Aug-02 103 0.10% 13,088 13% 59,901 61% 25,718 26% 98,810 Sep-02 653 0.70% 10,040 11% 57,748 62% 25,125 27% 93,566 Oct-02 1,475 1.33% 8,102 7% 67,290 61% 33,772 31% 110,639
Nov-02 1,188 1.26% 13,092 14% 55,084 59% 24,751 26% 94,115 Dec-02 2,244 2.60% 10,594 12% 50,700 59% 22,862 26% 86,400 Jan-03 987 0.88% 12,720 11% 66,458 59% 32,204 29% 112,369 Feb-03 70 0.08% 9,575 11% 60,630 67% 20,722 23% 90,997 Mar-03 242 0.21% 9,418 8% 65,468 58% 38,287 34% 113,415 Apr-03 67 0.06% 15,650 14% 60,713 55% 33,824 31% 110,254 May-03 389 0.39% 18,081 18% 52,834 54% 27,294 28% 98,598 Jun-03 220 0.22% 12,786 13% 52,166 53% 32,798 33% 97,970 Jul-03 314 0.38% 13,563 16% 53,804 64% 15,890 19% 83,571 Total 17,30 8 0.38% 484,36 0 11% 2,818,8 88 63% 1,181,7 41 26% 4,502,29 7 SALES South Africa Other Countrie
s Total Total Sales
Jan-00 203 105,118 105,321 223,355 Feb-00 181 112,861 113,042 235,973 Mar-00 76 125,545 125,621 264,275 Apr-00 1,119 101,720 102,839 220,206 May-00 213 120,378 120,591 249,263 Jun-00 535 102,014 102,549 259,816 Jul-00 69 92,982 93,051 191,712 Aug-00 208 117,923 118,131 228,641 Sep-00 2 101,910 101,912 217,599 Oct-00 329 124,566 124,895 253,227 Nov-00 547 121,597 122,144 253,427 Dec-00 603 101,042 101,645 212,013 Jan-01 905 132,107 133,012 241,301 Feb-01 101 108,652 108,753 231,391 Mar-01 215 109,260 109,475 253,703 Apr-01 118 97,045 97,163 204,038 May-01 2 92,405 92,407 233,113 Jun-01 0 102,999 102,999 243,363 Jul-01 344 97,355 97,699 199,885 Aug-01 169 113,092 113,261 259,622 Sep-01 13 105,910 105,923 239,766 Oct-01 193 116,703 116,896 251,592 Nov-01 285 114,730 115,015 224,069 Dec-01 532 96,947 97,479 184,948
Jan-02 98 114,249 114,347 241,294 Feb-02 253 91,134 91,387 220,913 Mar-02 170 97,701 97,871 220,428 Apr-02 240 99,160 99,400 212,853 May-02 354 101,264 101,618 232,460 Jun-02 168 93,147 93,315 233,847 Jul-02 1,111 90,721 91,832 224,073 Aug-02 103 98,707 98,810 244,219 Sep-02 653 92,913 93,566 234,557 Oct-02 1,475 109,164 110,639 248,550 Nov-02 1,188 92,927 94,115 262,207 Dec-02 2,244 84,156 86,400 238,615 Jan-03 987 111,382 112,369 282,095 Feb-03 70 90,927 90,997 269,879 Mar-03 242 113,173 113,415 281,887 Apr-03 67 110,187 110,254 222,173 May-03 389 98,209 98,598 242,545 Jun-03 220 97,750 97,970 244,601 Jul-03 314 83,257 83,571 237,028 Total 17,308 4,484,98 9 4,502,2 97 10,170,5 22